Analysis Summary
Notes:
- 1) No attempt has been made to eliminate the non-significant decimal places.
- 2) This batgrbproduct analysis is done using the HEASARC data.
- 3) This batgrbproduct analysis is using the flight position for the mask-weighting calculation.
======================================================================
                  BAT GRB EVENT DATA PROCESSING REPORT
    Process Script Ver: batgrbproduct v2.46
    Process Start Time: Mon Nov 16 00:58:28 EST 2015
             Host Name: bat1
   Current Working Dir: /local/data/bat1/alien/Swift_3rdBATcatalog/event/batevent_reproc/trigger662330
======================================================================

  Trigger: 00662330      Segment: 000

  BAT Trigger Time: 467963445.696   [s; MET]
      Trigger Stop: 467963446.208   [s; MET]
               UTC: 2015-10-31T05:50:30.348300    [includes UTCF correction]
       Where From?: TDRSS position message

  BAT
    RA: 83.198988567077   Dec: -39.0915640450626  [deg; J2000]

     Catalogged Source?: NO
     Point Source?:      YES
     GRB Indicated?:     YES    [ by BAT flight software ]
     Image S/N Ratio:    7.43
     Image Trigger?:     NO
     Rate S/N Ratio:     11.1803398874989  [ if not an image trigger ]
     Image S/N Ratio:    7.43

  Analysis Position:   [ source = BAT ]
    RA: 83.198988567077   Dec: -39.0915640450626  [deg; J2000]

  Refined Position:   [ source = BAT pre-slew burst ]
    RA: 83.1889608644317   Dec: -39.1245877736125  [deg; J2000]
        { 05h 32m 45.4s , -39d 07' 28.5" }
         +/- 1.30831475966945 [arcmin] (estimated 90% radius based on SNR)
         +/- 0.533711679462792 [arcmin] (formal 1-sigma fit error)
    SNR: 20.7198500121194

  Angular difference between the analysis and refined position is 2.035682 arcmin

  Partial Coding Fraction: 0.6796875    [ including projection effects ]

  Duration
     T90: 5 +/- 2.23606797749979
        Measured from: 0.304000020027161
                   to: 5.30400002002716     [s; relative to TRIGTIME]
     T50: 2 +/- 1
        Measured from: 1.30400002002716
                   to: 3.30400002002716     [s; relative to TRIGTIME]


  Fluence
     Peak Flux  (peak 1 second)
        Measured from: 1.30400002002716
                   to: 2.30400002002716     [s; relative to TRIGTIME]
     Total Fluence
        Measured from: 0.304000020027161
                   to: 6.30400002002716     [s; relative to TRIGTIME]

             Band 1     Band 2     Band 3     Band 4
              15-25      25-50     50-100    100-350     keV
 Total     0.291242   0.246072   0.107912   0.010938
           0.017300   0.017711   0.014720   0.012045 [error]
 Peak      0.066226   0.079520   0.036103   0.006021
           0.007388   0.007652   0.006280   0.005030 [error]

     [ fluence units of on-axis counts / fully illuminated detector ]

======================================================================


====== Table of the duration information =============================

        Value   tstart    tstop
T100    6.000    0.304    6.304
T90     5.000    0.304    5.304
T50     2.000    1.304    3.304
Peak    1.000    1.304    2.304


====== Spectral Analysis Summary =====================================

Model      : spectral model: simple power-law (PL) and cutoff power-law (CPL)
Ph_index   : photon index: E^{Ph_index}
Ph_90err   : 90% error of the photon index
Epeak      : Epeak in keV
Epeak_90err: 90% error of Epeak
Norm       : normalization at 50 keV in both the PL model and CPL model
Nomr_90err : 90% error of the normalization
chi2       : Chi-Squared
dof        : degree of freedo

=== Time-averaged spectral analysis ===
(Best model with acceptable fit: PL)

Model Ph_index Ph_90err_low Ph_90err_hi  Epeak  Epeak_90err_low  Epeak_90err_hi  Norm       Nomr_90err_low    Norm_90err_hi    chi2    dof
PL      -2.363    -0.172      0.163       -           -               -         5.80e-03     -6.76e-04          6.64e-04      47.170   57
CPL     -1.967    -0.031      0.518        3.352      -2.415        21.500      9.96e-03     -1.88e-03          1.56e-03      47.160   56


=== 1-s peak spectral analysis ===
(Best model with acceptable fit: PL)

Model Ph_index Ph_90err_low Ph_90err_hi  Epeak  Epeak_90err_low  Epeak_90err_hi  Norm       Nomr_90err_low    Norm_90err_hi    chi2    dof
PL      -2.053     -0.212     0.200       -           -               -         1.12e-02     -1.60e-03          1.56e-03      39.530   57
CPL     -1.346     -0.849     1.105       37.454      N/A           N/A         2.93e-02        N/A               N/A         37.570   56


=== Fluence/Peak Flux Summary ===

              Model    Band1     Band2     Band3     Band4     Band5     Total
                       15-25     25-50    50-100    100-350    15-150    15-350    keV
Fluence         PL   1.01e-07  1.10e-07  8.54e-08  1.09e-07  3.37e-07  4.05e-07   erg/cm2
      90%_error_low -1.08e-08 -9.04e-09 -1.35e-08 -3.02e-08 -3.09e-08 -4.84e-08   erg/cm2
      90%_error_hi   1.10e-08  8.99e-09  1.39e-08  3.73e-08  3.15e-08  5.33e-08   erg/cm2
Peak flux       PL   7.85e-01  5.71e-01  2.75e-01  1.88e-01  1.72e+00  1.82e+00   ph/cm2/s
      90%_error_low -1.23e-01 -6.41e-02 -5.06e-02 -5.83e-02 -1.94e-01 -2.04e-01   ph/cm2/s
      90%_error_hi   1.26e-01  6.40e-02  5.14e-02  7.23e-02  1.94e-01  2.05e-01   ph/cm2/s

Fluence        CPL    N/A      N/A      N/A      N/A      N/A      N/A      erg/cm2
      90%_error_low -1.08e-08 -9.04e-09 -1.35e-08 -3.02e-08 -3.09e-08 -4.84e-08   erg/cm2
      90%_error_hi   1.10e-08  8.99e-09  1.39e-08  3.73e-08  3.15e-08  5.33e-08   erg/cm2
Peak flux      CPL   7.42e-01  6.21e-01  2.69e-01  7.22e-02  1.68e+00  1.70e+00   ph/cm2/s
      90%_error_low -1.36e-01 -4.43e-02 -6.43e-02 -7.22e-02 -1.98e-01 -2.09e-01   ph/cm2/s
      90%_error_hi   1.37e-01  9.28e-02  5.79e-02  1.60e-01  1.98e-01  2.30e-01   ph/cm2/s

======================================================================
Image
Pre-slew 15.0-350.0 keV image (Event data)
#   RAcent    DECcent   POSerr    Theta     Phi              Peak Cts       SNR   Name
   83.1890   -39.1246   0.0093    36.4261  -170.6488         0.6707202     20.720 TRIG_00662330

Foreground time interval of the image:
  0.304   6.304 (delta_t =   6.000 [sec])
Background time interval of the image:
-50.595   0.304 (delta_t =  50.899 [sec])
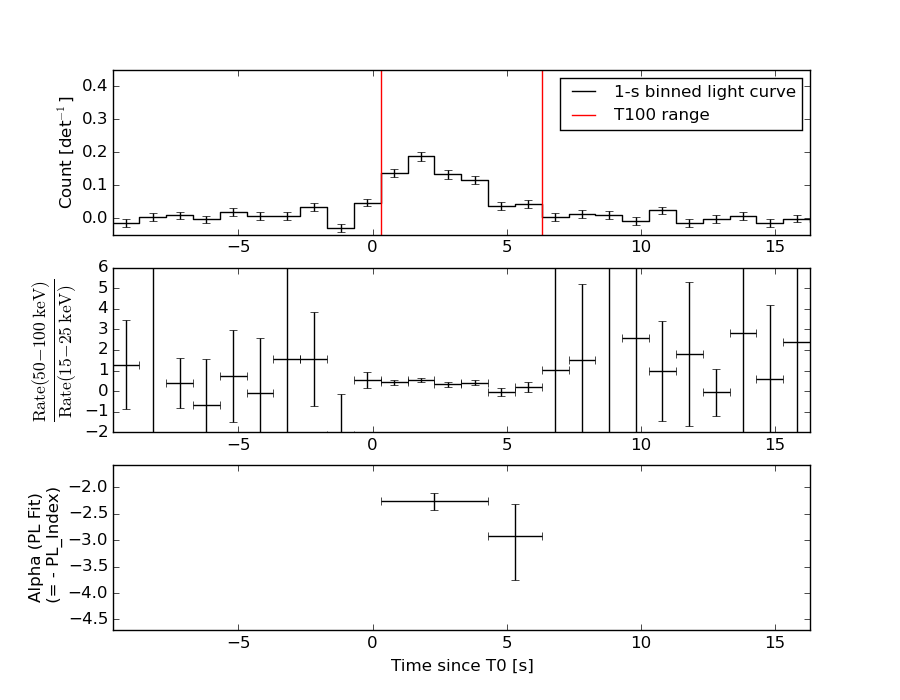
Light Curves
The light curve is interactive. Please use the tool bars for zooming and plotting options.
Full-time range; 1 s binning
Other quick-look light curves:
- 64 ms binning (zoomed)
- 16 ms binning (zoomed)
- 8 ms binning (zoomed)
- 2 ms binning (zoomed)
- SN=5 or 10 s binning (full-time range)
- Raw light curve
Spectra
- 64 ms binning (zoomed)
- 16 ms binning (zoomed)
- 8 ms binning (zoomed)
- 2 ms binning (zoomed)
- SN=5 or 10 s binning (full-time range)
- Raw light curve
Spectra
Notes:
- 1) The fitting includes the systematic errors.
- 2) When the burst includes telescope slew time periods, the fitting uses an average response file made from multiple 5-s response files through out the slew time plus single time preiod for the non-slew times, and weighted by the total counts in the corresponding time period using addrmf. An average response file is needed becuase a spectral fit using the pre-slew DRM will introduce some errors in both a spectral shape and a normalization if the PHA file contains a lot of the slew/post-slew time interval.
- 3) For fits to more complicated models (e.g. a power-law over a cutoff power-law), the BAT team has decided to require a chi-square improvement of more than 6 for each extra dof.
Time averaged spectrum fit using the average DRM
Power-law model
Time interval is from    0.304 sec. to    6.304 sec.

Spectral model in power-law:
------------------------------------------------------------
Parameters  : value       lower 90%   higher 90%
Photon index: -2.36257     ( -0.172341   0.163314 )
Norm@50keV  : 5.79990E-03    ( -0.000675628   0.000663838 )
------------------------------------------------------------
#Fit statistic : Chi-Squared =          47.17 using 59 PHA bins.
# Reduced chi-squared =         0.8275 for     57 degrees of freedom
# Null hypothesis probability =   8.202299e-01

Photon flux (15-150 keV)    in 6 sec: 1.05021 ( -0.083194  0.08324 ) ph/cm2/s
Energy fluence (15-150 keV)             : 3.36761e-07 ( -3.09159e-08  3.14625e-08 ) ergs/cm2
Cutoff power-law model
Time interval is from    0.304 sec. to    6.304 sec.
Spectral model in the cutoff power-law:
------------------------------------------------------------
Parameters  : value       lower 90%   higher 90%
Photon index: -1.98221     ( -0.0277134   0.521085 )
Epeak [keV] : 1.86935      ( -0.889343 23.0249 )
Norm@50keV  : 9.72218E-03    ( -0.00163922   0.00180098 )
------------------------------------------------------------
#Fit statistic : Chi-Squared =          47.12 using 59 PHA bins.
# Reduced chi-squared =         0.8415 for     56 degrees of freedom
# Null hypothesis probability =   7.950177e-01

Photon flux (15-150 keV)    in 6 sec:  (    ) ph/cm2/s
Energy fluence (15-150 keV)             : 0 ( 0  0 ) ergs/cm2
1-s peak spectrum fit
Power-law model
Time interval is from    1.304 sec. to    2.304 sec.

Spectral model in power-law:
------------------------------------------------------------
Parameters  : value       lower 90%   higher 90%
Photon index: -2.05274     ( -0.211756   0.199694 )
Norm@50keV  : 1.11824E-02    ( -0.00159857   0.00156187 )
------------------------------------------------------------
#Fit statistic : Chi-Squared =          39.53 using 59 PHA bins.
# Reduced chi-squared =         0.6935 for     57 degrees of freedom
# Null hypothesis probability =   9.622656e-01

Photon flux (15-150 keV)    in 1 sec: 1.71948 ( -0.19364  0.19371 ) ph/cm2/s
Energy fluence (15-150 keV)             : 1.03493e-07 ( -1.35681e-08  1.38021e-08 ) ergs/cm2
Cutoff power-law model
Time interval is from    1.304 sec. to    2.304 sec.
Spectral model in the cutoff power-law:
------------------------------------------------------------
Parameters  : value       lower 90%   higher 90%
Photon index: -1.34609     ( -0.849172   1.10541 )
Epeak [keV] : 37.4536      (   )
Norm@50keV  : 2.92912E-02    (     )
------------------------------------------------------------
#Fit statistic : Chi-Squared =          37.57 using 59 PHA bins.
# Reduced chi-squared =         0.6710 for     56 degrees of freedom
# Null hypothesis probability =   9.722536e-01

Photon flux (15-150 keV)    in 1 sec: 1.68438 ( -0.19822  0.19831 ) ph/cm2/s
Energy fluence (15-150 keV)             : 9.67008e-08 ( -1.52341e-08  1.59541e-08 ) ergs/cm2
Time-resolved spectra
Distribution
T90 vs. Hardness ratio plot
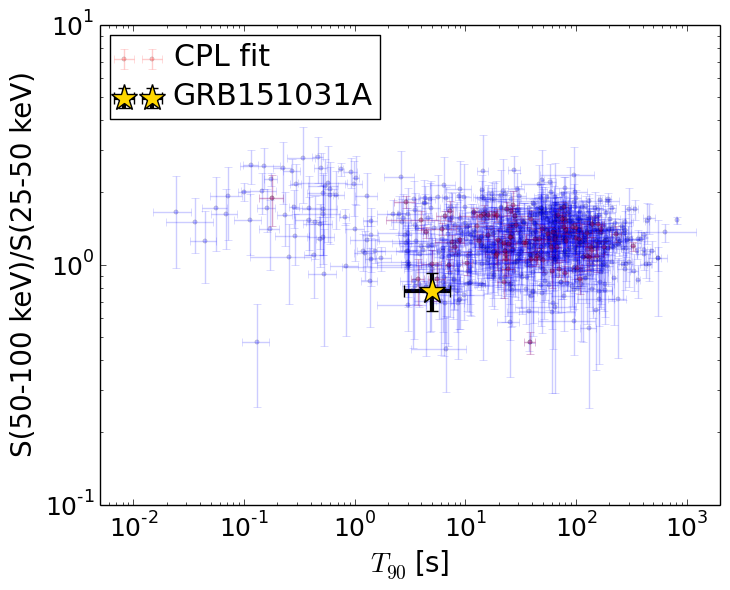
T90                                   = 5 sec.
Hardness ratio (energy fluence ratio) = 0.776364
S(25-50 keV) vs. S(50-100 keV) plot
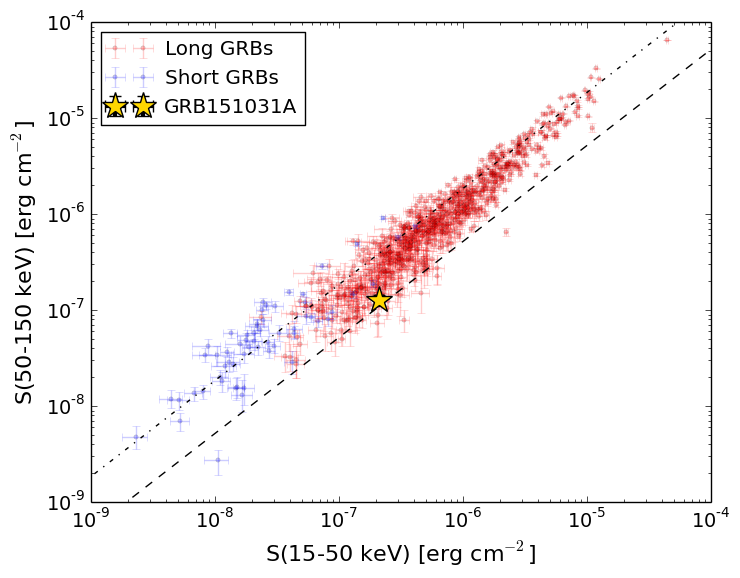
S(25-50 keV)  = 1.10e-07
S(50-100 keV) = 8.54e-08
Mask shadow pattern
IMX = -7.281587782672493E-01, IMY = 1.199093804592359E-01
Spacecraft aspect plot
Pre-burst image of 15-350 keV band
Time interval of the image:
-50.595410 0.304000

# RAcent  DECcent POSerr Theta    Phi  PeakCts   SNR AngSep     Name
#  [deg]    [deg]    ['] [deg]  [deg]                   [']
354.4498 -43.8590    2.4  27.5   -5.8   0.3437   4.8 ------     UNKNOWN
Pre-slew background subtracted image of 15-350 keV band
Time interval of the image:
0.304000 6.304000

# RAcent  DECcent POSerr Theta    Phi  PeakCts   SNR AngSep     Name
#  [deg]    [deg]    ['] [deg]  [deg]                   [']
 87.5103 -14.4508    2.0  55.0  165.5   0.8283   5.7 ------     UNKNOWN
 83.1890 -39.1246    0.6  36.4 -170.6   0.6706  20.7 ------     UNKNOWN
 54.1634 -75.0811    2.3  29.8  -97.6   0.2008   5.1 ------     UNKNOWN
Post-slew image of 15-350 keV band
Time interval of the image:
283.804610 364.604580

# RAcent  DECcent POSerr Theta    Phi  PeakCts   SNR AngSep     Name
#  [deg]    [deg]    ['] [deg]  [deg]                   [']
 83.6284  22.0206    0.4  29.4  156.5   3.4016  27.2    0.5     Crab
100.6786  33.0549    2.0  45.8  171.4   1.1568   5.7 ------     UNKNOWN
105.0101  34.9381    2.1  49.5  173.7   1.4196   5.5 ------     UNKNOWN
124.6364  26.9558    2.8  57.5 -165.4   2.0312   4.0 ------     UNKNOWN
 55.2615 -56.8507    2.6  53.0  -23.4   1.1991   4.4 ------     UNKNOWN
 86.0979 -56.4292    2.8  50.6  -44.6   2.0974   4.1 ------     UNKNOWN