Analysis Summary
Notes:
- 1) No attempt has been made to eliminate the non-significant decimal places.
- 2) This batgrbproduct analysis is done using the HEASARC data.
- 3) This batgrbproduct analysis is using the flight position for the mask-weighting calculation.
======================================================================
                  BAT GRB EVENT DATA PROCESSING REPORT
    Process Script Ver: batgrbproduct v2.46
    Process Start Time: Sun Dec 13 16:15:07 EST 2015
             Host Name: bat1
   Current Working Dir: /local/data/bat1/alien/Swift_3rdBATcatalog/event/batevent_reproc/trigger662757
======================================================================

  Trigger: 00662757      Segment: 000

  BAT Trigger Time: 468609592   [s; MET]
      Trigger Stop: 468609952   [s; MET]
               UTC: 2015-11-07T17:19:36.617900    [includes UTCF correction]
       Where From?: TDRSS position message

  BAT
    RA: 217.139076700173   Dec: -59.6797006612809  [deg; J2000]

     Catalogged Source?: NO
     Point Source?:      YES
     GRB Indicated?:     NO    [ by BAT flight software ]
     Image S/N Ratio:    7.65
     Image Trigger?:     YES
     Rate S/N Ratio:     0  [ if not an image trigger ]
     Image S/N Ratio:    7.65

  Analysis Position:   [ source = BAT ]
    RA: 217.139076700173   Dec: -59.6797006612809  [deg; J2000]

  Refined Position:   [ source = BAT pre-slew burst ]
    RA: 217.24555948569   Dec: -59.6883227190886  [deg; J2000]
        { 14h 28m 58.9s , -59d 41' 18.0" }
         +/- 3.37944190594198 [arcmin] (estimated 90% radius based on SNR)
         +/- 2.44689193314876 [arcmin] (formal 1-sigma fit error)
    SNR: 5.3410364776676

  Angular difference between the analysis and refined position is 3.266178 arcmin

  Partial Coding Fraction: 1    [ including projection effects ]

  Duration
     T90: N/A +/- N/A
        Measured from: N/A
                   to: N/A     [s; relative to TRIGTIME]
     T50: N/A +/- N/A
        Measured from: N/A
                   to: N/A     [s; relative to TRIGTIME]

     WARNING: battblocks failed.  Used TDRSS fore/background intervals

======================================================================


====== Table of the duration information =============================

        Value   tstart    tstop
T100     N/A      N/A      N/A
T90      N/A      N/A      N/A
T50      N/A      N/A      N/A
Peak     N/A      N/A      N/A


====== Spectral Analysis Summary =====================================

Model      : spectral model: simple power-law (PL) and cutoff power-law (CPL)
Ph_index   : photon index: E^{Ph_index}
Ph_90err   : 90% error of the photon index
Epeak      : Epeak in keV
Epeak_90err: 90% error of Epeak
Norm       : normalization at 50 keV in both the PL model and CPL model
Nomr_90err : 90% error of the normalization
chi2       : Chi-Squared
dof        : degree of freedo

=== Time-averaged spectral analysis ===
(Best model with acceptable fit: N/A)

Model Ph_index Ph_90err_low Ph_90err_hi  Epeak  Epeak_90err_low  Epeak_90err_hi  Norm       Nomr_90err_low    Norm_90err_hi    chi2    dof
PL      N/A        N/A       N/A          -           -               -           N/A           N/A               N/A         N/A        N/A
CPL     N/A        N/A        N/A          N/A         N/A           N/A           N/A           N/A               N/A         N/A        N/A


=== 1-s peak spectral analysis ===
(Best model with acceptable fit: N/A)

Model Ph_index Ph_90err_low Ph_90err_hi  Epeak  Epeak_90err_low  Epeak_90err_hi  Norm       Nomr_90err_low    Norm_90err_hi    chi2    dof
PL      N/A         N/A       N/A          -           -               -           N/A           N/A               N/A         N/A        N/A
CPL     N/A         N/A       N/A          N/A         N/A           N/A           N/A           N/A               N/A         N/A        N/A


=== Fluence/Peak Flux Summary ===

              Model    Band1     Band2     Band3     Band4     Band5     Total
                       15-25     25-50    50-100    100-350    15-150    15-350    keV
Fluence         PL    N/A      N/A      N/A      N/A      N/A      N/A      erg/cm2
Image
Pre-slew 15.0-50.0 keV image (Event data)
#RAcent DECcent POSerr Theta  Phi  Peak_Cts  SNR Name
217.139 -59.680 0.000 9.538 -51.058 1.366 6.972 TRIG_00662757

Image time interval: 0.000 to 360.000 [sec]
Light Curves
Note: The mask-weighted lightcurves have units of either count/det or counts/sec/det, where a det is 0.4 x 0.4 = 0.16 sq cm.
Full-time range; 1 s binning
Other quick-look light curves:
- 64 ms binning (zoomed)
- 16 ms binning (zoomed)
- 8 ms binning (zoomed)
- 2 ms binning (zoomed)
- SN=5 or 10 s binning (full-time range)
- Raw light curve
Spectra
- 64 ms binning (zoomed)
- 16 ms binning (zoomed)
- 8 ms binning (zoomed)
- 2 ms binning (zoomed)
- SN=5 or 10 s binning (full-time range)
- Raw light curve
Spectra
Notes:
- 1) The fitting includes the systematic errors.
- 2) When the burst includes telescope slew time periods, the fitting uses an average response file made from multiple 5-s response files through out the slew time plus single time preiod for the non-slew times, and weighted by the total counts in the corresponding time period using addrmf. An average response file is needed becuase a spectral fit using the pre-slew DRM will introduce some errors in both a spectral shape and a normalization if the PHA file contains a lot of the slew/post-slew time interval.
- 3) For fits to more complicated models (e.g. a power-law over a cutoff power-law), the BAT team has decided to require a chi-square improvement of more than 6 for each extra dof.
Time averaged spectrum fit using the average DRM
Power-law model

Multiple GTIs in the spectrum
tstart tstop
Photon index:       (       )
Cutoff power-law model

Multiple GTIs in the spectrum
tstart tstop
Photon index:       (       )
1-s peak spectrum fit
Power-law model

Time interval is from    0.000 sec. to  360.000 sec.
Photon index:       (       )
Cutoff power-law model

Time interval is from    0.000 sec. to  360.000 sec.
Photon index:       (       )
Time-resolved spectra

Distribution
T90 vs. Hardness ratio plot
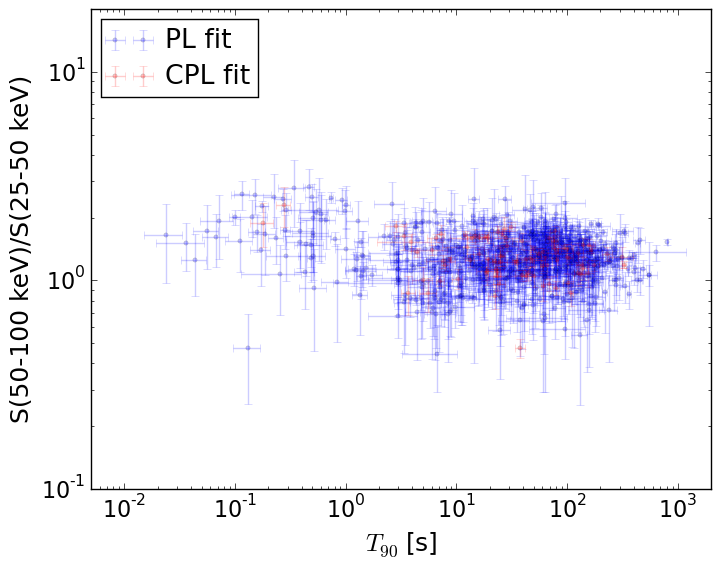
T90                                   = N/A sec.
Hardness ratio (energy fluence ratio) = N/A
S(15-50 keV) vs. S(50-150 keV) plot
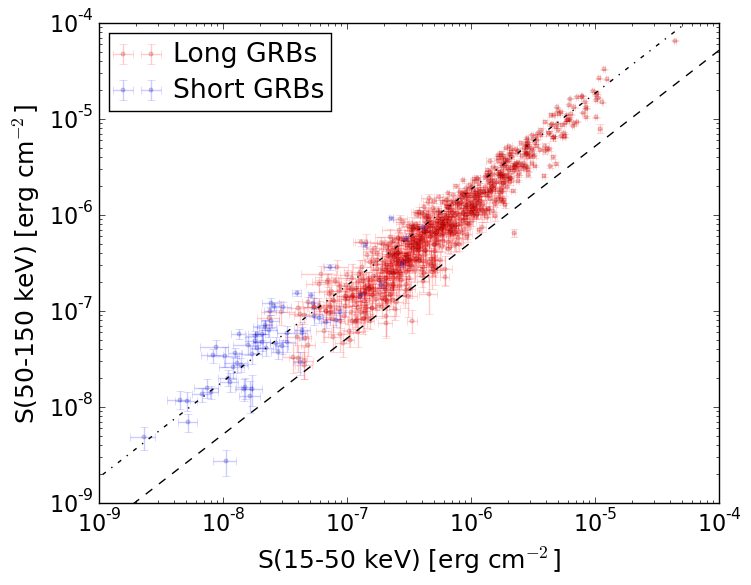
S(15-50 keV)  = N/A
S(50-150 keV) = N/A
The dash-dotted line and the dashed line traces the fluences calculated from the Band function with Epeak = 15 and 150 keV, respectively. Both lines assume a canonical values of alpha = -1 and beta = -2.5.
Mask shadow pattern
IMX = 0.1056101766, IMY = 0.130690317358
Spacecraft aspect plot
Bright source in the pre-burst/pre-slew/post-slew images
Pre-burst image of 15-350 keV band
Time interval of the image:
Pre-slew background subtracted image of 15-350 keV band
Time interval of the image:
0.000000 360.000000

# RAcent  DECcent POSerr Theta    Phi  PeakCts   SNR AngSep     Name
#  [deg]    [deg]    ['] [deg]  [deg]                   [']
135.4909 -40.5774    3.0  42.5  140.1   2.9621   3.9    2.2	Vela X-1
170.3142 -60.6502    1.5  13.3  135.7   1.9424   7.8    1.6	Cen X-3
186.2886 -62.7992    6.1   5.5  133.4   0.4982   1.9   10.2	GX 301-2
255.8501 -37.9296    4.9  42.2  -48.9   1.5536   2.4    8.2	4U 1700-377
256.4548 -36.4253    9.2  43.8  -49.6   0.9489   1.3    0.9	GX 349+2
264.8007 -44.3698   31.9  41.2  -35.0   0.1521   0.4    5.4	4U 1735-44
262.8235 -33.8340   12.6  48.8  -45.6   1.0909   0.9    8.3	GX 354-0
163.3365 -23.2427    2.8  45.9 -177.9   2.0276   4.2 ------	UNKNOWN
217.2455 -59.6882    2.2   9.6  -50.9   1.3825   5.3 ------	UNKNOWN
250.2045 -53.7328    2.1  27.9  -35.3   1.5737   5.7 ------	UNKNOWN
Post-slew image of 15-350 keV band
Time interval of the image: