Analysis Summary
Notes:
- 1) No attempt has been made to eliminate the non-significant decimal places.
- 2) This batgrbproduct analysis is done using the HEASARC data.
- 3) This batgrbproduct analysis is using the flight position for the mask-weighting calculation.
======================================================================
                  BAT GRB EVENT DATA PROCESSING REPORT
    Process Script Ver: batgrbproduct v2.46
    Process Start Time: Sun Dec 13 16:12:19 EST 2015
             Host Name: bat1
   Current Working Dir: /local/data/bat1/alien/Swift_3rdBATcatalog/event/batevent_reproc/trigger663074
======================================================================

  Trigger: 00663074      Segment: 000

  BAT Trigger Time: 468923618.816   [s; MET]
      Trigger Stop: 468923619.84   [s; MET]
               UTC: 2015-11-11T08:33:23.417180    [includes UTCF correction]
       Where From?: TDRSS position message

  BAT
    RA: 56.8281970680934   Dec: -44.1639820922363  [deg; J2000]

     Catalogged Source?: NO
     Point Source?:      YES
     GRB Indicated?:     YES    [ by BAT flight software ]
     Image S/N Ratio:    8.94
     Image Trigger?:     NO
     Rate S/N Ratio:     17.2916164657906  [ if not an image trigger ]
     Image S/N Ratio:    8.94

  Analysis Position:   [ source = BAT ]
    RA: 56.8281970680934   Dec: -44.1639820922363  [deg; J2000]

  Refined Position:   [ source = BAT pre-slew burst ]
    RA: 56.8516471009226   Dec: -44.1536861209672  [deg; J2000]
        { 03h 47m 24.4s , -44d 09' 13.3" }
         +/- 0.999134631850309 [arcmin] (estimated 90% radius based on SNR)
         +/- 0.349740434319886 [arcmin] (formal 1-sigma fit error)
    SNR: 30.4547826750648

  Angular difference between the analysis and refined position is 1.183432 arcmin

  Partial Coding Fraction: 0.8046875    [ including projection effects ]

  Duration
     T90: 76.0439999103546 +/- 12.7537051608974
        Measured from: -2.18799996376038
                   to: 73.8559999465942     [s; relative to TRIGTIME]
     T50: 26.8639999628067 +/- 3.24638933026796
        Measured from: 3.00400000810623
                   to: 29.8679999709129     [s; relative to TRIGTIME]


  Fluence
     Peak Flux  (peak 1 second)
        Measured from: 0.516000032424927
                   to: 1.51600003242493     [s; relative to TRIGTIME]
     Total Fluence
        Measured from: -5.61599999666214
                   to: 91.3479999899864     [s; relative to TRIGTIME]

             Band 1     Band 2     Band 3     Band 4
              15-25      25-50     50-100    100-350     keV
 Total     0.961588   1.347187   0.748019   0.118211
           0.053035   0.054689   0.046396   0.039027 [error]
 Peak      0.015529   0.056766   0.046267   0.016360
           0.005897   0.006387   0.005843   0.004443 [error]

     [ fluence units of on-axis counts / fully illuminated detector ]

======================================================================


====== Table of the duration information =============================

        Value   tstart    tstop
T100   96.964   -5.616   91.348
T90    76.044   -2.188   73.856
T50    26.864    3.004   29.868
Peak    1.000    0.516    1.516


====== Spectral Analysis Summary =====================================

Model      : spectral model: simple power-law (PL) and cutoff power-law (CPL)
Ph_index   : photon index: E^{Ph_index}
Ph_90err   : 90% error of the photon index
Epeak      : Epeak in keV
Epeak_90err: 90% error of Epeak
Norm       : normalization at 50 keV in both the PL model and CPL model
Nomr_90err : 90% error of the normalization
chi2       : Chi-Squared
dof        : degree of freedo

=== Time-averaged spectral analysis ===
(Best model with acceptable fit: N/A)

Model Ph_index Ph_90err_low Ph_90err_hi  Epeak  Epeak_90err_low  Epeak_90err_hi  Norm       Nomr_90err_low    Norm_90err_hi    chi2    dof
PL      N/A        N/A       N/A          -           -               -           N/A           N/A               N/A         N/A        N/A
CPL     N/A        N/A        N/A          N/A         N/A           N/A           N/A           N/A               N/A         N/A        N/A


=== 1-s peak spectral analysis ===
(Best model with acceptable fit: N/A)

Model Ph_index Ph_90err_low Ph_90err_hi  Epeak  Epeak_90err_low  Epeak_90err_hi  Norm       Nomr_90err_low    Norm_90err_hi    chi2    dof
PL      N/A         N/A       N/A          -           -               -           N/A           N/A               N/A         N/A        N/A
CPL     N/A         N/A       N/A          N/A         N/A           N/A           N/A           N/A               N/A         N/A        N/A


=== Fluence/Peak Flux Summary ===

              Model    Band1     Band2     Band3     Band4     Band5     Total
                       15-25     25-50    50-100    100-350    15-150    15-350    keV
Fluence         PL    N/A      N/A      N/A      N/A      N/A      N/A      erg/cm2
Image
Pre-slew 15.0-350.0 keV image (Event data)
#   RAcent    DECcent   POSerr    Theta     Phi              Peak Cts       SNR   Name
   56.8516   -44.1537   0.0063    27.5265   170.2953         1.6082352     30.455 TRIG_00663074

Foreground time interval of the image:
 -5.616  13.285 (delta_t =  18.901 [sec])
Background time interval of the image:
-239.816  -5.616 (delta_t = 234.200 [sec])
Light Curves
Note: The mask-weighted lightcurves have units of either count/det or counts/sec/det, where a det is 0.4 x 0.4 = 0.16 sq cm.
Full-time range; 1 s binning
Other quick-look light curves:
- 64 ms binning (zoomed)
- 16 ms binning (zoomed)
- 8 ms binning (zoomed)
- 2 ms binning (zoomed)
- SN=5 or 10 s binning (full-time range)
- Raw light curve
Spectra
- 64 ms binning (zoomed)
- 16 ms binning (zoomed)
- 8 ms binning (zoomed)
- 2 ms binning (zoomed)
- SN=5 or 10 s binning (full-time range)
- Raw light curve
Spectra
Notes:
- 1) The fitting includes the systematic errors.
- 2) When the burst includes telescope slew time periods, the fitting uses an average response file made from multiple 5-s response files through out the slew time plus single time preiod for the non-slew times, and weighted by the total counts in the corresponding time period using addrmf. An average response file is needed becuase a spectral fit using the pre-slew DRM will introduce some errors in both a spectral shape and a normalization if the PHA file contains a lot of the slew/post-slew time interval.
- 3) For fits to more complicated models (e.g. a power-law over a cutoff power-law), the BAT team has decided to require a chi-square improvement of more than 6 for each extra dof.
Time averaged spectrum fit using the average DRM
Power-law model

Multiple GTIs in the spectrum
tstart tstop
Photon index:       (       )
Cutoff power-law model

Multiple GTIs in the spectrum
tstart tstop
Photon index:       (       )
1-s peak spectrum fit
Power-law model

Time interval is from    0.516 sec. to    1.516 sec.
Photon index:       (       )
Cutoff power-law model

Time interval is from    0.516 sec. to    1.516 sec.
Photon index:       (       )
Time-resolved spectra

Distribution
T90 vs. Hardness ratio plot

T90                                   = N/A sec.
Hardness ratio (energy fluence ratio) = N/A
S(15-50 keV) vs. S(50-150 keV) plot
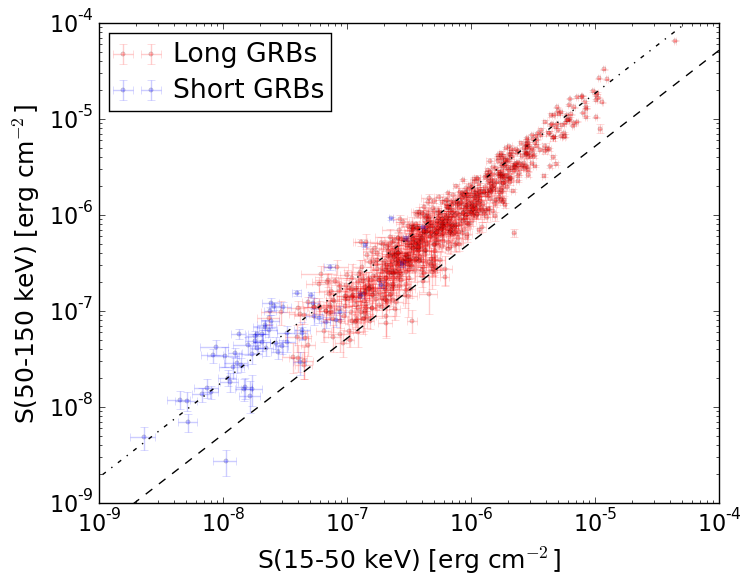
S(15-50 keV)  = N/A
S(50-150 keV) = N/A
The dash-dotted line and the dashed line traces the fluences calculated from the Band function with Epeak = 15 and 150 keV, respectively. Both lines assume a canonical values of alpha = -1 and beta = -2.5.
Mask shadow pattern
IMX = -5.136973580862169E-01, IMY = -8.785136123531888E-02
Spacecraft aspect plot
Bright source in the pre-burst/pre-slew/post-slew images
Pre-burst image of 15-350 keV band
Time interval of the image:
-239.816000 -5.616000

# RAcent  DECcent POSerr Theta    Phi  PeakCts   SNR AngSep     Name
#  [deg]    [deg]    ['] [deg]  [deg]                   [']
 30.7592 -31.6759    2.9  17.6  109.8   0.7322   4.0 ------	UNKNOWN
106.3034 -85.5078    2.8  44.0 -116.6   3.0941   4.1 ------	UNKNOWN
Pre-slew background subtracted image of 15-350 keV band
Time interval of the image:
-5.616000 13.284600

# RAcent  DECcent POSerr Theta    Phi  PeakCts   SNR AngSep     Name
#  [deg]    [deg]    ['] [deg]  [deg]                   [']
 56.8517 -44.1537    0.4  27.5  170.3   1.6084  30.5 ------	UNKNOWN
 91.9862 -37.1389    2.6  54.3  178.9   0.7881   4.5 ------	UNKNOWN
  5.4470 -70.1548    2.5  24.8 -100.4   0.2618   4.6 ------	UNKNOWN
Post-slew image of 15-350 keV band
Time interval of the image:
61.684600 962.214000

# RAcent  DECcent POSerr Theta    Phi  PeakCts   SNR AngSep     Name
#  [deg]    [deg]    ['] [deg]  [deg]                   [']
 92.1933  -6.1458    2.3  49.0  151.4  10.1927   5.0 ------	UNKNOWN
353.6210 -22.2527    3.2  55.7   13.0  10.1550   3.6 ------	UNKNOWN
102.3802 -37.6938    2.5  34.6 -163.0   2.4961   4.7 ------	UNKNOWN
 11.0013 -64.8241    3.7  32.5  -43.7   1.9277   3.2 ------	UNKNOWN
 99.7979 -59.5076    2.6  29.9 -122.2   3.1420   4.5 ------	UNKNOWN
128.5358 -27.2997    5.4  58.7 -159.2   9.7624   2.1 ------	UNKNOWN
131.9043 -53.4216    2.5  48.0 -129.2  11.0298   4.7 ------	UNKNOWN