Analysis Summary
Notes:
- 1) No attempt has been made to eliminate the non-significant decimal places.
- 2) This batgrbproduct analysis is done using the HEASARC data.
- 3) This batgrbproduct analysis is using the flight position for the mask-weighting calculation.
==========================================================================
BAT GROUND-DETECTED GRB DATA PROCESSING REPORT
Process Script Ver: batgrbproduct v2.46
Process Start Time: Tue Dec 15 16:58:07 EST 2015
Host Name: bat1
Current Working Dir: /local/data/bat1/alien/Swift_3rdBATcatalog/event/ground_detect_bursts/scripts
======================================================================
Trigger: 00664653 Segment: 000
BAT Trigger Time: 469904452.8
UTC: 2015-11-22T17:00:52.800 [includes UTCF correction]
Where From?: Ground analysis (best_duration.txt)
NOTE: BAT trigger time for ground-detected burst is the T100 start time.
Analysis Position: [ source = GCN ]
RA: not Dec: available) [deg; J2000]
Refined Position: [ source = BAT pre-slew image ]
RA: 299.695725534 Dec: -19.8612331446 [deg; J2000]
{ 19h 58m 47.0s , -19d -51' -40.4" }
+/- 1.51584677277 [arcmin] (estimated 90% radius based on SNR)
SNR: 16.791759008
Angular difference between the analysis and refined position is 3733.786238 arcmin
Partial Coding Fraction: 0.859375 [ including projection effects ]
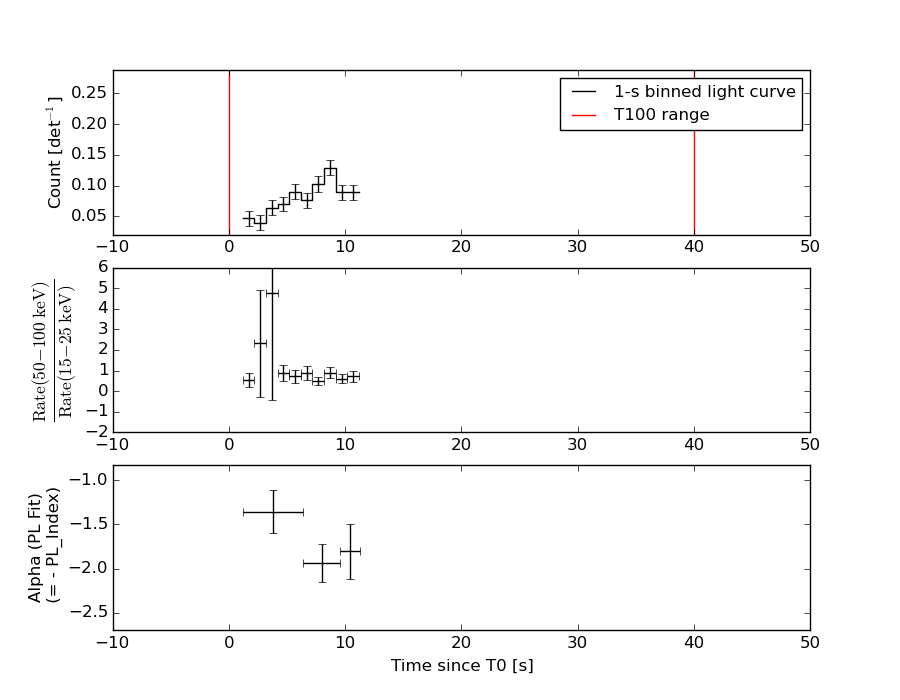
Duration
T90: 36.8000000715256 +/- 1.6
Measured from: 1.6
to: 38.4 [s; relative to TRIGTIME]
T50: 20.8000000715256 +/- 1.6
Measured from: 9.6
to: 30.4 [s; relative to TRIGTIME]
====== Table of the duration information =============================
Value tstart tstop
T100 40.000 0.000 40.000
T90 36.800 1.600 38.400
T50 20.800 9.600 30.400
Peak 1.000 8.300 9.300
====== Spectral Analysis Summary =====================================
Model : spectral model: simple power-law (PL) and cutoff power-law (CPL)
Ph_index : photon index: E^{Ph_index}
Ph_90err : 90% error of the photon index
Epeak : Epeak in keV
Epeak_90err: 90% error of Epeak
Norm : normalization at 50 keV in both the PL model and CPL model
Nomr_90err : 90% error of the normalization
chi2 : Chi-Squared
dof : degree of freedo
=== Time-averaged spectral analysis ===
(Best model with acceptable fit: PL)
Model Ph_index Ph_90err_low Ph_90err_hi Epeak Epeak_90err_low Epeak_90err_hi Norm Nomr_90err_low Norm_90err_hi chi2 dof
PL -1.664 -0.151 0.149 - - - 4.88e-03 -4.24e-04 4.20e-04 52.550 57
CPL -1.605 -0.692 0.591 288.198 -270.957 -288.198 5.24e-03 -1.76e-03 5.18e-03 52.540 56
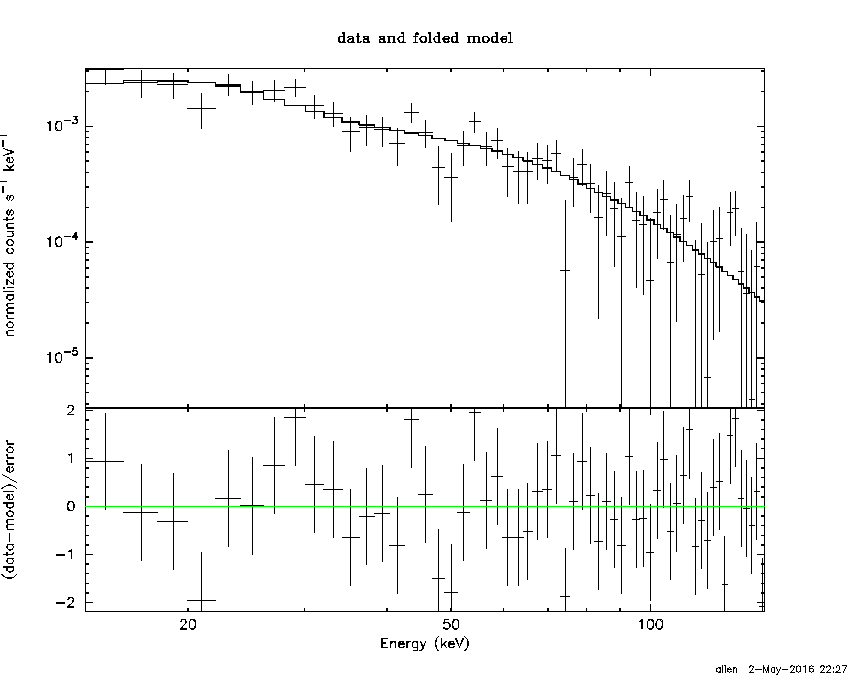
=== 1-s peak spectral analysis ===
(Best model with acceptable fit: PL)
Model Ph_index Ph_90err_low Ph_90err_hi Epeak Epeak_90err_low Epeak_90err_hi Norm Nomr_90err_low Norm_90err_hi chi2 dof
PL -1.948 -0.318 0.297 - - - 7.06e-03 -1.45e-03 1.40e-03 70.380 57
CPL -1.549 -0.855 2.136 46.310 N/A N/A 1.21e-02 N/A N/A 70.140 56
=== Fluence/Peak Flux Summary ===
Model Band1 Band2 Band3 Band4 Band5 Total
15-25 25-50 50-100 100-350 15-150 15-350 keV
Fluence PL 7.30e-08 1.21e-07 1.53e-07 3.86e-07 4.55e-07 7.34e-07 erg/cm2
90%_error_low -9.89e-09 -1.02e-08 -1.78e-08 -8.76e-08 -4.17e-08 -1.04e-07 erg/cm2
90%_error_hi 1.02e-08 1.02e-08 1.78e-08 1.04e-07 4.21e-08 1.16e-07 erg/cm2
Peak flux PL 4.48e-01 3.46e-01 1.79e-01 1.34e-01 1.04e+00 1.11e+00 ph/cm2/s
90%_error_low -1.06e-01 -5.70e-02 -4.72e-02 -5.77e-02 -1.71e-01 -1.83e-01 ph/cm2/s
90%_error_hi 1.11e-01 5.70e-02 4.80e-02 7.96e-02 1.71e-01 1.84e-01 ph/cm2/s
Fluence CPL 7.24e-08 1.22e-07 1.54e-07 3.51e-07 4.53e-07 6.99e-07 erg/cm2
90%_error_low -1.15e-08 -1.07e-08 -1.81e-08 -2.05e-07 -4.70e-08 -2.11e-07 erg/cm2
90%_error_hi 9.44e-09 1.26e-08 1.85e-08 5.33e-08 4.38e-08 1.45e-07 erg/cm2
Peak flux CPL 4.33e-01 3.64e-01 1.77e-01 7.37e-02 1.02e+00 1.05e+00 ph/cm2/s
90%_error_low -1.21e-01 N/A -6.44e-02 -7.37e-02 -1.81e-01 -2.05e-01 ph/cm2/s
90%_error_hi 1.17e-01 N/A 5.12e-02 7.70e-02 1.78e-01 2.45e-01 ph/cm2/s
======================================================================
Image
15.0-350.0 keV image (Event data)
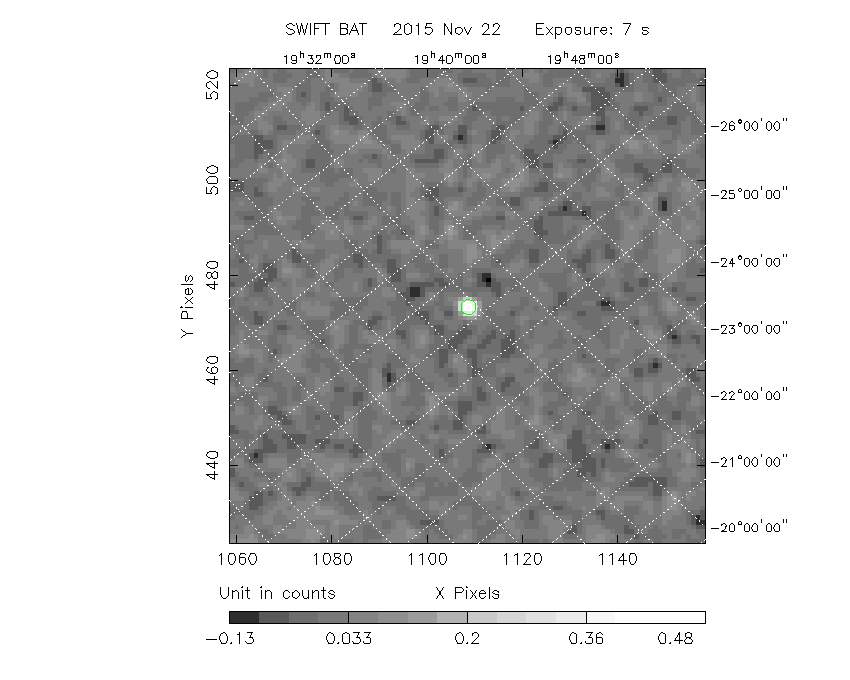
#RAcent DECcent POSerr Theta  Phi  Peak_Cts  SNR Name
299.696 -19.861 0.011 25.704 179.157 0.594 16.792 TRIG_00664653

Image time interval: 1.200 to 8.501 [sec]
Light Curves
Note: The mask-weighted lightcurves have units of either count/det or counts/sec/det, where a det is 0.4 x 0.4 = 0.16 sq cm.
Best duration plot
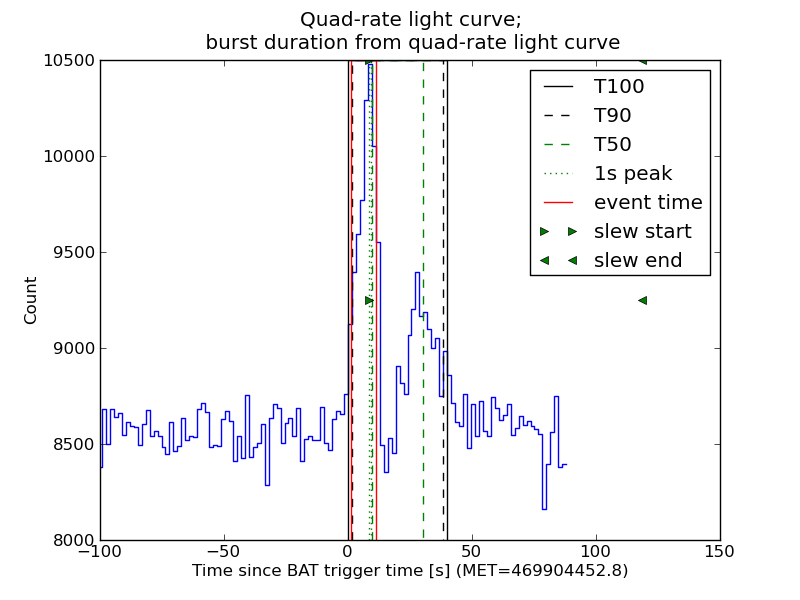
Full-time range; 1 s binning
Other quick-look light curves:
- 64 ms binning (zoomed)
- 16 ms binning (zoomed)
- 8 ms binning (zoomed)
- 2 ms binning (zoomed)
- SN=5 or 10 s binning (full-time range)
- Raw light curve
Spectra
- 64 ms binning (zoomed)
- 16 ms binning (zoomed)
- 8 ms binning (zoomed)
- 2 ms binning (zoomed)
- SN=5 or 10 s binning (full-time range)
- Raw light curve
Spectra
Notes:
- 1) The fitting includes the systematic errors.
- 2) When the burst includes telescope slew time periods, the fitting uses an average response file made from multiple 5-s response files through out the slew time plus single time preiod for the non-slew times, and weighted by the total counts in the corresponding time period using addrmf. An average response file is needed becuase a spectral fit using the pre-slew DRM will introduce some errors in both a spectral shape and a normalization if the PHA file contains a lot of the slew/post-slew time interval.
- 3) For fits to more complicated models (e.g. a power-law over a cutoff power-law), the BAT team has decided to require a chi-square improvement of more than 6 for each extra dof.
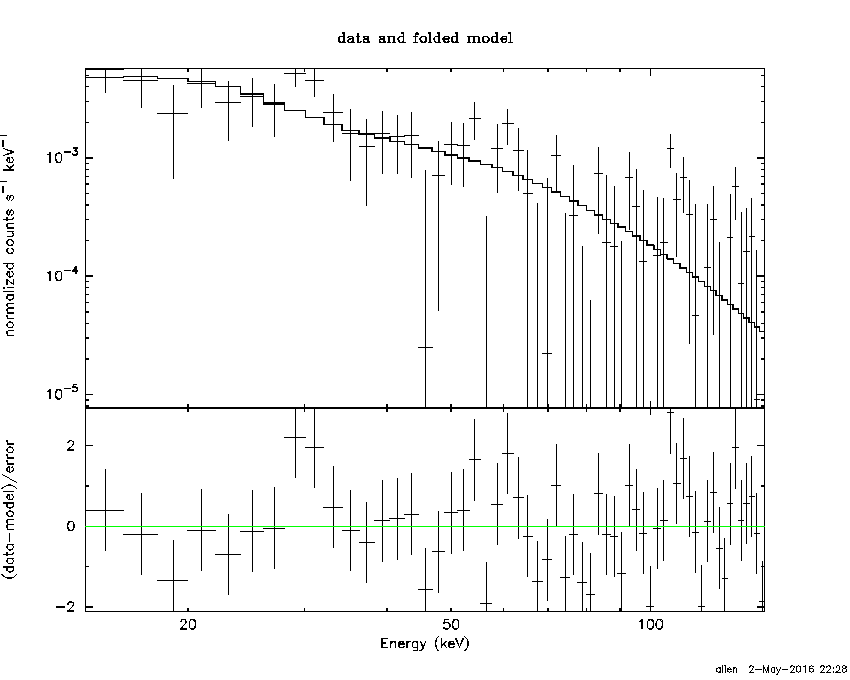
Time averaged spectrum fit using the average DRM
Power-law model
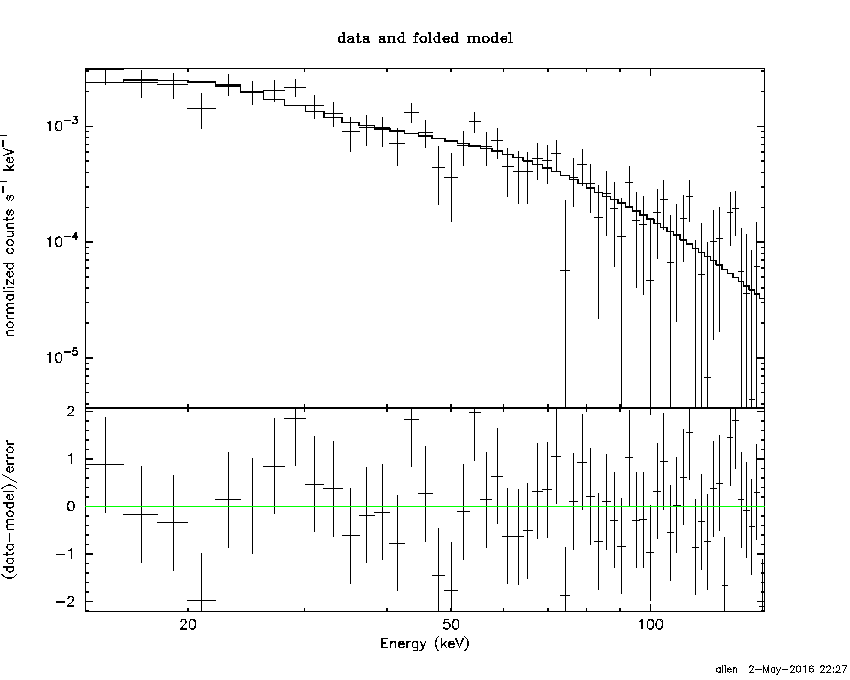
Time interval is from    1.200 sec. to   11.255 sec.

Spectral model in power-law:
------------------------------------------------------------
Parameters  : value       lower 90%   higher 90%
Photon index: -1.66413     ( -0.151263   0.148934 )
Norm@50keV  : 4.87865E-03    ( -0.000423527   0.000419673 )
------------------------------------------------------------
#Fit statistic : Chi-Squared =          52.55 using 59 PHA bins.
# Reduced chi-squared =         0.9218 for     57 degrees of freedom
# Null hypothesis probability =   6.427192e-01

Photon flux (15-150 keV)    in 10.05 sec: 0.640057 ( -0.053628  0.053765 ) ph/cm2/s
Energy fluence (15-150 keV)             : 4.55445e-07 ( -4.17063e-08  4.21158e-08 ) ergs/cm2
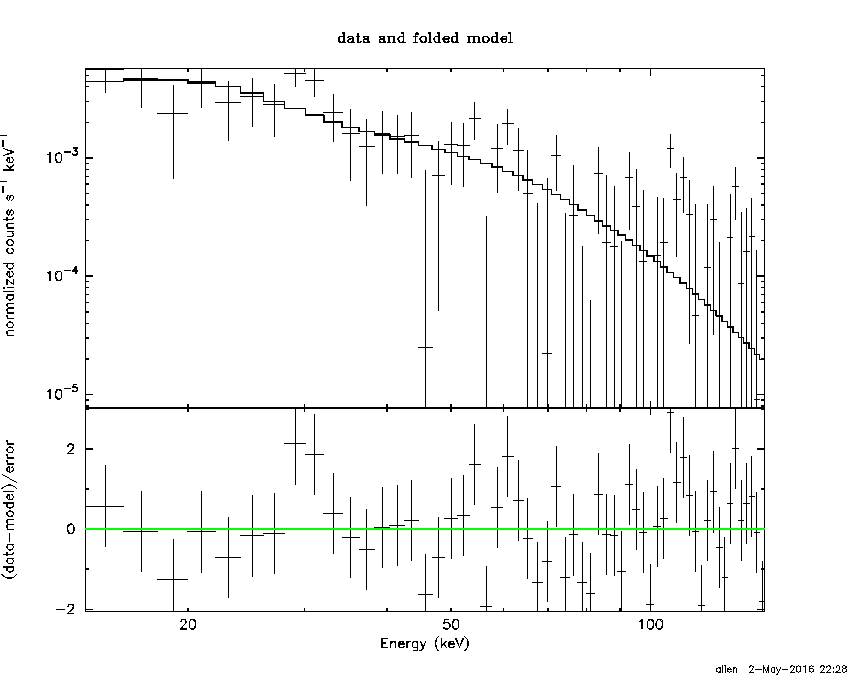
Cutoff power-law model
Time interval is from    1.200 sec. to   11.255 sec.
Spectral model in the cutoff power-law:
------------------------------------------------------------
Parameters  : value       lower 90%   higher 90%
Photon index: -1.60478     ( -0.68993   0.593501 )
Epeak [keV] : 288.198      ( -320.856 -338.096 )
Norm@50keV  : 5.23581E-03    ( -0.00174296   0.00519559 )
------------------------------------------------------------
#Fit statistic : Chi-Squared =          52.54 using 59 PHA bins.
# Reduced chi-squared =         0.9383 for     56 degrees of freedom
# Null hypothesis probability =   6.064731e-01

Photon flux (15-150 keV)    in 10.05 sec: 0.638263 ( -0.056322  0.054971 ) ph/cm2/s
Energy fluence (15-150 keV)             : 4.53259e-07 ( -4.69878e-08  4.37521e-08 ) ergs/cm2
1-s peak spectrum fit
Power-law model
Time interval is from    8.300 sec. to    9.300 sec.

Spectral model in power-law:
------------------------------------------------------------
Parameters  : value       lower 90%   higher 90%
Photon index: -1.94844     ( -0.318126   0.296698 )
Norm@50keV  : 7.06194E-03    ( -0.00144904   0.00140051 )
------------------------------------------------------------
#Fit statistic : Chi-Squared =          70.38 using 59 PHA bins.
# Reduced chi-squared =          1.235 for     57 degrees of freedom
# Null hypothesis probability =   1.096476e-01

Photon flux (15-150 keV)    in 1 sec: 1.03502 ( -0.171276  0.17137 ) ph/cm2/s
Energy fluence (15-150 keV)             : 6.4998e-08 ( -1.25632e-08  1.29042e-08 ) ergs/cm2
Cutoff power-law model
Time interval is from    8.300 sec. to    9.300 sec.
Spectral model in the cutoff power-law:
------------------------------------------------------------
Parameters  : value       lower 90%   higher 90%
Photon index: -1.5486     ( -0.857413   2.13419 )
Epeak [keV] : 46.3103      (   )
Norm@50keV  : 1.21297E-02    (     )
------------------------------------------------------------
#Fit statistic : Chi-Squared =          70.14 using 59 PHA bins.
# Reduced chi-squared =          1.253 for     56 degrees of freedom
# Null hypothesis probability =   9.684204e-02

Photon flux (15-150 keV)    in 1 sec: 1.02022 ( -0.181298  0.17842 ) ph/cm2/s
Energy fluence (15-150 keV)             : 0 ( 0  0 ) ergs/cm2
Time-resolved spectra
Distribution
T90 vs. Hardness ratio plot
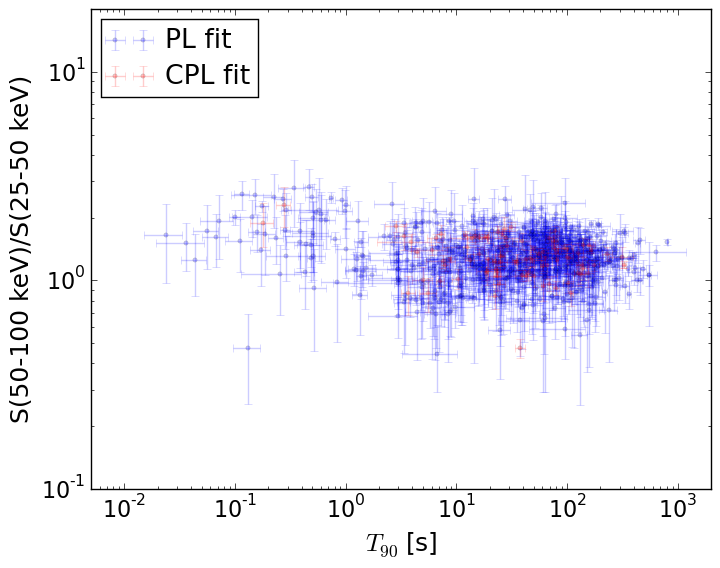
T90                                   = N/A sec.
Hardness ratio (energy fluence ratio) = N/A
S(15-50 keV) vs. S(50-150 keV) plot
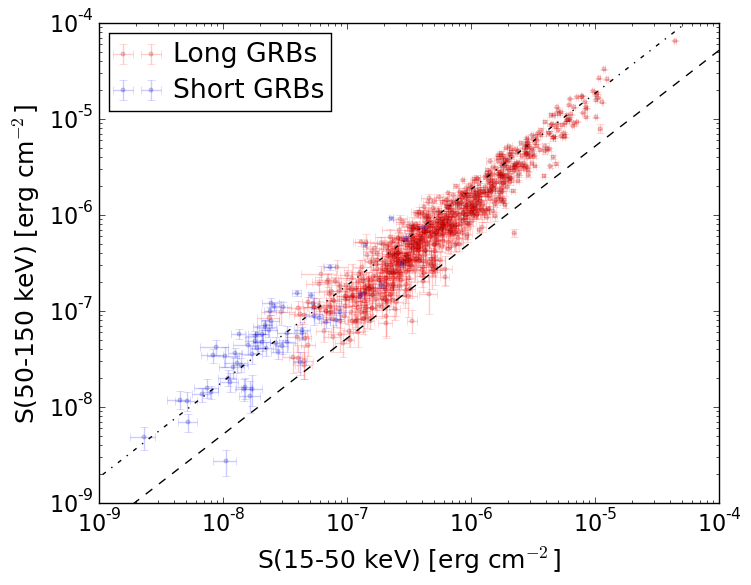
S(15-50 keV)  = N/A
S(50-150 keV) = N/A
The dash-dotted line and the dashed line traces the fluences calculated from the Band function with Epeak = 15 and 150 keV, respectively. Both lines assume a canonical values of alpha = -1 and beta = -2.5.
Mask shadow pattern
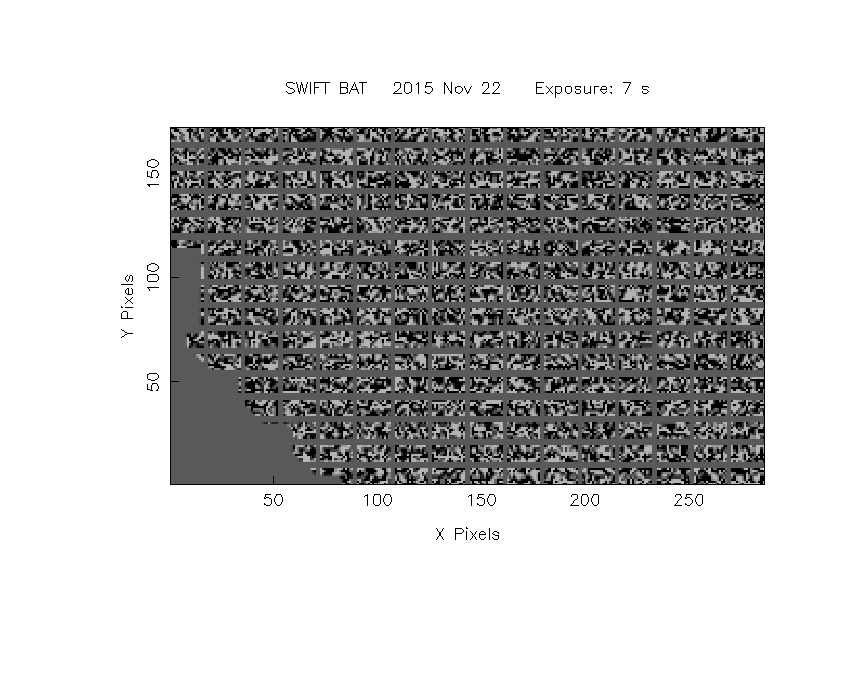
IMX = -0.481296325455, IMY = -0.00708599426475
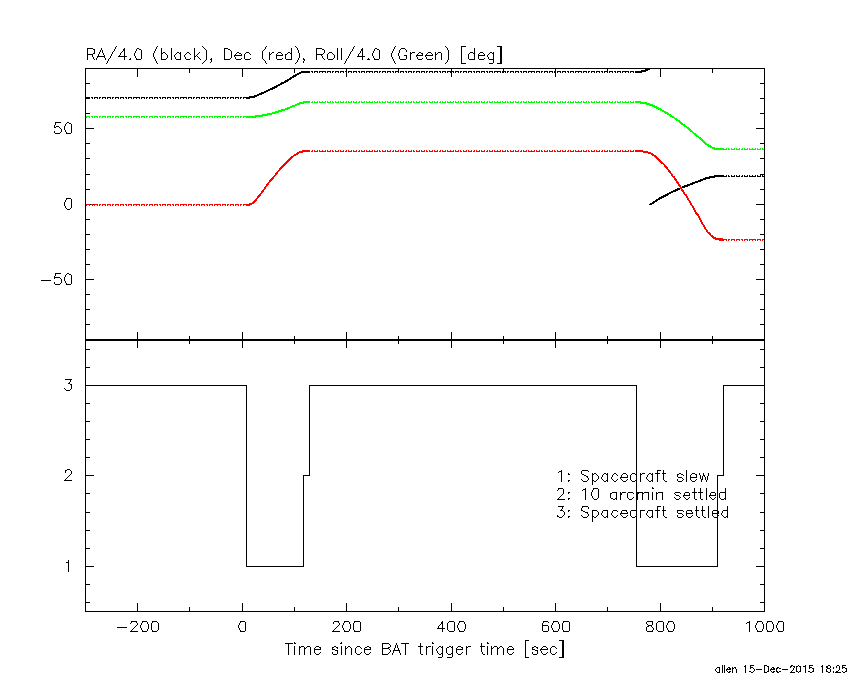
Spacecraft aspect plot
Bright source in the event data image
Event data image of 15-350 keV band
Time interval of the image:
1.200000 8.500600

# RAcent  DECcent POSerr Theta    Phi  PeakCts   SNR AngSep     Name
#  [deg]    [deg]    ['] [deg]  [deg]                   [']
244.9775 -15.6024    2.1  40.2  -75.5   0.6505   5.6    2.3	Sco X-1
254.3766  35.3019    2.8  44.3    5.2  -0.2231  -4.1    4.7	Her X-1
263.2337 -24.7718    0.0  30.8 -105.2  -0.0625  -1.3   12.3	GX 1+4
268.4827  -1.5485   86.9  14.2  -56.2   0.0041   0.1    9.0	SW J1753.5-0127
270.2417 -24.9666    9.3  27.4 -116.3   0.0493   1.2    7.1	GX 5-1
270.2989 -25.6915   17.6  28.0 -117.1   0.0264   0.7    3.1	GRS 1758-258
273.8410 -13.9754    6.6  16.2 -109.2   0.0557   1.8   10.3	GX 17+2
275.6788 -30.3389    0.0  30.7 -129.5   0.0299   0.8   12.9	H1820-303
285.2670 -24.9461    6.5  24.7 -147.0  -0.0593  -1.8   12.7	HT1900.1-2455
288.6806  10.8509    7.1  12.7   66.9   0.0530   1.6    9.0	GRS 1915+105
299.6398  35.2456    3.7  39.0   61.1   0.2894   3.1    3.6	Cyg X-1
262.9470 -33.9584    3.5  38.3 -114.5  -0.2344  -3.3    7.7	GX 354-0
318.5137  -5.8002    2.3  36.2  138.1   0.2974   5.0 ------	UNKNOWN
299.6957 -19.8612    0.7  25.7  179.2   0.5937  16.8 ------	UNKNOWN
235.9168  34.4634    2.0  55.8   -7.8   0.6083   5.8 ------	UNKNOWN
234.9716  -0.6600    2.5  47.6  -51.9   0.6279   4.5 ------	UNKNOWN
Webpage updated on:
Tue Dec 15 18:25:31 EST 2015