Analysis Summary
Notes:
- 1) No attempt has been made to eliminate the non-significant decimal places.
- 2) This batgrbproduct analysis is done using the HEASARC data.
- 3) This batgrbproduct analysis is using the flight position for the mask-weighting calculation.
======================================================================
                  BAT GRB EVENT DATA PROCESSING REPORT
    Process Script Ver: batgrbproduct v2.46
    Process Start Time: Sun Mar 13 22:07:59 EDT 2016
             Host Name: bat1
   Current Working Dir: /local/data/bat1/alien/Swift_3rdBATcatalog/event/batevent_reproc/trigger666931
======================================================================

  Trigger: 00666931      Segment: 000

  BAT Trigger Time: 471409992   [s; MET]
      Trigger Stop: 471410072   [s; MET]
               UTC: 2015-12-10T03:12:56.468160    [includes UTCF correction]
       Where From?: TDRSS position message

  BAT
    RA: 65.1823076169024   Dec: -71.2304208518608  [deg; J2000]

     Catalogged Source?: NO
     Point Source?:      YES
     GRB Indicated?:     YES    [ by BAT flight software ]
     Image S/N Ratio:    10.24
     Image Trigger?:     YES
     Rate S/N Ratio:     0  [ if not an image trigger ]
     Image S/N Ratio:    10.24

  Analysis Position:   [ source = BAT ]
    RA: 65.1823076169024   Dec: -71.2304208518608  [deg; J2000]

  Refined Position:   [ source = BAT pre-slew burst ]
    RA: 65.0855808894804   Dec: -71.2265738004778  [deg; J2000]
        { 04h 20m 20.5s , -71d 13' 35.7" }
         +/- 1.72137678433548 [arcmin] (estimated 90% radius based on SNR)
         +/- 0.710358999811928 [arcmin] (formal 1-sigma fit error)
    SNR: 14.0007966958866

  Angular difference between the analysis and refined position is 1.881780 arcmin

  Partial Coding Fraction: 0.609375    [ including projection effects ]

  Duration
     T90: 86.9599999785423 +/- 10.6712423189293
        Measured from: -38.7200000286102
                   to: 48.2399999499321     [s; relative to TRIGTIME]
     T50: 60.539999961853 +/- 4.92299257607087
        Measured from: -21.2960000038147
                   to: 39.2439999580383     [s; relative to TRIGTIME]


  Fluence
     Peak Flux  (peak 1 second)
        Measured from: 38.8199999928474
                   to: 39.8199999928474     [s; relative to TRIGTIME]
     Total Fluence
        Measured from: -57.1959999799728
                   to: 52.8000000119209     [s; relative to TRIGTIME]

             Band 1     Band 2     Band 3     Band 4
              15-25      25-50     50-100    100-350     keV
 Total     0.907443   1.084534   0.555872   0.165159
           0.072375   0.075570   0.065892   0.058099 [error]
 Peak      0.023274   0.035441   0.035147   0.016641
           0.007689   0.008245   0.007455   0.006179 [error]

     [ fluence units of on-axis counts / fully illuminated detector ]

======================================================================


====== Table of the duration information =============================

        Value   tstart    tstop
T100  109.996  -57.196   52.800
T90    86.960  -38.720   48.240
T50    60.540  -21.296   39.244
Peak    1.000   38.820   39.820


====== Spectral Analysis Summary =====================================

Model      : spectral model: simple power-law (PL) and cutoff power-law (CPL)
Ph_index   : photon index: E^{Ph_index}
Ph_90err   : 90% error of the photon index
Epeak      : Epeak in keV
Epeak_90err: 90% error of Epeak
Norm       : normalization at 50 keV in both the PL model and CPL model
Nomr_90err : 90% error of the normalization
chi2       : Chi-Squared
dof        : degree of freedo

=== Time-averaged spectral analysis ===
(Best model with acceptable fit: PL)

Model Ph_index Ph_90err_low Ph_90err_hi  Epeak  Epeak_90err_low  Epeak_90err_hi  Norm       Nomr_90err_low    Norm_90err_hi    chi2    dof
PL      -1.839    -0.151      0.146       -           -               -         1.46e-03     -1.43e-04          1.41e-04      58.210   57
CPL     -1.052    -0.661      0.799       50.834     -10.019        46.669      4.13e-03     -2.37e-03          7.77e-03      53.970   56


=== 1-s peak spectral analysis ===
(Best model with acceptable fit: PL)

Model Ph_index Ph_90err_low Ph_90err_hi  Epeak  Epeak_90err_low  Epeak_90err_hi  Norm       Nomr_90err_low    Norm_90err_hi    chi2    dof
PL      -1.166     -0.375     0.398       -           -               -         6.90e-03     -1.54e-03          1.54e-03      39.240   57
CPL     -0.919     -2.016     1.724      234.083    -234.083      -234.083      9.09e-03     -3.63e-03          4.90e-02      39.140   56


=== Fluence/Peak Flux Summary ===

              Model    Band1     Band2     Band3     Band4     Band5     Total
                       15-25     25-50    50-100    100-350    15-150    15-350    keV
Fluence         PL   2.83e-07  4.23e-07  4.73e-07  1.00e-06  1.48e-06  2.18e-06   erg/cm2
      90%_error_low -3.37e-08 -3.46e-08 -6.22e-08 -2.41e-07 -1.44e-07 -3.10e-07   erg/cm2
      90%_error_hi   3.44e-08  3.46e-08  6.29e-08  2.88e-07  1.47e-07  3.47e-07   erg/cm2
Peak flux       PL   2.06e-01  2.53e-01  2.26e-01  3.48e-01  8.06e-01  1.03e+00   ph/cm2/s
      90%_error_low -8.35e-02 -6.92e-02 -5.71e-02 -1.54e-01 -1.86e-01 -2.39e-01   ph/cm2/s
      90%_error_hi   9.46e-02  6.69e-02  5.60e-02  2.18e-01  1.87e-01  2.47e-01   ph/cm2/s

Fluence        CPL   2.63e-07  4.64e-07  4.58e-07  2.83e-07  1.36e-06  1.47e-06   erg/cm2
      90%_error_low -3.84e-08 -4.83e-08 -7.70e-08 -1.78e-07 -1.67e-07 -2.48e-07   erg/cm2
      90%_error_hi   3.84e-08  5.02e-08  7.18e-08  5.02e-07  1.75e-07  5.22e-07   erg/cm2
Peak flux      CPL   1.96e-01  2.59e-01  2.32e-01  2.63e-01  8.00e-01  9.51e-01   ph/cm2/s
      90%_error_low -9.78e-02 -7.31e-02 -6.05e-02 -2.63e-01 -1.89e-01 -2.97e-01   ph/cm2/s
      90%_error_hi   9.60e-02  7.91e-02  6.82e-02  1.98e-01  1.90e-01  3.10e-01   ph/cm2/s

======================================================================
Image
Pre-slew 15.0-350.0 keV image (Event data)
#   RAcent    DECcent   POSerr    Theta     Phi              Peak Cts       SNR   Name
   65.0856   -71.2266   0.0137    24.1221   -87.4798         1.7895174     14.001 TRIG_00666931

Foreground time interval of the image:
-10.499  52.800 (delta_t =  63.299 [sec])
Background time interval of the image:
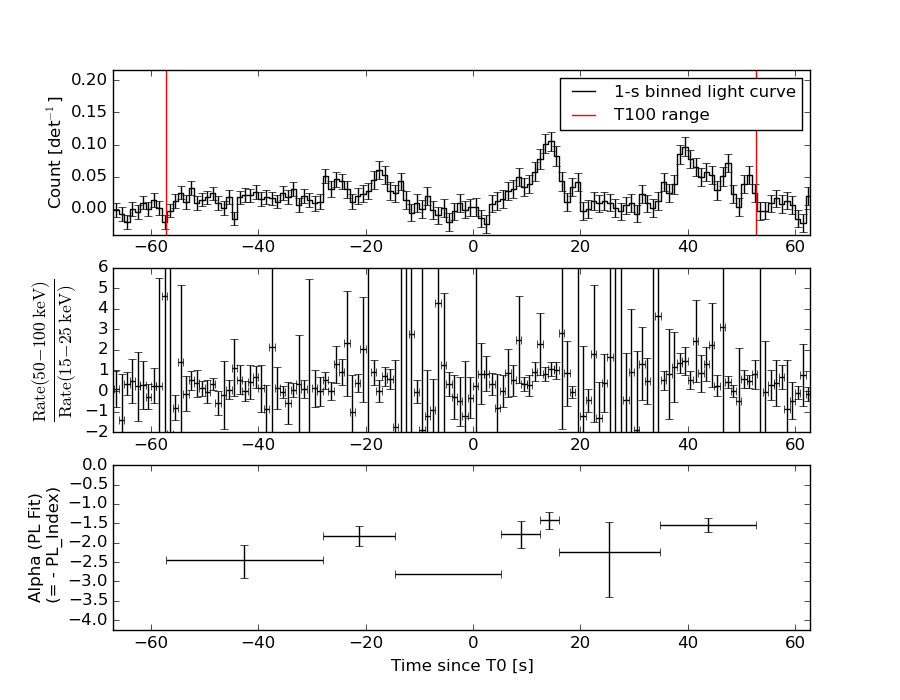
Light Curves
Note: The mask-weighted lightcurves have units of either count/det or counts/sec/det, where a det is 0.4 x 0.4 = 0.16 sq cm.
Full-time range; 1 s binning
Other quick-look light curves:
Spectra
Notes:
- 1) The fitting includes the systematic errors.
- 2) When the burst includes telescope slew time periods, the fitting uses an average response file made from multiple 5-s response files through out the slew time plus single time preiod for the non-slew times, and weighted by the total counts in the corresponding time period using addrmf. An average response file is needed becuase a spectral fit using the pre-slew DRM will introduce some errors in both a spectral shape and a normalization if the PHA file contains a lot of the slew/post-slew time interval.
- 3) For fits to more complicated models (e.g. a power-law over a cutoff power-law), the BAT team has decided to require a chi-square improvement of more than 6 for each extra dof.
Time averaged spectrum fit using the average DRM
Power-law model
Time interval is from  -57.196 sec. to   52.800 sec.

Spectral model in power-law:
------------------------------------------------------------
Parameters  : value       lower 90%   higher 90%
Photon index: -1.8391     ( -0.151105   0.146357 )
Norm@50keV  : 1.46385E-03    ( -0.000142808   0.000140708 )
------------------------------------------------------------
#Fit statistic : Chi-Squared =          58.21 using 59 PHA bins.
# Reduced chi-squared =          1.021 for     57 degrees of freedom
# Null hypothesis probability =   4.306591e-01

Photon flux (15-150 keV)    in 110 sec: 0.204866 ( -0.016841  0.016846 ) ph/cm2/s
Energy fluence (15-150 keV)             : 1.48106e-06 ( -1.4412e-07  1.46556e-07 ) ergs/cm2
Cutoff power-law model
Time interval is from  -57.196 sec. to   52.800 sec.
Spectral model in the cutoff power-law:
------------------------------------------------------------
Parameters  : value       lower 90%   higher 90%
Photon index: -1.05199     ( -0.660999   0.798868 )
Epeak [keV] : 50.8344      ( -10.0178 46.6702 )
Norm@50keV  : 4.12787E-03    ( -0.00236886   0.00776921 )
------------------------------------------------------------
#Fit statistic : Chi-Squared =          53.97 using 59 PHA bins.
# Reduced chi-squared =         0.9638 for     56 degrees of freedom
# Null hypothesis probability =   5.520648e-01

Photon flux (15-150 keV)    in 110 sec: 0.198449 ( -0.01765  0.017649 ) ph/cm2/s
Energy fluence (15-150 keV)             : 1.35989e-06 ( -1.66797e-07  1.75094e-07 ) ergs/cm2
1-s peak spectrum fit
Power-law model
Time interval is from   38.820 sec. to   39.820 sec.

Spectral model in power-law:
------------------------------------------------------------
Parameters  : value       lower 90%   higher 90%
Photon index: -1.16568     ( -0.374986   0.397692 )
Norm@50keV  : 6.90131E-03    ( -0.0015438   0.00154176 )
------------------------------------------------------------
#Fit statistic : Chi-Squared =          39.24 using 59 PHA bins.
# Reduced chi-squared =         0.6885 for     57 degrees of freedom
# Null hypothesis probability =   9.650001e-01

Photon flux (15-150 keV)    in 1 sec: 0.806380 ( -0.186257  0.18707 ) ph/cm2/s
Energy fluence (15-150 keV)             : 7.07213e-08 ( -1.70478e-08  1.72255e-08 ) ergs/cm2
Cutoff power-law model

Time interval is from   38.820 sec. to   39.820 sec.
Spectral model in the cutoff power-law:
------------------------------------------------------------
Parameters  : value       lower 90%   higher 90%
Photon index: -0.919487     ( -2.01579   1.72428 )
Epeak [keV] : 234.083      ( -234.11 -234.11 )
Norm@50keV  : 9.08545E-03    ( -0.00363005   0.0489876 )
------------------------------------------------------------
#Fit statistic : Chi-Squared =          39.14 using 59 PHA bins.
# Reduced chi-squared =         0.6990 for     56 degrees of freedom
# Null hypothesis probability =   9.576153e-01

Photon flux (15-150 keV)    in 1 sec: 0.800281 ( -0.189388  0.189632 ) ph/cm2/s
Energy fluence (15-150 keV)             : 6.97028e-08 ( -1.84686e-08  1.76305e-08 ) ergs/cm2
Time-resolved spectra
Distribution
T90 vs. Hardness ratio plot
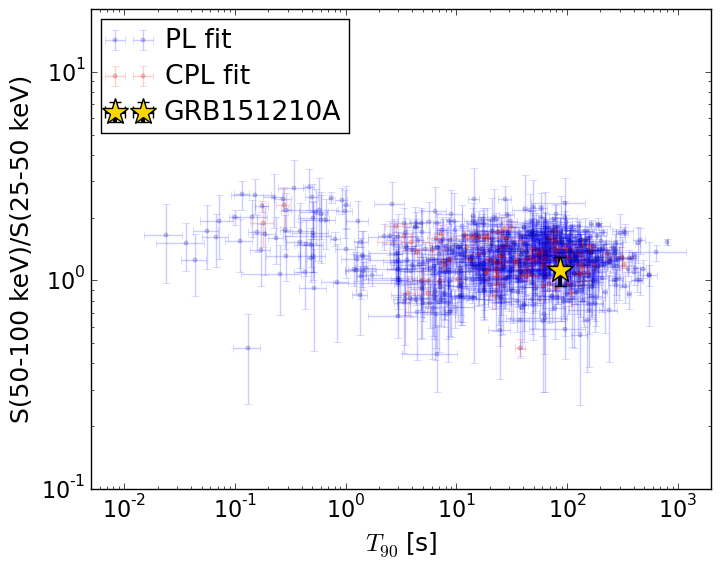
T90                                   = 86.96 sec.
Hardness ratio (energy fluence ratio) = 1.11802112891
S(15-50 keV) vs. S(50-150 keV) plot
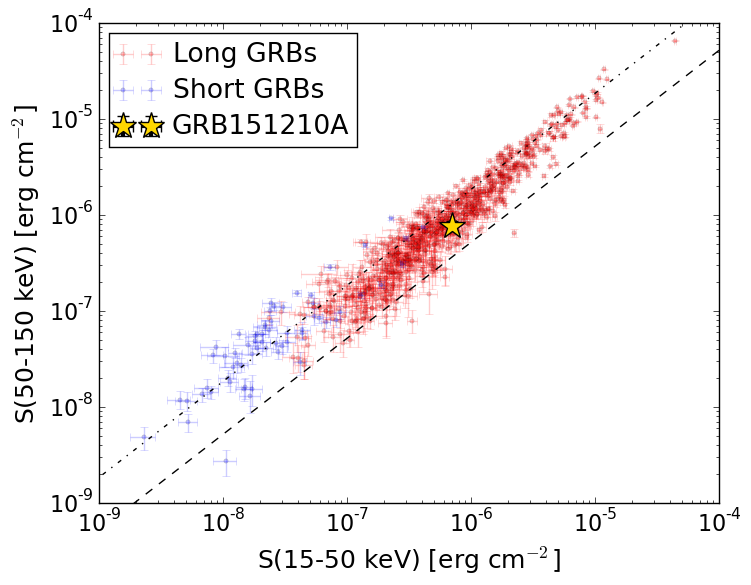
S(15-50 keV)  = 7.059866e-07
S(50-150 keV) = 7.750982e-07
The dash-dotted line and the dashed line traces the fluences calculated from the Band function with Epeak = 15 and 150 keV, respectively. Both lines assume a canonical values of alpha = -1 and beta = -2.5.
Mask shadow pattern
IMX = 1.969010630520137E-02, IMY = 4.473512407426649E-01
Spacecraft aspect plot
Bright source in the pre-burst/pre-slew/post-slew images
Pre-burst image of 15-350 keV band
Time interval of the image:
Pre-slew background subtracted image of 15-350 keV band
Time interval of the image:
-10.499410 52.800000

# RAcent  DECcent POSerr Theta    Phi  PeakCts   SNR AngSep     Name
#  [deg]    [deg]    ['] [deg]  [deg]                   [']
135.5104 -40.5548   12.3  46.7 -163.6   0.1815   0.9    0.8	Vela X-1
 10.6577 -29.1311    2.7  48.3   -0.7   0.8453   4.2 ------	UNKNOWN
 65.0856 -71.2266    0.8  24.1  -87.5   1.7897  14.0 ------	UNKNOWN
Post-slew image of 15-350 keV band
Time interval of the image:
134.500600 963.085500

# RAcent  DECcent POSerr Theta    Phi  PeakCts   SNR AngSep     Name
#  [deg]    [deg]    ['] [deg]  [deg]                   [']
135.4676 -40.4474    6.8  45.8  166.9  -2.2223  -1.7    7.0	Vela X-1
170.5281 -60.4900   12.0  38.6 -150.0  -0.8794  -1.0   10.1	Cen X-3
186.8396 -62.8769  116.5  40.1 -137.5   0.1055   0.1    8.1	GX 301-2
 91.1064 -32.5657    3.0  41.1  113.7   9.4285   3.9 ------	UNKNOWN
145.0184 -42.1137    4.5  47.4  176.8   3.2396   2.6 ------	UNKNOWN
174.1095 -39.3265    4.6  58.7 -159.3  12.1267   2.5 ------	UNKNOWN
317.3837 -47.5726    3.9  50.8  -44.4   8.8640   3.0 ------	UNKNOWN
203.5183 -57.5415    2.7  48.0 -129.1  13.3340   4.3 ------	UNKNOWN