Analysis Summary
Notes:
- 1) No attempt has been made to eliminate the non-significant decimal places.
- 2) This batgrbproduct analysis is done using the HEASARC data.
- 3) This batgrbproduct analysis is using the flight position for the mask-weighting calculation.
======================================================================
                  BAT GRB EVENT DATA PROCESSING REPORT
    Process Script Ver: batgrbproduct v2.46
    Process Start Time: Sun Mar 13 21:59:15 EDT 2016
             Host Name: bat1
   Current Working Dir: /local/data/bat1/alien/Swift_3rdBATcatalog/event/batevent_reproc/trigger668641
======================================================================

  Trigger: 00668641      Segment: 000

  BAT Trigger Time: 473035650.56   [s; MET]
      Trigger Stop: 473035651.584   [s; MET]
               UTC: 2015-12-28T22:47:14.940840    [includes UTCF correction]
       Where From?: TDRSS position message

  BAT
    RA: 344.440697667699   Dec: 8.07622585061263  [deg; J2000]

     Catalogged Source?: NO
     Point Source?:      YES
     GRB Indicated?:     YES    [ by BAT flight software ]
     Image S/N Ratio:    11.83
     Image Trigger?:     NO
     Rate S/N Ratio:     26.2488094968134  [ if not an image trigger ]
     Image S/N Ratio:    11.83

  Analysis Position:   [ source = BAT ]
    RA: 344.440697667699   Dec: 8.07622585061263  [deg; J2000]

  Refined Position:   [ source = BAT pre-slew burst ]
    RA: 344.425552401874   Dec: 8.08689391021929  [deg; J2000]
        { 22h 57m 42.1s , +08d 05' 12.8" }
         +/- 0.895413252274156 [arcmin] (estimated 90% radius based on SNR)
         +/- 0.321770474966319 [arcmin] (formal 1-sigma fit error)
    SNR: 35.616907779762

  Angular difference between the analysis and refined position is 1.104152 arcmin

  Partial Coding Fraction: 1.015625    [ including projection effects ]

  Duration
     T90: 48 +/- 16
        Measured from: -15.5600000023842
                   to: 32.4399999976158     [s; relative to TRIGTIME]
     T50: 16 +/- 16
        Measured from: 0.439999997615814
                   to: 16.4399999976158     [s; relative to TRIGTIME]


  Fluence
     Peak Flux  (peak 1 second)
        Measured from: 7.93999999761581
                   to: 8.93999999761581     [s; relative to TRIGTIME]
     Total Fluence
        Measured from: -15.5600000023842
                   to: 48.4399999976158     [s; relative to TRIGTIME]

             Band 1     Band 2     Band 3     Band 4
              15-25      25-50     50-100    100-350     keV
 Total     1.260967   1.614458   1.139745   0.167823
           0.049763   0.052782   0.046508   0.039892 [error]
 Peak      0.044723   0.065668   0.036422   0.004731
           0.006634   0.007329   0.006359   0.004797 [error]

     [ fluence units of on-axis counts / fully illuminated detector ]

======================================================================


====== Table of the duration information =============================

        Value   tstart    tstop
T100   64.000  -15.560   48.440
T90    48.000  -15.560   32.440
T50    16.000    0.440   16.440
Peak    1.000    7.940    8.940


====== Spectral Analysis Summary =====================================

Model      : spectral model: simple power-law (PL) and cutoff power-law (CPL)
Ph_index   : photon index: E^{Ph_index}
Ph_90err   : 90% error of the photon index
Epeak      : Epeak in keV
Epeak_90err: 90% error of Epeak
Norm       : normalization at 50 keV in both the PL model and CPL model
Nomr_90err : 90% error of the normalization
chi2       : Chi-Squared
dof        : degree of freedo

=== Time-averaged spectral analysis ===
(Best model with acceptable fit: CPL)

Model Ph_index Ph_90err_low Ph_90err_hi  Epeak  Epeak_90err_low  Epeak_90err_hi  Norm       Nomr_90err_low    Norm_90err_hi    chi2    dof
PL      -1.639    -0.073      0.073       -           -               -         4.09e-03     -1.68e-04          1.68e-04      62.700   57
CPL     -1.101    -0.305      0.327       81.971     -14.574        43.002      7.65e-03     -2.24e-03          3.47e-03      53.170   56


=== 1-s peak spectral analysis ===
(Best model with acceptable fit: PL)

Model Ph_index Ph_90err_low Ph_90err_hi  Epeak  Epeak_90err_low  Epeak_90err_hi  Norm       Nomr_90err_low    Norm_90err_hi    chi2    dof
PL      -1.641     -0.223     0.214       -           -               -         9.56e-03     -1.40e-03          1.37e-03      38.870   57
CPL     -0.808     -0.910     1.214       63.662     -17.610       -63.662      2.78e-02     -2.78e-02          1.04e-01      36.600   56


=== Fluence/Peak Flux Summary ===

              Model    Band1     Band2     Band3     Band4     Band5     Total
                       15-25     25-50    50-100    100-350    15-150    15-350    keV
Fluence         PL   3.81e-07  6.43e-07  8.26e-07  2.13e-06  2.44e-06  3.98e-06   erg/cm2
      90%_error_low -2.58e-08 -2.63e-08 -4.55e-08 -2.43e-07 -1.07e-07 -2.80e-07   erg/cm2
      90%_error_hi   2.64e-08  2.63e-08  4.54e-08  2.63e-07  1.08e-07  2.96e-07   erg/cm2
Peak flux       PL   4.51e-01  4.17e-01  2.68e-01  2.64e-01  1.25e+00  1.40e+00   ph/cm2/s
      90%_error_low -8.49e-02 -5.41e-02 -4.98e-02 -8.45e-02 -1.60e-01 -1.87e-01   ph/cm2/s
      90%_error_hi   8.82e-02  5.40e-02  4.98e-02  1.05e-01  1.60e-01  1.89e-01   ph/cm2/s

Fluence        CPL   3.46e-07  6.74e-07  8.42e-07  9.92e-07  2.32e-06  2.85e-06   erg/cm2
      90%_error_low -3.16e-08 -3.17e-08 -4.90e-08 -3.17e-07 -1.24e-07 -3.41e-07   erg/cm2
      90%_error_hi   3.21e-08  3.21e-08  4.93e-08  5.03e-07  1.24e-07  5.12e-07   erg/cm2
Peak flux      CPL   4.11e-01  4.61e-01  2.74e-01  9.81e-02  1.21e+00  1.24e+00   ph/cm2/s
      90%_error_low -9.94e-02 -7.31e-02 -5.79e-02 -9.81e-02 -1.65e-01 -1.83e-01   ph/cm2/s
      90%_error_hi   9.98e-02  7.74e-02  5.65e-02  1.98e-01  1.64e-01  2.35e-01   ph/cm2/s

======================================================================
Image
Pre-slew 15.0-350.0 keV image (Event data)
#   RAcent    DECcent   POSerr    Theta     Phi              Peak Cts       SNR   Name
  344.4256     8.0869   0.0054     1.5943   -86.0699         2.4307202     35.617 TRIG_00668641

Foreground time interval of the image:
-15.560  12.741 (delta_t =  28.301 [sec])
Background time interval of the image:
-239.560 -15.560 (delta_t = 224.000 [sec])
Light Curves
Note: The mask-weighted lightcurves have units of either count/det or counts/sec/det, where a det is 0.4 x 0.4 = 0.16 sq cm.
Full-time range; 1 s binning
Other quick-look light curves:
- 64 ms binning (zoomed)
- 16 ms binning (zoomed)
- 8 ms binning (zoomed)
- 2 ms binning (zoomed)
- SN=5 or 10 s binning (full-time range)
- Raw light curve
Spectra
- 64 ms binning (zoomed)
- 16 ms binning (zoomed)
- 8 ms binning (zoomed)
- 2 ms binning (zoomed)
- SN=5 or 10 s binning (full-time range)
- Raw light curve
Spectra
Notes:
- 1) The fitting includes the systematic errors.
- 2) When the burst includes telescope slew time periods, the fitting uses an average response file made from multiple 5-s response files through out the slew time plus single time preiod for the non-slew times, and weighted by the total counts in the corresponding time period using addrmf. An average response file is needed becuase a spectral fit using the pre-slew DRM will introduce some errors in both a spectral shape and a normalization if the PHA file contains a lot of the slew/post-slew time interval.
- 3) For fits to more complicated models (e.g. a power-law over a cutoff power-law), the BAT team has decided to require a chi-square improvement of more than 6 for each extra dof.
Time averaged spectrum fit using the average DRM
Power-law model
Time interval is from  -15.560 sec. to   48.440 sec.

Spectral model in power-law:
------------------------------------------------------------
Parameters  : value       lower 90%   higher 90%
Photon index: -1.63856     ( -0.073149   0.0726004 )
Norm@50keV  : 4.09069E-03    ( -0.000168469   0.000167933 )
------------------------------------------------------------
#Fit statistic : Chi-Squared =          62.70 using 59 PHA bins.
# Reduced chi-squared =          1.100 for     57 degrees of freedom
# Null hypothesis probability =   2.811764e-01

Photon flux (15-150 keV)    in 64 sec: 0.532166 ( -0.021703  0.021737 ) ph/cm2/s
Energy fluence (15-150 keV)             : 2.43809e-06 ( -1.07052e-07  1.07565e-07 ) ergs/cm2
Cutoff power-law model
Time interval is from  -15.560 sec. to   48.440 sec.
Spectral model in the cutoff power-law:
------------------------------------------------------------
Parameters  : value       lower 90%   higher 90%
Photon index: -1.10105     ( -0.304657   0.327265 )
Epeak [keV] : 81.9709      ( -14.5737 43.0021 )
Norm@50keV  : 7.65284E-03    ( -0.00224014   0.00346824 )
------------------------------------------------------------
#Fit statistic : Chi-Squared =          53.17 using 59 PHA bins.
# Reduced chi-squared =         0.9494 for     56 degrees of freedom
# Null hypothesis probability =   5.828383e-01

Photon flux (15-150 keV)    in 64 sec: 0.514680 ( -0.023643  0.023691 ) ph/cm2/s
Energy fluence (15-150 keV)             : 2.32327e-06 ( -1.2374e-07  1.24383e-07 ) ergs/cm2
1-s peak spectrum fit
Power-law model
Time interval is from    7.940 sec. to    8.940 sec.

Spectral model in power-law:
------------------------------------------------------------
Parameters  : value       lower 90%   higher 90%
Photon index: -1.64093     ( -0.223109   0.21401 )
Norm@50keV  : 9.56377E-03    ( -0.00139553   0.00136925 )
------------------------------------------------------------
#Fit statistic : Chi-Squared =          38.87 using 59 PHA bins.
# Reduced chi-squared =         0.6819 for     57 degrees of freedom
# Null hypothesis probability =   9.683306e-01

Photon flux (15-150 keV)    in 1 sec: 1.24513 ( -0.16035  0.16037 ) ph/cm2/s
Energy fluence (15-150 keV)             : 8.9041e-08 ( -1.37297e-08  1.39976e-08 ) ergs/cm2
Cutoff power-law model
Time interval is from    7.940 sec. to    8.940 sec.
Spectral model in the cutoff power-law:
------------------------------------------------------------
Parameters  : value       lower 90%   higher 90%
Photon index: -0.807836     ( -0.909584   1.21445 )
Epeak [keV] : 63.6620      ( -17.6093 -63.6615 )
Norm@50keV  : 2.78213E-02    ( -0.027822   0.104274 )
------------------------------------------------------------
#Fit statistic : Chi-Squared =          36.60 using 59 PHA bins.
# Reduced chi-squared =         0.6535 for     56 degrees of freedom
# Null hypothesis probability =   9.791694e-01

Photon flux (15-150 keV)    in 1 sec: 1.21431 ( -0.16491  0.16435 ) ph/cm2/s
Energy fluence (15-150 keV)             : 8.241e-08 ( -1.50922e-08  1.58439e-08 ) ergs/cm2
Time-resolved spectra

Distribution
T90 vs. Hardness ratio plot
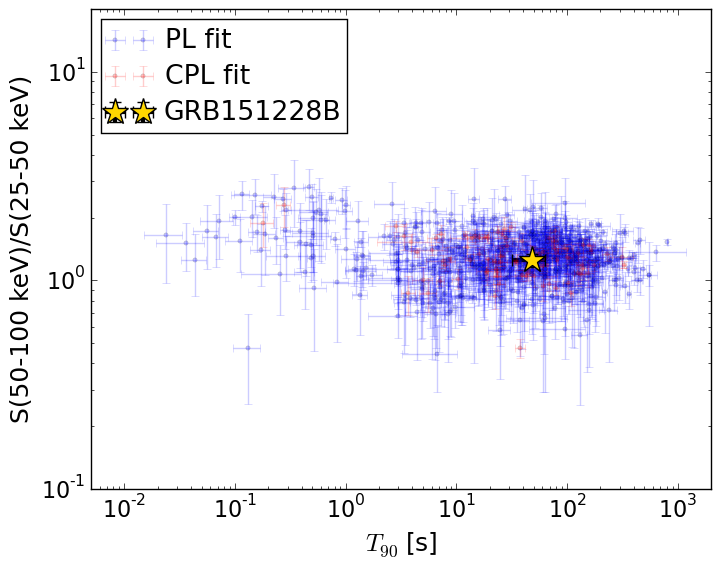
T90                                   = 48.0 sec.
Hardness ratio (energy fluence ratio) = 1.24959756115
S(15-50 keV) vs. S(50-150 keV) plot
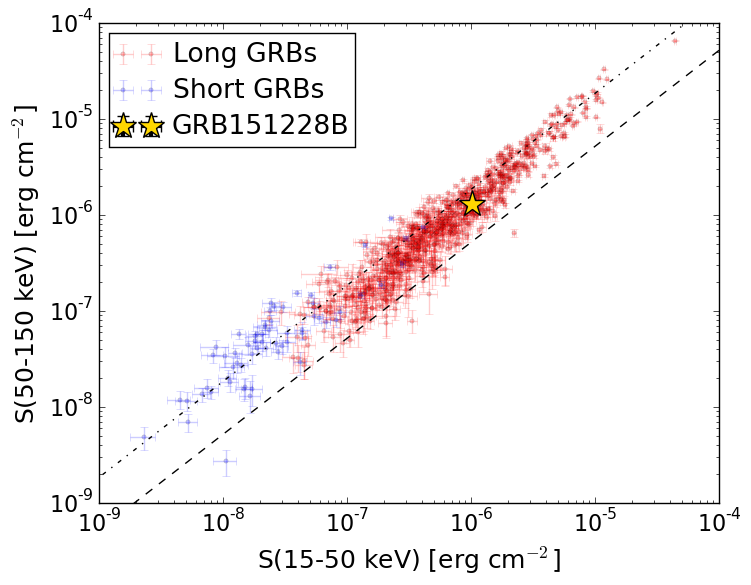
S(15-50 keV)  = 1.0202849e-06
S(50-150 keV) = 1.3030068e-06
The dash-dotted line and the dashed line traces the fluences calculated from the Band function with Epeak = 15 and 150 keV, respectively. Both lines assume a canonical values of alpha = -1 and beta = -2.5.
Mask shadow pattern

IMX = 1.907673413937355E-03, IMY = 2.776758531718286E-02
Spacecraft aspect plot
Bright source in the pre-burst/pre-slew/post-slew images
Pre-burst image of 15-350 keV band
Time interval of the image:
-239.560000 -15.560000

# RAcent  DECcent POSerr Theta    Phi  PeakCts   SNR AngSep     Name
#  [deg]    [deg]    ['] [deg]  [deg]                   [']
299.5689  35.2196    0.9  49.6  -15.5   6.1785  12.5    1.5	Cyg X-1
308.0290  40.9723    4.3  46.3   -4.6   1.1447   2.7    3.9	Cyg X-3
326.2129  38.4652    9.9  34.4    7.5  -0.3165  -1.2    8.8	Cyg X-2
 27.5113   1.2528    3.0  42.2  133.3   2.6371   3.9 ------	UNKNOWN
333.1723  51.5352    2.3  43.9   23.9   2.3180   5.1 ------	UNKNOWN
 25.4189 -34.1043    3.2  57.1  176.3   5.1717   3.6 ------	UNKNOWN
 14.6873 -32.0209    2.7  49.4 -177.4   2.3405   4.2 ------	UNKNOWN
296.8932  27.0539    2.6  49.6  -26.7   2.2700   4.5 ------	UNKNOWN
Pre-slew background subtracted image of 15-350 keV band
Time interval of the image:
-15.560000 12.740590

# RAcent  DECcent POSerr Theta    Phi  PeakCts   SNR AngSep     Name
#  [deg]    [deg]    ['] [deg]  [deg]                   [']
299.7021  35.2535    4.0  49.5  -15.4   0.4219   2.9    6.3	Cyg X-1
308.3450  40.9406    0.0  46.1   -4.4  -0.1433  -1.1   10.7	Cyg X-3
326.1761  38.4265   33.3  34.4    7.5   0.0317   0.3    6.3	Cyg X-2
  0.0834   0.8462    2.6  16.3  154.0   0.2904   4.4   51.0	UNKNOWN
344.4255   8.0869    0.3   1.6  -86.1   2.4307  35.6 ------	UNKNOWN
Post-slew image of 15-350 keV band
Time interval of the image:
35.540600 962.496500

# RAcent  DECcent POSerr Theta    Phi  PeakCts   SNR AngSep     Name
#  [deg]    [deg]    ['] [deg]  [deg]                   [']
299.5942  35.2039    0.6  49.1  -21.9  29.4232  20.4    0.2	Cyg X-1
308.0681  40.9113    2.6  46.0  -10.8   5.4707   4.4    3.1	Cyg X-3
326.1816  38.3158   40.4  34.4    2.0   0.2459   0.3    0.6	Cyg X-2
 22.0488 -17.7855    2.4  45.3  152.9   9.9853   4.8 ------	UNKNOWN
  5.4677  -6.3874    2.5  25.5  151.8   3.6891   4.7  504.0	UNKNOWN
347.8903  16.7448    2.4   9.3   48.7   2.8883   4.8 ------	UNKNOWN
353.7632 -50.1293    4.6  58.8 -159.2  15.1374   2.5 ------	UNKNOWN
314.1496  -7.1001    3.1  33.8  -88.1   5.5049   3.8 ------	UNKNOWN