Analysis Summary
Notes:
- 1) No attempt has been made to eliminate the non-significant decimal places.
- 2) This batgrbproduct analysis is done using the HEASARC data.
- 3) This batgrbproduct analysis is using the flight position for the mask-weighting calculation.
======================================================================
                  BAT GRB EVENT DATA PROCESSING REPORT
    Process Script Ver: batgrbproduct v2.46
    Process Start Time: Sun Mar 13 21:55:09 EDT 2016
             Host Name: bat1
   Current Working Dir: /local/data/bat1/alien/Swift_3rdBATcatalog/event/batevent_reproc/trigger668689
======================================================================

  Trigger: 00668689      Segment: 000

  BAT Trigger Time: 473064643.584   [s; MET]
      Trigger Stop: 473064644.096   [s; MET]
               UTC: 2015-12-29T06:50:27.963280    [includes UTCF correction]
       Where From?: TDRSS position message

  BAT
    RA: 329.379608251525   Dec: -20.7287933382282  [deg; J2000]

     Catalogged Source?: NO
     Point Source?:      YES
     GRB Indicated?:     YES    [ by BAT flight software ]
     Image S/N Ratio:    17.29
     Image Trigger?:     NO
     Rate S/N Ratio:     61.3595958265698  [ if not an image trigger ]
     Image S/N Ratio:    17.29

  Analysis Position:   [ source = BAT ]
    RA: 329.379608251525   Dec: -20.7287933382282  [deg; J2000]

  Refined Position:   [ source = BAT pre-slew burst ]
    RA: 329.364113346494   Dec: -20.7320490922243  [deg; J2000]
        { 21h 57m 27.4s , -20d 43' 55.4" }
         +/- 1.0313220661912 [arcmin] (estimated 90% radius based on SNR)
         +/- 0.357623439046106 [arcmin] (formal 1-sigma fit error)
    SNR: 29.106075488414

  Angular difference between the analysis and refined position is 0.891176 arcmin

  Partial Coding Fraction: 0.515625    [ including projection effects ]

  Duration
     T90: 1.43999993801117 +/- 0.447146548280103
        Measured from: -0.0519999861717224
                   to: 1.38799995183945     [s; relative to TRIGTIME]
     T50: 0.607999980449677 +/- 0.0804984237327102
        Measured from: 0.139999985694885
                   to: 0.747999966144562     [s; relative to TRIGTIME]


  Fluence
     Peak Flux  (peak 1 second)
        Measured from: -0.111999988555908
                   to: 0.888000011444092     [s; relative to TRIGTIME]
     Total Fluence
        Measured from: -0.111999988555908
                   to: 2.34399998188019     [s; relative to TRIGTIME]

             Band 1     Band 2     Band 3     Band 4
              15-25      25-50     50-100    100-350     keV
 Total     0.317135   0.399044   0.239992   0.044799
           0.017669   0.018918   0.015941   0.011435 [error]
 Peak      0.248873   0.320256   0.208133   0.039730
           0.013449   0.014740   0.012565   0.008356 [error]

     [ fluence units of on-axis counts / fully illuminated detector ]

======================================================================


====== Table of the duration information =============================

        Value   tstart    tstop
T100    2.456   -0.112    2.344
T90     1.440   -0.052    1.388
T50     0.608    0.140    0.748
Peak    1.000   -0.112    0.888


====== Spectral Analysis Summary =====================================

Model      : spectral model: simple power-law (PL) and cutoff power-law (CPL)
Ph_index   : photon index: E^{Ph_index}
Ph_90err   : 90% error of the photon index
Epeak      : Epeak in keV
Epeak_90err: 90% error of Epeak
Norm       : normalization at 50 keV in both the PL model and CPL model
Nomr_90err : 90% error of the normalization
chi2       : Chi-Squared
dof        : degree of freedo

=== Time-averaged spectral analysis ===
(Best model with acceptable fit: PL)

Model Ph_index Ph_90err_low Ph_90err_hi  Epeak  Epeak_90err_low  Epeak_90err_hi  Norm       Nomr_90err_low    Norm_90err_hi    chi2    dof
PL      -1.843    -0.103      0.101       -           -               -         2.59e-02     -1.62e-03          1.60e-03      48.280   57
CPL     -1.442    -0.393      0.434       65.878     -15.048       318.777      4.22e-02     -1.56e-02          2.86e-02      45.220   56


=== 1-s peak spectral analysis ===
(Best model with acceptable fit: PL)

Model Ph_index Ph_90err_low Ph_90err_hi  Epeak  Epeak_90err_low  Epeak_90err_hi  Norm       Nomr_90err_low    Norm_90err_hi    chi2    dof
PL      -1.739     -0.096     0.094       -           -               -         5.33e-02     -3.05e-03          3.03e-03      60.320   57
CPL     -1.442     -0.335     0.383       92.378     -28.238       -92.378      7.57e-02     -2.39e-02          4.23e-02      58.250   56


=== Fluence/Peak Flux Summary ===

              Model    Band1     Band2     Band3     Band4     Band5     Total
                       15-25     25-50    50-100    100-350    15-150    15-350    keV
Fluence         PL   1.12e-07  1.67e-07  1.87e-07  3.93e-07  5.85e-07  8.60e-07   erg/cm2
      90%_error_low -1.00e-08 -9.58e-09 -1.56e-08 -6.40e-08 -3.67e-08 -7.94e-08   erg/cm2
      90%_error_hi   1.03e-08  9.57e-09  1.56e-08  7.16e-08  3.69e-08  8.49e-08   erg/cm2
Peak flux       PL   2.76e+00  2.41e+00  1.44e+00  1.30e+00  7.17e+00  7.92e+00   ph/cm2/s
      90%_error_low -2.44e-01 -1.35e-01 -1.06e-01 -1.82e-01 -3.99e-01 -4.25e-01   ph/cm2/s
      90%_error_hi   2.51e-01  1.35e-01  1.05e-01  1.99e-01  4.00e-01  4.25e-01   ph/cm2/s

Fluence        CPL    N/A      N/A      N/A      N/A      N/A      N/A      erg/cm2
      90%_error_low -1.00e-08 -9.58e-09 -1.56e-08 -6.40e-08 -3.67e-08 -7.94e-08   erg/cm2
      90%_error_hi   1.03e-08  9.57e-09  1.56e-08  7.16e-08  3.69e-08  8.49e-08   erg/cm2
Peak flux      CPL   2.62e+00  2.48e+00  1.48e+00  9.29e-01  7.08e+00  7.51e+00   ph/cm2/s
      90%_error_low -2.90e-01 -1.59e-01 -1.15e-01 -3.08e-01 -4.14e-01 -5.37e-01   ph/cm2/s
      90%_error_hi   2.94e-01  1.62e-01  1.17e-01  4.48e-01  4.14e-01  6.18e-01   ph/cm2/s

======================================================================
Image
Pre-slew 15.0-350.0 keV image (Event data)
#   RAcent    DECcent   POSerr    Theta     Phi              Peak Cts       SNR   Name
  329.3641   -20.7320   0.0066    32.4304  -125.2401         1.0129360     29.106 TRIG_00668689

Foreground time interval of the image:
 -0.112   2.344 (delta_t =   2.456 [sec])
Background time interval of the image:
-239.584  -0.112 (delta_t = 239.472 [sec])
Light Curves
Note: The mask-weighted lightcurves have units of either count/det or counts/sec/det, where a det is 0.4 x 0.4 = 0.16 sq cm.
Full-time range; 1 s binning
Other quick-look light curves:
- 64 ms binning (zoomed)
- 16 ms binning (zoomed)
- 8 ms binning (zoomed)
- 2 ms binning (zoomed)
- SN=5 or 10 s binning (full-time range)
- Raw light curve
Spectra
- 64 ms binning (zoomed)
- 16 ms binning (zoomed)
- 8 ms binning (zoomed)
- 2 ms binning (zoomed)
- SN=5 or 10 s binning (full-time range)
- Raw light curve
Spectra
Notes:
- 1) The fitting includes the systematic errors.
- 2) When the burst includes telescope slew time periods, the fitting uses an average response file made from multiple 5-s response files through out the slew time plus single time preiod for the non-slew times, and weighted by the total counts in the corresponding time period using addrmf. An average response file is needed becuase a spectral fit using the pre-slew DRM will introduce some errors in both a spectral shape and a normalization if the PHA file contains a lot of the slew/post-slew time interval.
- 3) For fits to more complicated models (e.g. a power-law over a cutoff power-law), the BAT team has decided to require a chi-square improvement of more than 6 for each extra dof.
Time averaged spectrum fit using the average DRM
Power-law model
Time interval is from   -0.112 sec. to    2.344 sec.

Spectral model in power-law:
------------------------------------------------------------
Parameters  : value       lower 90%   higher 90%
Photon index: -1.8435     ( -0.103269   0.101262 )
Norm@50keV  : 2.59169E-02    ( -0.00161851   0.00160506 )
------------------------------------------------------------
#Fit statistic : Chi-Squared =          48.28 using 59 PHA bins.
# Reduced chi-squared =         0.8471 for     57 degrees of freedom
# Null hypothesis probability =   7.878170e-01

Photon flux (15-150 keV)    in 2.456 sec: 3.63351 ( -0.21256  0.21287 ) ph/cm2/s
Energy fluence (15-150 keV)             : 5.85422e-07 ( -3.66924e-08  3.68903e-08 ) ergs/cm2
Cutoff power-law model
Time interval is from   -0.112 sec. to    2.344 sec.
Spectral model in the cutoff power-law:
------------------------------------------------------------
Parameters  : value       lower 90%   higher 90%
Photon index: -1.44228     ( -0.392709   0.433588 )
Epeak [keV] : 65.8784      ( -15.0478 318.777 )
Norm@50keV  : 4.21836E-02    ( -0.015645   0.0285589 )
------------------------------------------------------------
#Fit statistic : Chi-Squared =          45.22 using 59 PHA bins.
# Reduced chi-squared =         0.8076 for     56 degrees of freedom
# Null hypothesis probability =   8.480057e-01

Photon flux (15-150 keV)    in 2.456 sec: 3.56548 ( -0.22258  0.22262 ) ph/cm2/s
Energy fluence (15-150 keV)             : 0 ( 0  0 ) ergs/cm2
1-s peak spectrum fit
Power-law model
Time interval is from   -0.112 sec. to    0.888 sec.

Spectral model in power-law:
------------------------------------------------------------
Parameters  : value       lower 90%   higher 90%
Photon index: -1.73897     ( -0.0956826   0.0942726 )
Norm@50keV  : 5.32515E-02    ( -0.00304953   0.00303204 )
------------------------------------------------------------
#Fit statistic : Chi-Squared =          60.32 using 59 PHA bins.
# Reduced chi-squared =          1.058 for     57 degrees of freedom
# Null hypothesis probability =   3.565723e-01

Photon flux (15-150 keV)    in 1 sec: 7.17176 ( -0.39926  0.39981 ) ph/cm2/s
Energy fluence (15-150 keV)             : 4.91768e-07 ( -2.91101e-08  2.92467e-08 ) ergs/cm2
Cutoff power-law model
Time interval is from   -0.112 sec. to    0.888 sec.
Spectral model in the cutoff power-law:
------------------------------------------------------------
Parameters  : value       lower 90%   higher 90%
Photon index: -1.44246     ( -0.334804   0.383196 )
Epeak [keV] : 92.3781      ( -28.2381 -92.3782 )
Norm@50keV  : 7.56999E-02    ( -0.0238594   0.0423383 )
------------------------------------------------------------
#Fit statistic : Chi-Squared =          58.25 using 59 PHA bins.
# Reduced chi-squared =          1.040 for     56 degrees of freedom
# Null hypothesis probability =   3.925411e-01

Photon flux (15-150 keV)    in 1 sec: 7.07773 ( -0.41435  0.41445 ) ph/cm2/s
Energy fluence (15-150 keV)             : 4.82225e-07 ( -3.15328e-08  3.14164e-08 ) ergs/cm2
Time-resolved spectra
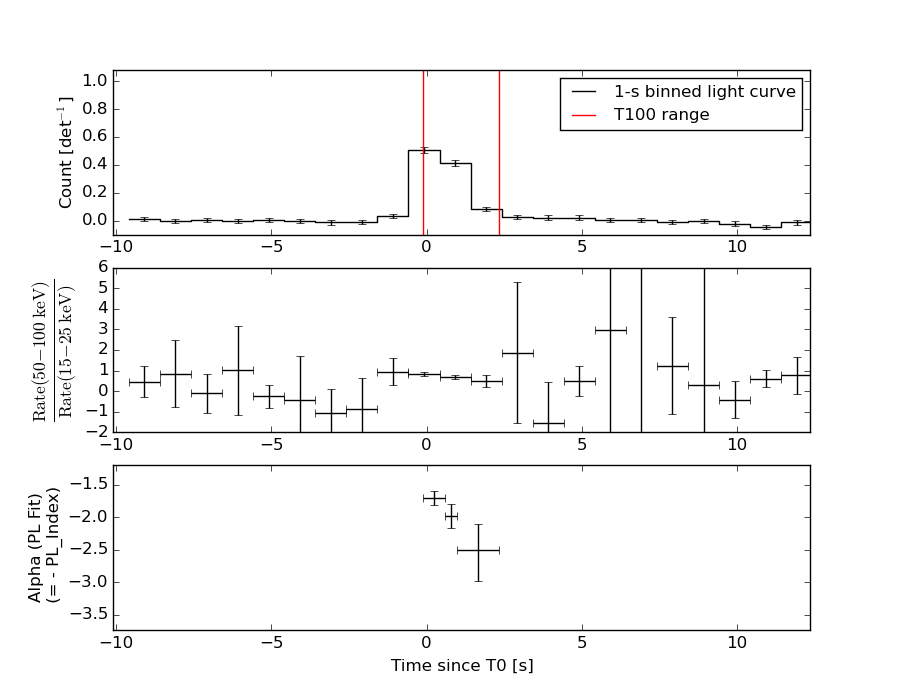
Distribution
T90 vs. Hardness ratio plot
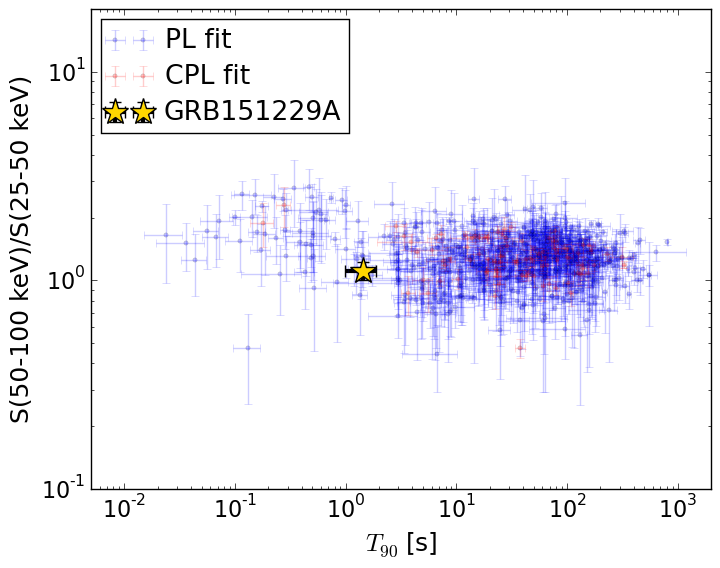
T90                                   = 1.44 sec.
Hardness ratio (energy fluence ratio) = 1.1146023781
S(15-50 keV) vs. S(50-150 keV) plot
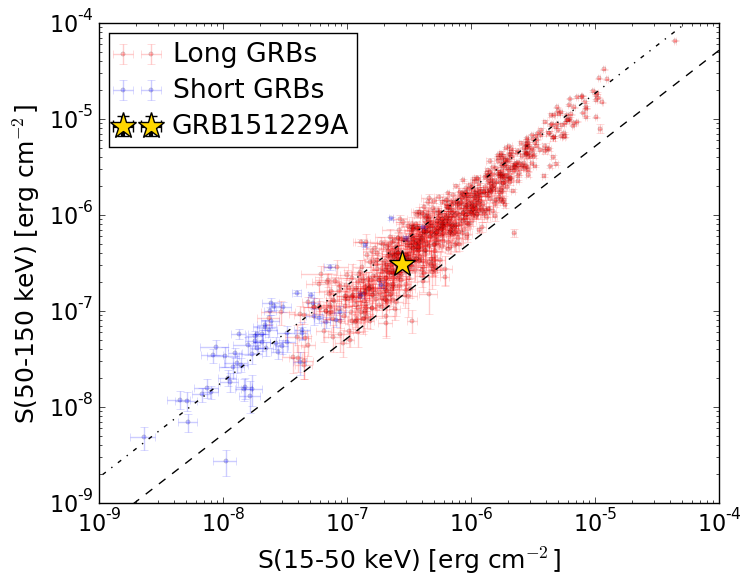
S(15-50 keV)  = 2.797908e-07
S(50-150 keV) = 3.056282e-07
The dash-dotted line and the dashed line traces the fluences calculated from the Band function with Epeak = 15 and 150 keV, respectively. Both lines assume a canonical values of alpha = -1 and beta = -2.5.
Mask shadow pattern
IMX = -3.666079264543144E-01, IMY = 5.189278748372695E-01
Spacecraft aspect plot
Bright source in the pre-burst/pre-slew/post-slew images
Pre-burst image of 15-350 keV band
Time interval of the image:
-239.584000 -0.112000

# RAcent  DECcent POSerr Theta    Phi  PeakCts   SNR AngSep     Name
#  [deg]    [deg]    ['] [deg]  [deg]                   [']
299.5925  35.2126    0.7  49.1  -21.9   7.6840  16.6    0.7	Cyg X-1
308.1028  40.9470    2.3  46.0  -10.7   1.8895   4.9    0.5	Cyg X-3
326.1727  38.3045   21.7  34.4    1.9   0.1464   0.5    1.0	Cyg X-2
Pre-slew background subtracted image of 15-350 keV band
Time interval of the image:
-0.112000 2.344000

# RAcent  DECcent POSerr Theta    Phi  PeakCts   SNR AngSep     Name
#  [deg]    [deg]    ['] [deg]  [deg]                   [']
299.6065  35.1644   10.7  49.1  -22.0  -0.0596  -1.1    2.4	Cyg X-1
308.0387  40.9510    6.4  46.0  -10.8  -0.0753  -1.8    3.2	Cyg X-3
325.9309  38.3725    0.0  34.6    1.7   0.0299   1.1   11.7	Cyg X-2
 28.8798 -18.7627    2.7  51.4  149.7   0.4575   4.2 ------	UNKNOWN
306.2178  23.1665    2.4  39.6  -35.4   0.1855   4.9 ------	UNKNOWN
329.3641 -20.7320    0.4  32.4 -125.2   1.0127  29.1 ------	UNKNOWN
Post-slew image of 15-350 keV band
Time interval of the image:
70.716590 768.116600

# RAcent  DECcent POSerr Theta    Phi  PeakCts   SNR AngSep     Name
#  [deg]    [deg]    ['] [deg]  [deg]                   [']
288.9179  10.8547    0.0  50.8  -42.1   1.1380   0.4    8.9	GRS 1915+105
291.6169  -9.9788    4.0  37.9  -66.1   3.4149   2.9 ------	UNKNOWN
284.1919 -58.4621    4.0  49.8 -137.6   6.2010   2.9 ------	UNKNOWN
287.8379   9.4193    3.3  50.8  -44.4   9.9568   3.5 ------	UNKNOWN