Analysis Summary
Notes:
- 1) No attempt has been made to eliminate the non-significant decimal places.
- 2) This batgrbproduct analysis is done using the HEASARC data.
- 3) This batgrbproduct analysis is using the flight position for the mask-weighting calculation.
======================================================================
                  BAT GRB EVENT DATA PROCESSING REPORT
    Process Script Ver: batgrbproduct v2.46
    Process Start Time: Thu Mar 17 19:08:07 EDT 2016
             Host Name: bat1
   Current Working Dir: /local/data/bat1/alien/Swift_3rdBATcatalog/event/batevent_reproc/trigger669319
======================================================================

  Trigger: 00669319      Segment: 000

  BAT Trigger Time: 473599466.496   [s; MET]
      Trigger Stop: 473599467.52   [s; MET]
               UTC: 2016-01-04T11:24:10.846420    [includes UTCF correction]
       Where From?: TDRSS position message

  BAT
    RA: 76.8038165818516   Dec: 11.3540862276317  [deg; J2000]

     Catalogged Source?: NO
     Point Source?:      YES
     GRB Indicated?:     YES    [ by BAT flight software ]
     Image S/N Ratio:    8.69
     Image Trigger?:     NO
     Rate S/N Ratio:     15.7162336455017  [ if not an image trigger ]
     Image S/N Ratio:    8.69

  Analysis Position:   [ source = BAT ]
    RA: 76.8038165818516   Dec: 11.3540862276317  [deg; J2000]

  Refined Position:   [ source = BAT pre-slew burst ]
    RA: 76.8104786072597   Dec: 11.3325967804089  [deg; J2000]
        { 05h 07m 14.5s , +11d 19' 57.3" }
         +/- 1.65507686297469 [arcmin] (estimated 90% radius based on SNR)
         +/- 0.574623163555882 [arcmin] (formal 1-sigma fit error)
    SNR: 14.8088385311091

  Angular difference between the analysis and refined position is 1.347614 arcmin

  Partial Coding Fraction: 1.015625    [ including projection effects ]

  Duration
     T90: 16.5639999508858 +/- 2.78765064453465
        Measured from: -0.935999989509583
                   to: 15.6279999613762     [s; relative to TRIGTIME]
     T50: 10.3159999847412 +/- 3.98850551658403
        Measured from: 0.343999981880188
                   to: 10.6599999666214     [s; relative to TRIGTIME]


  Fluence
     Peak Flux  (peak 1 second)
        Measured from: -0.163999974727631
                   to: 0.836000025272369     [s; relative to TRIGTIME]
     Total Fluence
        Measured from: -1.31199997663498
                   to: 17.6480000019073     [s; relative to TRIGTIME]

             Band 1     Band 2     Band 3     Band 4
              15-25      25-50     50-100    100-350     keV
 Total     0.249276   0.308652   0.169364   0.015621
           0.027393   0.028522   0.024132   0.020343 [error]
 Peak      0.034432   0.058013   0.035211   0.008057
           0.006728   0.007205   0.006288   0.004772 [error]

     [ fluence units of on-axis counts / fully illuminated detector ]

======================================================================


====== Table of the duration information =============================

        Value   tstart    tstop
T100   18.960   -1.312   17.648
T90    16.564   -0.936   15.628
T50    10.316    0.344   10.660
Peak    1.000   -0.164    0.836


====== Spectral Analysis Summary =====================================

Model      : spectral model: simple power-law (PL) and cutoff power-law (CPL)
Ph_index   : photon index: E^{Ph_index}
Ph_90err   : 90% error of the photon index
Epeak      : Epeak in keV
Epeak_90err: 90% error of Epeak
Norm       : normalization at 50 keV in both the PL model and CPL model
Nomr_90err : 90% error of the normalization
chi2       : Chi-Squared
dof        : degree of freedo

=== Time-averaged spectral analysis ===
(Best model with acceptable fit: PL)

Model Ph_index Ph_90err_low Ph_90err_hi  Epeak  Epeak_90err_low  Epeak_90err_hi  Norm       Nomr_90err_low    Norm_90err_hi    chi2    dof
PL      -1.755    -0.193      0.186       -           -               -         2.32e-03     -2.92e-04          2.87e-04      61.540   57
CPL     -1.017    -0.726      0.897       57.998     -14.705       281.262      6.04e-03     -3.62e-03          1.33e-02      58.500   56


=== 1-s peak spectral analysis ===
(Best model with acceptable fit: PL)

Model Ph_index Ph_90err_low Ph_90err_hi  Epeak  Epeak_90err_low  Epeak_90err_hi  Norm       Nomr_90err_low    Norm_90err_hi    chi2    dof
PL      -1.481     -0.258     0.252       -           -               -         8.23e-03     -1.33e-03          1.32e-03      54.810   57
CPL     -0.724     -0.877     1.361       77.848     -25.731       -77.848      2.12e-02     -2.12e-02          9.63e-02      53.270   56


=== Fluence/Peak Flux Summary ===

              Model    Band1     Band2     Band3     Band4     Band5     Total
                       15-25     25-50    50-100    100-350    15-150    15-350    keV
Fluence         PL   7.14e-08  1.12e-07  1.33e-07  3.06e-07  4.06e-07  6.23e-07   erg/cm2
      90%_error_low -1.10e-08 -1.20e-08 -2.23e-08 -9.19e-08 -5.23e-08 -1.17e-07   erg/cm2
      90%_error_hi   1.13e-08  1.20e-08  2.26e-08  1.15e-07  5.33e-08  1.35e-07   erg/cm2
Peak flux       PL   3.33e-01  3.39e-01  2.43e-01  2.77e-01  1.02e+00  1.19e+00   ph/cm2/s
      90%_error_low -7.87e-02 -5.36e-02 -4.93e-02 -9.74e-02 -1.56e-01 -1.89e-01   ph/cm2/s
      90%_error_hi   8.30e-02  5.32e-02  4.90e-02  1.25e-01  1.56e-01  1.92e-01   ph/cm2/s

Fluence        CPL   6.65e-08  1.23e-07  1.32e-07  9.61e-08  3.77e-07  4.17e-07   erg/cm2
      90%_error_low -1.24e-08 -1.60e-08 -2.62e-08 -6.47e-08 -5.70e-08 -8.80e-08   erg/cm2
      90%_error_hi   1.25e-08  1.67e-08  2.52e-08  2.02e-07  5.96e-08  2.06e-07   erg/cm2
Peak flux      CPL   3.02e-01  3.70e-01  2.52e-01  1.14e-01  9.98e-01  1.04e+00   ph/cm2/s
      90%_error_low -9.00e-02 -3.46e-02 -5.62e-02 -1.14e-01 -1.60e-01 -1.86e-01   ph/cm2/s
      90%_error_hi   9.30e-02  7.35e-02  5.60e-02  2.06e-01  1.60e-01  2.71e-01   ph/cm2/s

======================================================================
Image
Pre-slew 15.0-350.0 keV image (Event data)
#   RAcent    DECcent   POSerr    Theta     Phi              Peak Cts       SNR   Name
   76.8105    11.3326   0.0130     6.1507   -63.7919         0.7572659     14.809 TRIG_00669319

Foreground time interval of the image:
 -1.312  17.648 (delta_t =  18.960 [sec])
Background time interval of the image:
-441.395 -423.506 (delta_t =  17.889 [sec])
-239.496  -1.312 (delta_t = 238.184 [sec])
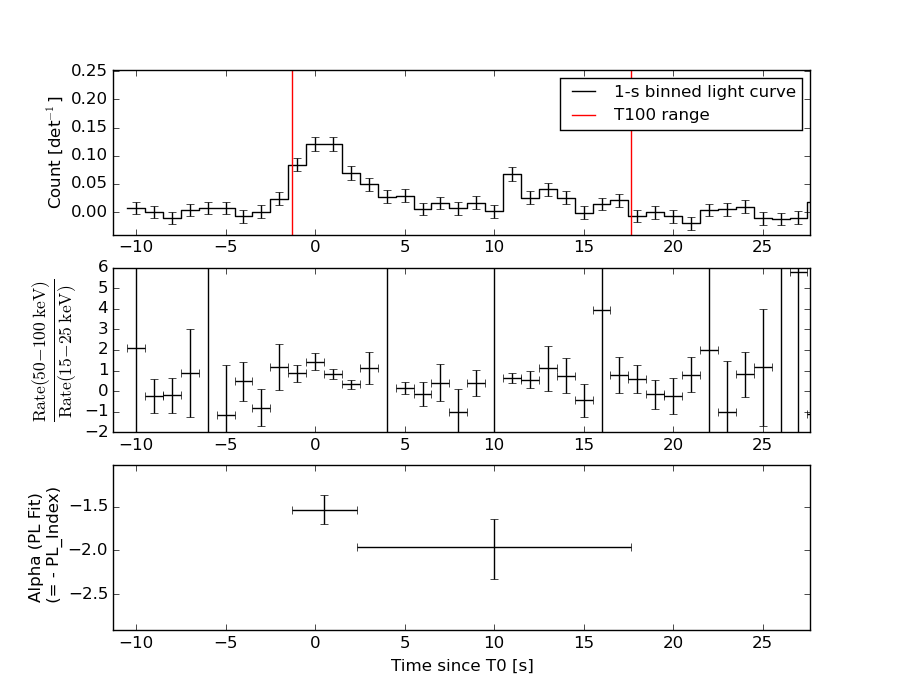
Light Curves
Note: The mask-weighted lightcurves have units of either count/det or counts/sec/det, where a det is 0.4 x 0.4 = 0.16 sq cm.
Full-time range; 1 s binning
Other quick-look light curves:
- 64 ms binning (zoomed)
- 16 ms binning (zoomed)
- 8 ms binning (zoomed)
- 2 ms binning (zoomed)
- SN=5 or 10 s binning (full-time range)
- Raw light curve
Spectra
- 64 ms binning (zoomed)
- 16 ms binning (zoomed)
- 8 ms binning (zoomed)
- 2 ms binning (zoomed)
- SN=5 or 10 s binning (full-time range)
- Raw light curve
Spectra
Notes:
- 1) The fitting includes the systematic errors.
- 2) When the burst includes telescope slew time periods, the fitting uses an average response file made from multiple 5-s response files through out the slew time plus single time preiod for the non-slew times, and weighted by the total counts in the corresponding time period using addrmf. An average response file is needed becuase a spectral fit using the pre-slew DRM will introduce some errors in both a spectral shape and a normalization if the PHA file contains a lot of the slew/post-slew time interval.
- 3) For fits to more complicated models (e.g. a power-law over a cutoff power-law), the BAT team has decided to require a chi-square improvement of more than 6 for each extra dof.
Time averaged spectrum fit using the average DRM
Power-law model
Time interval is from   -1.312 sec. to   17.648 sec.

Spectral model in power-law:
------------------------------------------------------------
Parameters  : value       lower 90%   higher 90%
Photon index: -1.75506     ( -0.193375   0.186115 )
Norm@50keV  : 2.31946E-03    ( -0.00029207   0.000286854 )
------------------------------------------------------------
#Fit statistic : Chi-Squared =          61.54 using 59 PHA bins.
# Reduced chi-squared =          1.080 for     57 degrees of freedom
# Null hypothesis probability =   3.167058e-01

Photon flux (15-150 keV)    in 18.96 sec: 0.314232 ( -0.033755  0.033761 ) ph/cm2/s
Energy fluence (15-150 keV)             : 4.0574e-07 ( -5.22981e-08  5.33398e-08 ) ergs/cm2
Cutoff power-law model
Time interval is from   -1.312 sec. to   17.648 sec.
Spectral model in the cutoff power-law:
------------------------------------------------------------
Parameters  : value       lower 90%   higher 90%
Photon index: -1.01715     ( -0.726132   0.896727 )
Epeak [keV] : 57.9984      ( -14.705 281.262 )
Norm@50keV  : 6.03707E-03    ( -0.00362276   0.0133475 )
------------------------------------------------------------
#Fit statistic : Chi-Squared =          58.50 using 59 PHA bins.
# Reduced chi-squared =          1.045 for     56 degrees of freedom
# Null hypothesis probability =   3.837142e-01

Photon flux (15-150 keV)    in 18.96 sec: 0.306195 ( -0.034584  0.034612 ) ph/cm2/s
Energy fluence (15-150 keV)             : 3.77171e-07 ( -5.70398e-08  5.95943e-08 ) ergs/cm2
1-s peak spectrum fit
Power-law model
Time interval is from   -0.164 sec. to    0.836 sec.

Spectral model in power-law:
------------------------------------------------------------
Parameters  : value       lower 90%   higher 90%
Photon index: -1.48142     ( -0.25787   0.252201 )
Norm@50keV  : 8.23338E-03    ( -0.00133271   0.0013162 )
------------------------------------------------------------
#Fit statistic : Chi-Squared =          54.81 using 59 PHA bins.
# Reduced chi-squared =         0.9616 for     57 degrees of freedom
# Null hypothesis probability =   5.576729e-01

Photon flux (15-150 keV)    in 1 sec: 1.02282 ( -0.156266  0.15633 ) ph/cm2/s
Energy fluence (15-150 keV)             : 7.83592e-08 ( -1.38889e-08  1.41596e-08 ) ergs/cm2
Cutoff power-law model
Time interval is from   -0.164 sec. to    0.836 sec.
Spectral model in the cutoff power-law:
------------------------------------------------------------
Parameters  : value       lower 90%   higher 90%
Photon index: -0.723957     ( -0.877379   1.36073 )
Epeak [keV] : 77.8484      ( -25.7313 -77.8485 )
Norm@50keV  : 2.11819E-02    ( -0.0211818   0.0962996 )
------------------------------------------------------------
#Fit statistic : Chi-Squared =          53.27 using 59 PHA bins.
# Reduced chi-squared =         0.9513 for     56 degrees of freedom
# Null hypothesis probability =   5.788264e-01

Photon flux (15-150 keV)    in 1 sec: 0.998123 ( -0.160412  0.160177 ) ph/cm2/s
Energy fluence (15-150 keV)             : 7.29995e-08 ( -1.56367e-08  1.59739e-08 ) ergs/cm2
Time-resolved spectra
Distribution
T90 vs. Hardness ratio plot
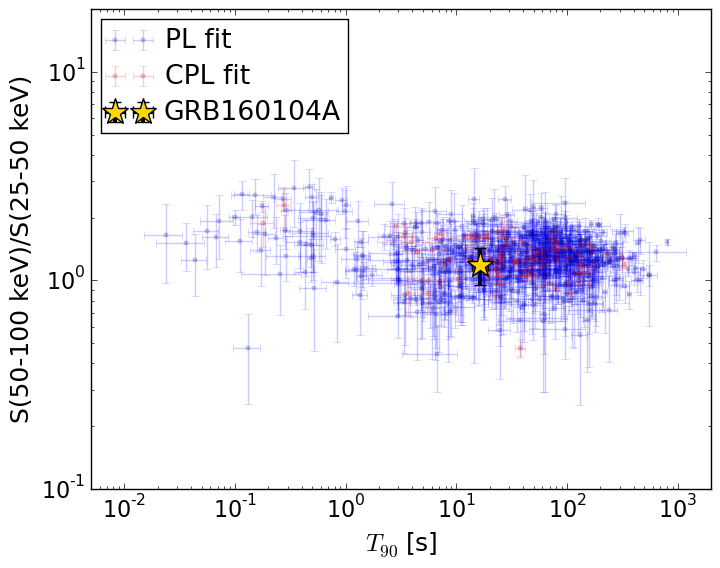
T90                                   = 16.564 sec.
Hardness ratio (energy fluence ratio) = 1.18508686786
S(15-50 keV) vs. S(50-150 keV) plot
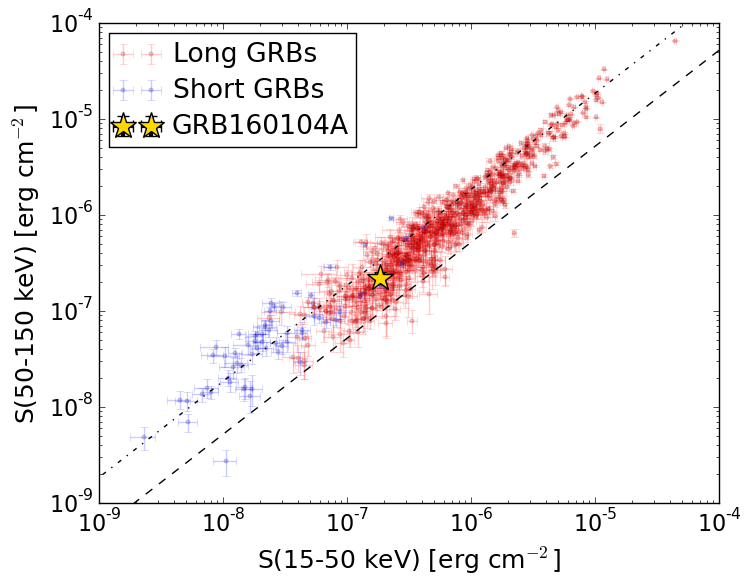
S(15-50 keV)  = 1.8367566e-07
S(50-150 keV) = 2.2206906e-07
The dash-dotted line and the dashed line traces the fluences calculated from the Band function with Epeak = 15 and 150 keV, respectively. Both lines assume a canonical values of alpha = -1 and beta = -2.5.
Mask shadow pattern
IMX = 4.759261233783420E-02, IMY = 9.668638485343777E-02
Spacecraft aspect plot
Bright source in the pre-burst/pre-slew/post-slew images
Pre-burst image of 15-350 keV band
Time interval of the image:
-441.395410 -423.506000
-239.496000 -1.312000

# RAcent  DECcent POSerr Theta    Phi  PeakCts   SNR AngSep     Name
#  [deg]    [deg]    ['] [deg]  [deg]                   [']
 83.6310  22.0164    0.3   8.5   52.5  10.9065  44.5    0.2	Crab
125.6737  -1.7056    2.4  45.3  152.9   3.4296   4.9 ------	UNKNOWN
 24.6960  42.3113    2.7  57.4   -1.5   6.2363   4.4 ------	UNKNOWN
 84.6440 -33.5671    3.1  47.1 -135.6   2.8443   3.8 ------	UNKNOWN
Pre-slew background subtracted image of 15-350 keV band
Time interval of the image:
-1.312000 17.648000

# RAcent  DECcent POSerr Theta    Phi  PeakCts   SNR AngSep     Name
#  [deg]    [deg]    ['] [deg]  [deg]                   [']
 83.6400  22.0172  605.0   8.5   52.5   0.0010   0.0    0.4	Crab
 76.8105  11.3326    0.8   6.2  -63.8   0.7573  14.8 ------	UNKNOWN
108.5411 -38.2945    2.5  57.2 -157.4   1.1765   4.5 ------	UNKNOWN
 39.7305   7.5833    2.2  42.6  -46.9   0.5913   5.2 ------	UNKNOWN
 45.0414  -1.9440    2.3  40.4  -63.1   0.6504   5.0 ------	UNKNOWN
Post-slew image of 15-350 keV band
Time interval of the image:
60.804600 840.264000
840.504000 962.598600

# RAcent  DECcent POSerr Theta    Phi  PeakCts   SNR AngSep     Name
#  [deg]    [deg]    ['] [deg]  [deg]                   [']
 83.6364  22.0159    0.2  12.5   57.7  38.8349  60.3    0.2	Crab
113.2743  13.1835    3.3  35.7  110.2   5.4131   3.5 ------	UNKNOWN
 98.5182 -39.2773    2.9  54.5 -173.5  10.3499   3.9 ------	UNKNOWN
 29.4864  50.7475    3.9  55.0   -7.5   6.1475   3.0 ------	UNKNOWN
 84.7337 -39.2377    3.4  51.1 -160.8   6.3081   3.4 ------	UNKNOWN
 65.5559 -40.7484    3.5  53.1 -142.3  15.9527   3.3 ------	UNKNOWN