Analysis Summary
Notes:
- 1) No attempt has been made to eliminate the non-significant decimal places.
- 2) This batgrbproduct analysis is done using the HEASARC data.
- 3) This batgrbproduct analysis is using the flight position for the mask-weighting calculation.
======================================================================
                  BAT GRB EVENT DATA PROCESSING REPORT
    Process Script Ver: batgrbproduct v2.46
    Process Start Time: Thu Mar 17 19:04:28 EDT 2016
             Host Name: bat1
   Current Working Dir: /local/data/bat1/alien/Swift_3rdBATcatalog/event/batevent_reproc/trigger670793
======================================================================

  Trigger: 00670793      Segment: 000

  BAT Trigger Time: 474718368   [s; MET]
      Trigger Stop: 474718432   [s; MET]
               UTC: 2016-01-17T10:12:32.290060    [includes UTCF correction]
       Where From?: TDRSS position message

  BAT
    RA: 20.3799940195987   Dec: -0.640262519697645  [deg; J2000]

     Catalogged Source?: NO
     Point Source?:      YES
     GRB Indicated?:     YES    [ by BAT flight software ]
     Image S/N Ratio:    8.99
     Image Trigger?:     YES
     Rate S/N Ratio:     0  [ if not an image trigger ]
     Image S/N Ratio:    8.99

  Analysis Position:   [ source = BAT ]
    RA: 20.3799940195987   Dec: -0.640262519697645  [deg; J2000]

  Refined Position:   [ source = BAT pre-slew burst ]
    RA: 20.3716053492741   Dec: -0.678825371260665  [deg; J2000]
        { 01h 21m 29.2s , -00d 40' 43.8" }
         +/- 1.93997480229112 [arcmin] (estimated 90% radius based on SNR)
         +/- 0.727292271306965 [arcmin] (formal 1-sigma fit error)
    SNR: 11.8026929748799

  Angular difference between the analysis and refined position is 2.367875 arcmin

  Partial Coding Fraction: 0.609375    [ including projection effects ]

  Duration
     T90: 137 +/- 20.3960780543711
        Measured from: -33
                   to: 104     [s; relative to TRIGTIME]
     T50: 31 +/- 11.1803398874989
        Measured from: 59
                   to: 90     [s; relative to TRIGTIME]


  Fluence
     Peak Flux  (peak 1 second)
        Measured from: 76
                   to: 77     [s; relative to TRIGTIME]
     Total Fluence
        Measured from: -60
                   to: 113     [s; relative to TRIGTIME]

             Band 1     Band 2     Band 3     Band 4
              15-25      25-50     50-100    100-350     keV
 Total     2.445998   2.352710   1.052873   0.209398
           0.103599   0.106066   0.090157   0.076334 [error]
 Peak      0.057528   0.051901   0.028568   0.000817
           0.008789   0.009155   0.007244   0.005837 [error]

     [ fluence units of on-axis counts / fully illuminated detector ]

======================================================================


====== Table of the duration information =============================

        Value   tstart    tstop
T100  173.000  -60.000  113.000
T90   137.000  -33.000  104.000
T50    31.000   59.000   90.000
Peak    1.000   76.000   77.000


====== Spectral Analysis Summary =====================================

Model      : spectral model: simple power-law (PL) and cutoff power-law (CPL)
Ph_index   : photon index: E^{Ph_index}
Ph_90err   : 90% error of the photon index
Epeak      : Epeak in keV
Epeak_90err: 90% error of Epeak
Norm       : normalization at 50 keV in both the PL model and CPL model
Nomr_90err : 90% error of the normalization
chi2       : Chi-Squared
dof        : degree of freedo

=== Time-averaged spectral analysis ===
(Best model with acceptable fit: PL)

Model Ph_index Ph_90err_low Ph_90err_hi  Epeak  Epeak_90err_low  Epeak_90err_hi  Norm       Nomr_90err_low    Norm_90err_hi    chi2    dof
PL      -2.154    -0.115      0.112       -           -               -         1.97e-03     -1.40e-04          1.39e-04      63.700   57
CPL     -1.995     1.995      1.995        1.157       0.740        44.444      2.48e-03     -3.03e-04          2.57e-03      62.980   56


=== 1-s peak spectral analysis ===
(Best model with acceptable fit: PL)

Model Ph_index Ph_90err_low Ph_90err_hi  Epeak  Epeak_90err_low  Epeak_90err_hi  Norm       Nomr_90err_low    Norm_90err_hi    chi2    dof
PL      -2.056     -0.345     0.311       -           -               -         7.58e-03     -1.86e-03          1.80e-03      70.290   57
CPL     -0.684     -1.334     2.029       37.742     -31.340        30.689      5.10e-02     -5.10e-02          9.33e-01      67.460   56


=== Fluence/Peak Flux Summary ===

              Model    Band1     Band2     Band3     Band4     Band5     Total
                       15-25     25-50    50-100    100-350    15-150    15-350    keV
Fluence         PL   8.06e-07  9.97e-07  8.96e-07  1.40e-06  3.18e-06  4.09e-06   erg/cm2
      90%_error_low -6.66e-08 -5.50e-08 -8.86e-08 -2.60e-07 -2.00e-07 -3.59e-07   erg/cm2
      90%_error_hi   6.80e-08  5.51e-08  9.00e-08  2.99e-07  2.02e-07  3.87e-07   erg/cm2
Peak flux       PL   5.34e-01  3.87e-01  1.86e-01  1.27e-01  1.17e+00  1.23e+00   ph/cm2/s
      90%_error_low -1.28e-01 -7.30e-02 -5.70e-02 -6.01e-02 -2.17e-01 -2.32e-01   ph/cm2/s
      90%_error_hi   1.32e-01  7.27e-02  5.90e-02  8.48e-02  2.17e-01  2.33e-01   ph/cm2/s

Fluence        CPL   7.88e-07  1.02e-06  8.82e-07  8.88e-07  3.09e-06  3.58e-06   erg/cm2
      90%_error_low -7.49e-08    N/A    -1.00e-07 -4.79e-07 -2.50e-07    N/A      erg/cm2
      90%_error_hi   6.70e-08    N/A     9.59e-08  9.70e-07  2.35e-07    N/A      erg/cm2
Peak flux      CPL   4.89e-01  4.58e-01  1.75e-01  2.40e-02  1.14e+00  1.15e+00   ph/cm2/s
      90%_error_low -1.43e-01 -1.02e-01 -8.03e-02 -2.40e-02 -2.16e-01 -2.18e-01   ph/cm2/s
      90%_error_hi   1.44e-01  1.09e-01  7.19e-02  1.09e-01  2.17e-01  2.23e-01   ph/cm2/s

======================================================================
Image
Pre-slew 15.0-350.0 keV image (Event data)
#   RAcent    DECcent   POSerr    Theta     Phi              Peak Cts       SNR   Name
   20.3716    -0.6788   0.0163    25.6685   138.0088         7.5820278     11.803 TRIG_00670793

Foreground time interval of the image:
-60.000 113.000 (delta_t = 173.000 [sec])
Background time interval of the image:
-78.099 -60.000 (delta_t =  18.099 [sec])
Light Curves
Note: The mask-weighted lightcurves have units of either count/det or counts/sec/det, where a det is 0.4 x 0.4 = 0.16 sq cm.
Full-time range; 1 s binning
Other quick-look light curves:
- 64 ms binning (zoomed)
- 16 ms binning (zoomed)
- 8 ms binning (zoomed)
- 2 ms binning (zoomed)
- SN=5 or 10 s binning (full-time range)
- Raw light curve
Spectra
- 64 ms binning (zoomed)
- 16 ms binning (zoomed)
- 8 ms binning (zoomed)
- 2 ms binning (zoomed)
- SN=5 or 10 s binning (full-time range)
- Raw light curve
Spectra
Notes:
- 1) The fitting includes the systematic errors.
- 2) When the burst includes telescope slew time periods, the fitting uses an average response file made from multiple 5-s response files through out the slew time plus single time preiod for the non-slew times, and weighted by the total counts in the corresponding time period using addrmf. An average response file is needed becuase a spectral fit using the pre-slew DRM will introduce some errors in both a spectral shape and a normalization if the PHA file contains a lot of the slew/post-slew time interval.
- 3) For fits to more complicated models (e.g. a power-law over a cutoff power-law), the BAT team has decided to require a chi-square improvement of more than 6 for each extra dof.
Time averaged spectrum fit using the average DRM
Power-law model
Time interval is from  -60.000 sec. to  113.000 sec.

Spectral model in power-law:
------------------------------------------------------------
Parameters  : value       lower 90%   higher 90%
Photon index: -2.15358     ( -0.114852   0.111794 )
Norm@50keV  : 1.96650E-03    ( -0.000140414   0.000138615 )
------------------------------------------------------------
#Fit statistic : Chi-Squared =          63.70 using 59 PHA bins.
# Reduced chi-squared =          1.118 for     57 degrees of freedom
# Null hypothesis probability =   2.526412e-01

Photon flux (15-150 keV)    in 173 sec: 0.317849 ( -0.017963  0.017989 ) ph/cm2/s
Energy fluence (15-150 keV)             : 3.17991e-06 ( -1.99846e-07  2.02029e-07 ) ergs/cm2
Cutoff power-law model
Time interval is from  -60.000 sec. to  113.000 sec.
Spectral model in the cutoff power-law:
------------------------------------------------------------
Parameters  : value       lower 90%   higher 90%
Photon index: -1.93214     ( 1.99494   1.99494 )
Epeak [keV] : 12.6147      ( -11.1173 32.5864 )
Norm@50keV  : 2.64057E-03    ( -0.000486236   0.00238342 )
------------------------------------------------------------
#Fit statistic : Chi-Squared =          62.85 using 59 PHA bins.
# Reduced chi-squared =          1.122 for     56 degrees of freedom
# Null hypothesis probability =   2.467039e-01

Photon flux (15-150 keV)    in 173 sec: 0.317558 ( -0.01783  0.009683 ) ph/cm2/s
Energy fluence (15-150 keV)             : 3.09497e-06 ( -2.49879e-07  2.34661e-07 ) ergs/cm2
1-s peak spectrum fit
Power-law model
Time interval is from   76.000 sec. to   77.000 sec.

Spectral model in power-law:
------------------------------------------------------------
Parameters  : value       lower 90%   higher 90%
Photon index: -2.05606     ( -0.345396   0.310593 )
Norm@50keV  : 7.58110E-03    ( -0.00185723   0.00180243 )
------------------------------------------------------------
#Fit statistic : Chi-Squared =          70.29 using 59 PHA bins.
# Reduced chi-squared =          1.233 for     57 degrees of freedom
# Null hypothesis probability =   1.111157e-01

Photon flux (15-150 keV)    in 1 sec: 1.16765 ( -0.216935  0.21683 ) ph/cm2/s
Energy fluence (15-150 keV)             : 7.01843e-08 ( -1.55645e-08  1.60897e-08 ) ergs/cm2
Cutoff power-law model
Time interval is from   76.000 sec. to   77.000 sec.
Spectral model in the cutoff power-law:
------------------------------------------------------------
Parameters  : value       lower 90%   higher 90%
Photon index: -0.68448     ( -1.3349   2.02823 )
Epeak [keV] : 37.7416      ( -31.339 30.6903 )
Norm@50keV  : 5.09811E-02    ( -0.0510202   0.933175 )
------------------------------------------------------------
#Fit statistic : Chi-Squared =          67.46 using 59 PHA bins.
# Reduced chi-squared =          1.205 for     56 degrees of freedom
# Null hypothesis probability =   1.402910e-01

Photon flux (15-150 keV)    in 1 sec: 1.14225 ( -0.215671  0.21686 ) ph/cm2/s
Energy fluence (15-150 keV)             : 6.31815e-08 ( -1.50122e-08  1.70306e-08 ) ergs/cm2
Time-resolved spectra
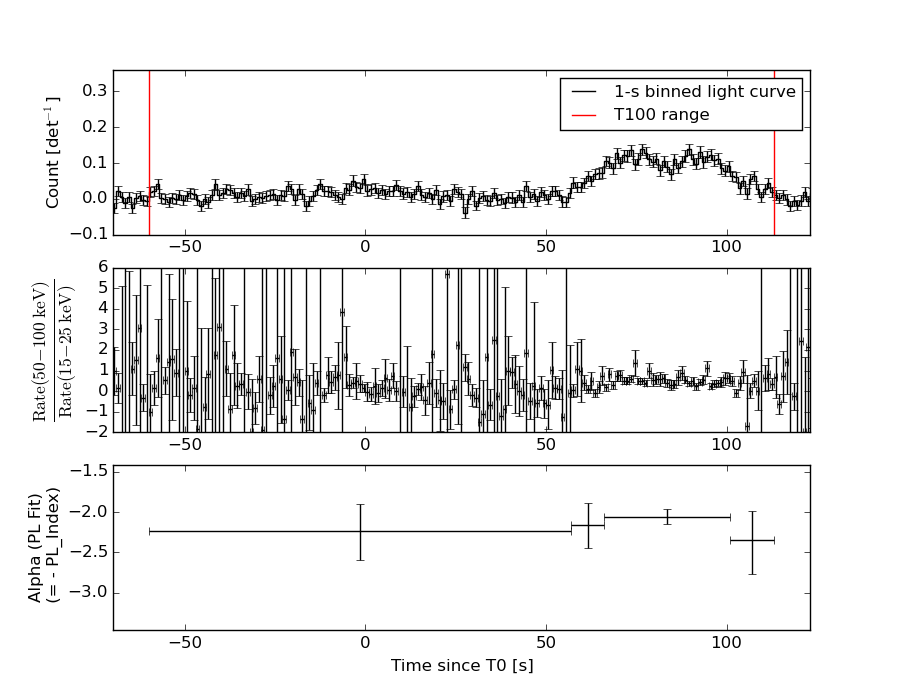
Distribution
T90 vs. Hardness ratio plot
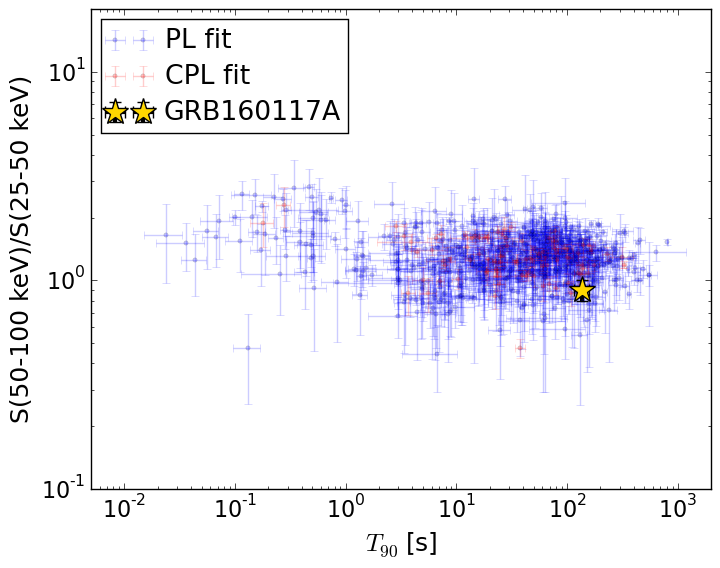
T90                                   = 137.0 sec.
Hardness ratio (energy fluence ratio) = 0.899062678938
S(15-50 keV) vs. S(50-150 keV) plot
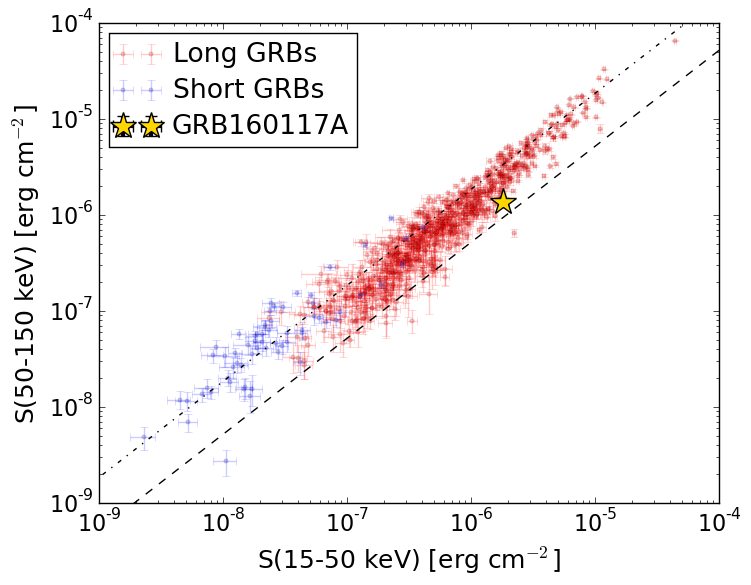
S(15-50 keV)  = 1.8022561e-06
S(50-150 keV) = 1.3776782e-06
The dash-dotted line and the dashed line traces the fluences calculated from the Band function with Epeak = 15 and 150 keV, respectively. Both lines assume a canonical values of alpha = -1 and beta = -2.5.
Mask shadow pattern
IMX = -3.571980691060386E-01, IMY = -3.215230073956977E-01
Spacecraft aspect plot
Bright source in the pre-burst/pre-slew/post-slew images
Pre-burst image of 15-350 keV band
Time interval of the image:
-78.099400 -60.000000

# RAcent  DECcent POSerr Theta    Phi  PeakCts   SNR AngSep     Name
#  [deg]    [deg]    ['] [deg]  [deg]                   [']
299.6348  35.1820    3.0  59.6  -14.6   1.1296   3.8    2.5	Cyg X-1
308.1146  41.0065   11.9  55.6   -5.3   0.1630   1.0    3.2	Cyg X-3
326.2110  38.1489    5.5  42.7    2.6  -0.1763  -2.1   10.5	Cyg X-2
 39.2215  -4.8048    2.3  44.9  138.3   0.9021   4.9 ------	UNKNOWN
  4.1964  33.3539    2.2  30.0   51.9   0.4161   5.3 ------	UNKNOWN
352.8471   9.0743    2.2   5.1    9.2   0.2323   5.3 ------	UNKNOWN
314.1982  40.9774    2.5  51.7   -2.4   0.5207   4.7 ------	UNKNOWN
Pre-slew background subtracted image of 15-350 keV band
Time interval of the image:
-60.000000 113.000000

# RAcent  DECcent POSerr Theta    Phi  PeakCts   SNR AngSep     Name
#  [deg]    [deg]    ['] [deg]  [deg]                   [']
299.6700  35.1537    4.3  59.5  -14.7  -7.9790  -2.7    4.9	Cyg X-1
308.1148  41.0018    9.5  55.6   -5.3  -2.0374  -1.2    3.0	Cyg X-3
326.1680  38.2254    5.9  42.8    2.6   1.6186   2.0    5.8	Cyg X-2
 34.8941  15.4269    2.3  40.5  108.3   9.6238   5.0 ------	UNKNOWN
 27.8268   4.8918    2.4  32.5  124.9   4.0856   4.7 ------	UNKNOWN
344.0986  42.9468    2.2  39.6   24.0   4.2472   5.2 ------	UNKNOWN
 20.3716  -0.6788    1.0  25.7  138.0   7.5803  11.8 ------	UNKNOWN
343.9522  27.7442    2.4  25.5   13.1   2.6456   4.8 ------	UNKNOWN
312.3906  -4.0609    2.4  43.7  -64.0   8.9568   4.9 ------	UNKNOWN
336.2469 -37.1467    2.5  45.3 -121.8   8.7873   4.5 ------	UNKNOWN
Post-slew image of 15-350 keV band
Time interval of the image:
253.900600 1029.169300

# RAcent  DECcent POSerr Theta    Phi  PeakCts   SNR AngSep     Name
#  [deg]    [deg]    ['] [deg]  [deg]                   [']
170.6778 -60.5293    0.0  44.9  165.5  -1.7363  -1.2   12.1	Cen X-3
186.5920 -62.7400    3.0  43.5  176.6   4.4276   3.9    2.5	GX 301-2
154.8114 -52.9721    3.1  50.7  152.1  10.7602   3.7 ------	UNKNOWN
 42.8593 -35.5971    2.6  40.7   38.8   5.0185   4.4 ------	UNKNOWN
190.5986 -50.8758    3.5  55.5  179.0  10.1473   3.3 ------	UNKNOWN
192.7880 -52.1777    3.9  54.2 -179.4   7.1329   3.0 ------	UNKNOWN
194.1276 -72.2002    3.1  34.2 -178.4   2.5797   3.7 ------	UNKNOWN
202.9381 -48.4534    2.7  57.7 -171.4  13.3818   4.2 ------	UNKNOWN
280.5070 -50.9410    3.5  42.7 -110.5   8.2987   3.3 ------	UNKNOWN