Analysis Summary
Notes:
- 1) No attempt has been made to eliminate the non-significant decimal places.
- 2) This batgrbproduct analysis is done using the HEASARC data.
- 3) This batgrbproduct analysis is using the flight position for the mask-weighting calculation.
======================================================================
BAT GRB EVENT DATA PROCESSING REPORT
Process Script Ver: batgrbproduct v2.46
Process Start Time: Thu Mar 17 19:01:50 EDT 2016
Host Name: bat1
Current Working Dir: /local/data/bat1/alien/Swift_3rdBATcatalog/event/batevent_reproc/trigger670800
======================================================================
Trigger: 00670800 Segment: 000
BAT Trigger Time: 474731983.36 [s; MET]
Trigger Stop: 474731984.384 [s; MET]
UTC: 2016-01-17T13:59:27.649320 [includes UTCF correction]
Where From?: TDRSS position message
BAT
RA: 132.190488716105 Dec: -16.3400348873399 [deg; J2000]
Catalogged Source?: NO
Point Source?: YES
GRB Indicated?: YES [ by BAT flight software ]
Image S/N Ratio: 7.06
Image Trigger?: NO
Rate S/N Ratio: 11.4455231422596 [ if not an image trigger ]
Image S/N Ratio: 7.06
Analysis Position: [ source = BAT ]
RA: 132.190488716105 Dec: -16.3400348873399 [deg; J2000]
Refined Position: [ source = BAT pre-slew burst ]
RA: 132.170487312476 Dec: -16.3432403732475 [deg; J2000]
{ 08h 48m 40.9s , -16d 20' 35.7" }
+/- 1.46484935781316 [arcmin] (estimated 90% radius based on SNR)
+/- 0.52363524188656 [arcmin] (formal 1-sigma fit error)
SNR: 17.630770291536
Angular difference between the analysis and refined position is 1.167552 arcmin
Partial Coding Fraction: 0.9375 [ including projection effects ]
Duration
T90: 11.5359999537468 +/- 2.60802764034251
Measured from: 0.367999970912933
to: 11.9039999246597 [s; relative to TRIGTIME]
T50: 3.05199992656708 +/- 2.28039291133579
Measured from: 2.05199998617172
to: 5.1039999127388 [s; relative to TRIGTIME]
Fluence
Peak Flux (peak 1 second)
Measured from: 2.17199999094009
to: 3.17199999094009 [s; relative to TRIGTIME]
Total Fluence
Measured from: 0.0199999809265137
to: 14.472000002861 [s; relative to TRIGTIME]
Band 1 Band 2 Band 3 Band 4
15-25 25-50 50-100 100-350 keV
Total 0.319477 0.283244 0.114536 0.006300
0.025141 0.025535 0.021227 0.018047 [error]
Peak 0.083649 0.086467 0.036505 0.007199
0.007572 0.007853 0.006098 0.004590 [error]
[ fluence units of on-axis counts / fully illuminated detector ]
======================================================================
====== Table of the duration information =============================
Value tstart tstop
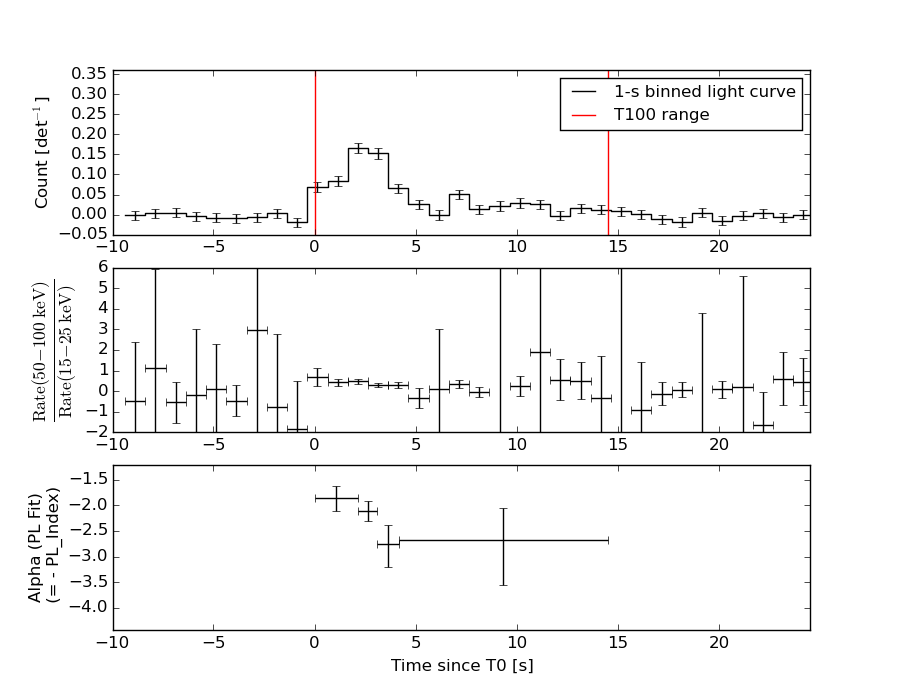
T100 14.452 0.020 14.472
T90 11.536 0.368 11.904
T50 3.052 2.052 5.104
Peak 1.000 2.172 3.172
====== Spectral Analysis Summary =====================================
Model : spectral model: simple power-law (PL) and cutoff power-law (CPL)
Ph_index : photon index: E^{Ph_index}
Ph_90err : 90% error of the photon index
Epeak : Epeak in keV
Epeak_90err: 90% error of Epeak
Norm : normalization at 50 keV in both the PL model and CPL model
Nomr_90err : 90% error of the normalization
chi2 : Chi-Squared
dof : degree of freedo
=== Time-averaged spectral analysis ===
(Best model with acceptable fit: PL)
Model Ph_index Ph_90err_low Ph_90err_hi Epeak Epeak_90err_low Epeak_90err_hi Norm Nomr_90err_low Norm_90err_hi chi2 dof
PL -2.285 -0.219 0.204 - - - 2.45e-03 -3.76e-04 3.69e-04 52.280 57
CPL -1.778 -0.219 1.099 16.149 -15.591 23.598 5.08e-03 -5.08e-03 2.05e-02 51.240 56
=== 1-s peak spectral analysis ===
(Best model with acceptable fit: PL)
Model Ph_index Ph_90err_low Ph_90err_hi Epeak Epeak_90err_low Epeak_90err_hi Norm Nomr_90err_low Norm_90err_hi chi2 dof
PL -2.026 -0.196 0.186 - - - 1.14e-02 -1.50e-03 1.47e-03 65.300 57
CPL -1.437 -0.698 1.150 38.142 N/A N/A 2.56e-02 N/A N/A 63.920 56
=== Fluence/Peak Flux Summary ===
Model Band1 Band2 Band3 Band4 Band5 Total
15-25 25-50 50-100 100-350 15-150 15-350 keV
Fluence PL 9.51e-08 1.09e-07 8.92e-08 1.23e-07 3.38e-07 4.16e-07 erg/cm2
90%_error_low -1.24e-08 -1.17e-08 -1.83e-08 -4.24e-08 -4.20e-08 -6.80e-08 erg/cm2
90%_error_hi 1.26e-08 1.16e-08 1.92e-08 5.58e-08 4.32e-08 7.81e-08 erg/cm2
Peak flux PL 7.78e-01 5.75e-01 2.82e-01 1.97e-01 1.73e+00 1.83e+00 ph/cm2/s
90%_error_low -1.12e-01 -5.92e-02 -4.82e-02 -5.74e-02 -1.78e-01 -1.89e-01 ph/cm2/s
90%_error_hi 1.15e-01 5.91e-02 4.89e-02 7.02e-02 1.78e-01 1.89e-01 ph/cm2/s
Fluence CPL 9.29e-08 1.15e-07 8.24e-08 4.39e-08 3.17e-07 3.34e-07 erg/cm2
90%_error_low -1.32e-08 -1.36e-08 -2.59e-08 -3.62e-08 -4.92e-08 -6.45e-08 erg/cm2
90%_error_hi 1.25e-08 1.62e-08 2.27e-08 8.87e-08 5.12e-08 1.08e-07 erg/cm2
Peak flux CPL 7.46e-01 6.18e-01 2.75e-01 8.39e-02 1.70e+00 1.72e+00 ph/cm2/s
90%_error_low -1.24e-01 -8.40e-02 -6.39e-02 -8.39e-02 -1.84e-01 -2.00e-01 ph/cm2/s
90%_error_hi 1.24e-01 9.13e-02 5.47e-02 1.66e-01 1.83e-01 2.44e-01 ph/cm2/s
======================================================================
Image
Pre-slew 15.0-350.0 keV image (Event data)
#   RAcent    DECcent   POSerr    Theta     Phi              Peak Cts       SNR   Name
  132.1705   -16.3432   0.0109    12.3190   124.3787         0.6975210     17.631 TRIG_00670800

Foreground time interval of the image:
  0.020  10.941 (delta_t =  10.921 [sec])
Background time interval of the image:
-728.859 -709.246 (delta_t =  19.613 [sec])
-239.360   0.020 (delta_t = 239.380 [sec])
Light Curves
Note: The mask-weighted lightcurves have units of either count/det or counts/sec/det, where a det is 0.4 x 0.4 = 0.16 sq cm.
Full-time range; 1 s binning
Other quick-look light curves:
- 64 ms binning (zoomed)
- 16 ms binning (zoomed)
- 8 ms binning (zoomed)
- 2 ms binning (zoomed)
- SN=5 or 10 s binning (full-time range)
- Raw light curve
Spectra
- 64 ms binning (zoomed)
- 16 ms binning (zoomed)
- 8 ms binning (zoomed)
- 2 ms binning (zoomed)
- SN=5 or 10 s binning (full-time range)
- Raw light curve
Spectra
Notes:
- 1) The fitting includes the systematic errors.
- 2) When the burst includes telescope slew time periods, the fitting uses an average response file made from multiple 5-s response files through out the slew time plus single time preiod for the non-slew times, and weighted by the total counts in the corresponding time period using addrmf. An average response file is needed becuase a spectral fit using the pre-slew DRM will introduce some errors in both a spectral shape and a normalization if the PHA file contains a lot of the slew/post-slew time interval.
- 3) For fits to more complicated models (e.g. a power-law over a cutoff power-law), the BAT team has decided to require a chi-square improvement of more than 6 for each extra dof.
Time averaged spectrum fit using the average DRM
Power-law model
Time interval is from    0.020 sec. to   14.472 sec.

Spectral model in power-law:
------------------------------------------------------------
Parameters  : value       lower 90%   higher 90%
Photon index: -2.28512     ( -0.218687   0.203745 )
Norm@50keV  : 2.45111E-03    ( -0.000375634   0.000369281 )
------------------------------------------------------------
#Fit statistic : Chi-Squared =          52.28 using 59 PHA bins.
# Reduced chi-squared =         0.9173 for     57 degrees of freedom
# Null hypothesis probability =   6.523348e-01

Photon flux (15-150 keV)    in 14.45 sec: 0.424883 ( -0.042257  0.042257 ) ph/cm2/s
Energy fluence (15-150 keV)             : 3.37627e-07 ( -4.19499e-08  4.32175e-08 ) ergs/cm2
Cutoff power-law model
Time interval is from    0.020 sec. to   14.472 sec.
Spectral model in the cutoff power-law:
------------------------------------------------------------
Parameters  : value       lower 90%   higher 90%
Photon index: -1.77786     ( -0.22099   1.09698 )
Epeak [keV] : 16.1491      ( -15.6995 23.4895 )
Norm@50keV  : 5.07737E-03    ( -0.00510034   0.0204349 )
------------------------------------------------------------
#Fit statistic : Chi-Squared =          51.24 using 59 PHA bins.
# Reduced chi-squared =         0.9150 for     56 degrees of freedom
# Null hypothesis probability =   6.552671e-01

Photon flux (15-150 keV)    in 14.45 sec: 0.417151 ( -0.043925  0.043803 ) ph/cm2/s
Energy fluence (15-150 keV)             : 3.17299e-07 ( -4.92414e-08  5.12268e-08 ) ergs/cm2
1-s peak spectrum fit
Power-law model
Time interval is from    2.172 sec. to    3.172 sec.

Spectral model in power-law:
------------------------------------------------------------
Parameters  : value       lower 90%   higher 90%
Photon index: -2.02596     ( -0.195725   0.185595 )
Norm@50keV  : 1.13811E-02    ( -0.00150172   0.0014686 )
------------------------------------------------------------
#Fit statistic : Chi-Squared =          65.30 using 59 PHA bins.
# Reduced chi-squared =          1.146 for     57 degrees of freedom
# Null hypothesis probability =   2.105032e-01

Photon flux (15-150 keV)    in 1 sec: 1.72800 ( -0.17787  0.17791 ) ph/cm2/s
Energy fluence (15-150 keV)             : 1.05133e-07 ( -1.28355e-08  1.3065e-08 ) ergs/cm2
Cutoff power-law model
Time interval is from    2.172 sec. to    3.172 sec.
Spectral model in the cutoff power-law:
------------------------------------------------------------
Parameters  : value       lower 90%   higher 90%
Photon index: -1.43742     ( -0.700244   1.14861 )
Epeak [keV] : 38.1416      (   )
Norm@50keV  : 2.55914E-02    (     )
------------------------------------------------------------
#Fit statistic : Chi-Squared =          63.92 using 59 PHA bins.
# Reduced chi-squared =          1.141 for     56 degrees of freedom
# Null hypothesis probability =   2.183001e-01

Photon flux (15-150 keV)    in 1 sec: 1.69676 ( -0.18444  0.18347 ) ph/cm2/s
Energy fluence (15-150 keV)             : 0 ( 0  0 ) ergs/cm2
Time-resolved spectra
Distribution
T90 vs. Hardness ratio plot
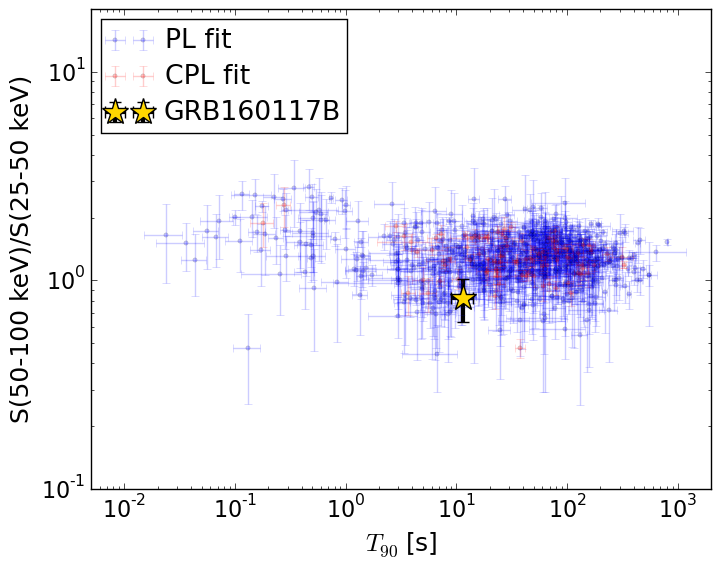
T90                                   = 11.536 sec.
Hardness ratio (energy fluence ratio) = 0.820710627312
S(15-50 keV) vs. S(50-150 keV) plot
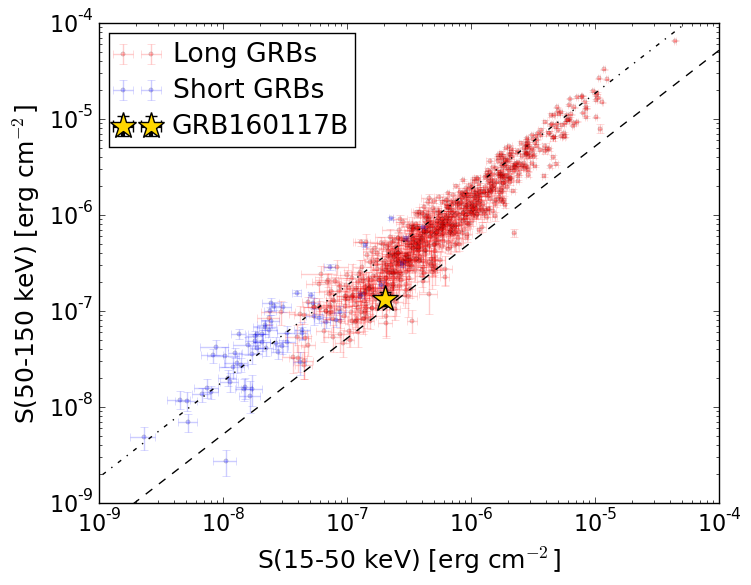
S(15-50 keV)  = 2.0380744e-07
S(50-150 keV) = 1.3382148e-07
The dash-dotted line and the dashed line traces the fluences calculated from the Band function with Epeak = 15 and 150 keV, respectively. Both lines assume a canonical values of alpha = -1 and beta = -2.5.
Mask shadow pattern
IMX = -1.233120555355369E-01, IMY = -1.802365736885335E-01
Spacecraft aspect plot
Bright source in the pre-burst/pre-slew/post-slew images
Pre-burst image of 15-350 keV band
Time interval of the image:
-728.859370 -709.246000
-239.360000 0.020000

# RAcent  DECcent POSerr Theta    Phi  PeakCts   SNR AngSep     Name
#  [deg]    [deg]    ['] [deg]  [deg]                   [']
135.4825 -40.5198    1.9  13.0  -87.0   1.4148   6.1    3.0	Vela X-1
 87.7110 -15.2716    3.4  40.9   32.8   1.7018   3.4 ------	UNKNOWN
178.1922  -0.4007    3.5  54.1 -179.4   3.2221   3.3 ------	UNKNOWN
113.0676 -43.6030    2.6  20.2  -30.0   1.0636   4.4 ------	UNKNOWN
188.2774 -11.3236    3.2  57.1 -161.7   4.3225   3.6 ------	UNKNOWN
190.7842 -12.5442    3.4  58.8 -159.2   6.2800   3.4 ------	UNKNOWN
Pre-slew background subtracted image of 15-350 keV band
Time interval of the image:
0.020000 10.940600

# RAcent  DECcent POSerr Theta    Phi  PeakCts   SNR AngSep     Name
#  [deg]    [deg]    ['] [deg]  [deg]                   [']
135.4177 -40.6336    6.7  13.1  -86.6  -0.0744  -1.7    6.9	Vela X-1
159.4470   2.1045    2.5  41.8  161.2   0.3792   4.6 ------	UNKNOWN
132.1712 -16.3427    0.7  12.3  124.4   0.6954  17.6 ------	UNKNOWN
168.6909  -7.9452    2.2  42.1 -178.4   0.3491   5.2 ------	UNKNOWN
 69.3943 -51.7204    2.8  49.9  -22.2   0.3701   4.2 ------	UNKNOWN
140.2822 -68.2415    2.1  40.3  -73.0   0.7187   5.5 ------	UNKNOWN
Post-slew image of 15-350 keV band
Time interval of the image:
44.140620 838.585900
840.640000 962.680000

# RAcent  DECcent POSerr Theta    Phi  PeakCts   SNR AngSep     Name
#  [deg]    [deg]    ['] [deg]  [deg]                   [']
135.4329 -40.5418    1.8  24.3  -76.0   4.7432   6.5    4.4	Vela X-1
 92.4733  -4.0935    2.8  40.9   33.0   4.4669   4.1 ------	UNKNOWN
 79.2750 -18.5847    3.1  50.3    9.1   5.3358   3.8 ------	UNKNOWN
164.3697  -3.6151    2.8  34.1 -178.5   3.0126   4.2 ------	UNKNOWN
159.9292 -32.0413    2.9  29.6 -123.0   2.9901   3.9 ------	UNKNOWN
170.4299 -44.4805    3.3  42.7 -110.7  10.1817   3.5 ------	UNKNOWN