Analysis Summary
Notes:
- 1) No attempt has been made to eliminate the non-significant decimal places.
- 2) This batgrbproduct analysis is done using the HEASARC data.
- 3) This batgrbproduct analysis is using the flight position for the mask-weighting calculation.
======================================================================
                  BAT GRB EVENT DATA PROCESSING REPORT
    Process Script Ver: batgrbproduct v2.46
    Process Start Time: Thu Mar 17 18:56:23 EDT 2016
             Host Name: bat1
   Current Working Dir: /local/data/bat1/alien/Swift_3rdBATcatalog/event/batevent_reproc/trigger671231
======================================================================

  Trigger: 00671231      Segment: 000

  BAT Trigger Time: 475077053.44   [s; MET]
      Trigger Stop: 475077054.464   [s; MET]
               UTC: 2016-01-21T13:50:37.710700    [includes UTCF correction]
       Where From?: TDRSS position message

  BAT
    RA: 109.079402870934   Dec: -23.578027813169  [deg; J2000]

     Catalogged Source?: NO
     Point Source?:      YES
     GRB Indicated?:     YES    [ by BAT flight software ]
     Image S/N Ratio:    7.25
     Image Trigger?:     NO
     Rate S/N Ratio:     10.0498756211209  [ if not an image trigger ]
     Image S/N Ratio:    7.25

  Analysis Position:   [ source = BAT ]
    RA: 109.079402870934   Dec: -23.578027813169  [deg; J2000]

  Refined Position:   [ source = BAT pre-slew burst ]
    RA: 109.079812152495   Dec: -23.5893503749617  [deg; J2000]
        { 07h 16m 19.2s , -23d 35' 21.7" }
         +/- 1.17275275416007 [arcmin] (estimated 90% radius based on SNR)
         +/- 0.411298150496529 [arcmin] (formal 1-sigma fit error)
    SNR: 24.2243429542839

  Angular difference between the analysis and refined position is 0.679726 arcmin

  Partial Coding Fraction: 0.9140625    [ including projection effects ]

  Duration
     T90: 10.4999999403954 +/- 2.39561683996151
        Measured from: 0.523999989032745
                   to: 11.0239999294281     [s; relative to TRIGTIME]
     T50: 4.30399996042252 +/- 0.967803687827393
        Measured from: 2.55199998617172
                   to: 6.85599994659424     [s; relative to TRIGTIME]


  Fluence
     Peak Flux  (peak 1 second)
        Measured from: 2.75999999046326
                   to: 3.75999999046326     [s; relative to TRIGTIME]
     Total Fluence
        Measured from: -0.0279999971389771
                   to: 14.972000002861     [s; relative to TRIGTIME]

             Band 1     Band 2     Band 3     Band 4
              15-25      25-50     50-100    100-350     keV
 Total     0.348553   0.427871   0.258776   0.067168
           0.026279   0.027357   0.022702   0.018452 [error]
 Peak      0.046871   0.061395   0.029918   0.008352
           0.007109   0.007479   0.006098   0.005095 [error]

     [ fluence units of on-axis counts / fully illuminated detector ]

======================================================================


====== Table of the duration information =============================

        Value   tstart    tstop
T100   15.000   -0.028   14.972
T90    10.500    0.524   11.024
T50     4.304    2.552    6.856
Peak    1.000    2.760    3.760


====== Spectral Analysis Summary =====================================

Model      : spectral model: simple power-law (PL) and cutoff power-law (CPL)
Ph_index   : photon index: E^{Ph_index}
Ph_90err   : 90% error of the photon index
Epeak      : Epeak in keV
Epeak_90err: 90% error of Epeak
Norm       : normalization at 50 keV in both the PL model and CPL model
Nomr_90err : 90% error of the normalization
chi2       : Chi-Squared
dof        : degree of freedo

=== Time-averaged spectral analysis ===
(Best model with acceptable fit: PL)

Model Ph_index Ph_90err_low Ph_90err_hi  Epeak  Epeak_90err_low  Epeak_90err_hi  Norm       Nomr_90err_low    Norm_90err_hi    chi2    dof
PL      -1.773    -0.131      0.129       -           -               -         4.43e-03     -3.64e-04          3.60e-04      46.640   57
CPL     -1.046    -0.549      0.629       59.583     -11.261        44.854      1.10e-02     -5.39e-03          1.30e-02      41.350   56


=== 1-s peak spectral analysis ===
(Best model with acceptable fit: PL)

Model Ph_index Ph_90err_low Ph_90err_hi  Epeak  Epeak_90err_low  Epeak_90err_hi  Norm       Nomr_90err_low    Norm_90err_hi    chi2    dof
PL      -1.820     -0.258     0.244       -           -               -         8.47e-03     -1.47e-03          1.43e-03      56.250   57
CPL     -0.929     -1.008     1.369       51.480     -15.341       -51.480      2.74e-02     -2.74e-02          1.41e-01      54.160   56


=== Fluence/Peak Flux Summary ===

              Model    Band1     Band2     Band3     Band4     Band5     Total
                       15-25     25-50    50-100    100-350    15-150    15-350    keV
Fluence         PL   1.10e-07  1.71e-07  2.00e-07  4.52e-07  6.13e-07  9.32e-07   erg/cm2
      90%_error_low -1.23e-08 -1.26e-08 -2.19e-08 -9.36e-08 -5.15e-08 -1.16e-07   erg/cm2
      90%_error_hi   1.26e-08  1.26e-08  2.20e-08  1.09e-07  5.20e-08  1.28e-07   erg/cm2
Peak flux       PL   4.74e-01  3.95e-01  2.24e-01  1.88e-01  1.18e+00  1.28e+00   ph/cm2/s
      90%_error_low -9.73e-02 -5.76e-02 -4.93e-02 -6.87e-02 -1.72e-01 -1.90e-01   ph/cm2/s
      90%_error_hi   1.01e-01  5.76e-02  4.97e-02  8.88e-02  1.72e-01  1.91e-01   ph/cm2/s

Fluence        CPL   1.00e-07  1.85e-07  2.01e-07  1.55e-07  5.75e-07  6.42e-07   erg/cm2
      90%_error_low -1.43e-08 -1.67e-08 -2.46e-08 -8.00e-08 -5.72e-08 -9.90e-08   erg/cm2
      90%_error_hi   1.44e-08  1.71e-08  2.43e-08  1.80e-07  5.85e-08  1.85e-07   erg/cm2
Peak flux      CPL   4.36e-01  4.41e-01  2.26e-01  6.41e-02  1.15e+00  1.17e+00   ph/cm2/s
      90%_error_low -1.12e-01 -7.87e-02 -5.90e-02 -6.41e-02 -1.74e-01 -1.84e-01   ph/cm2/s
      90%_error_hi   1.12e-01  8.35e-02  5.63e-02  1.52e-01  1.74e-01  2.11e-01   ph/cm2/s

======================================================================
Image
Pre-slew 15.0-350.0 keV image (Event data)
#   RAcent    DECcent   POSerr    Theta     Phi              Peak Cts       SNR   Name
  109.0798   -23.5894   0.0079    22.8322     7.7037         1.0218882     24.224 TRIG_00671231

Foreground time interval of the image:
 -0.028  11.061 (delta_t =  11.089 [sec])
Background time interval of the image:
-239.440  -0.028 (delta_t = 239.412 [sec])
Light Curves
Note: The mask-weighted lightcurves have units of either count/det or counts/sec/det, where a det is 0.4 x 0.4 = 0.16 sq cm.
Full-time range; 1 s binning
Other quick-look light curves:
- 64 ms binning (zoomed)
- 16 ms binning (zoomed)
- 8 ms binning (zoomed)
- 2 ms binning (zoomed)
- SN=5 or 10 s binning (full-time range)
- Raw light curve
Spectra
- 64 ms binning (zoomed)
- 16 ms binning (zoomed)
- 8 ms binning (zoomed)
- 2 ms binning (zoomed)
- SN=5 or 10 s binning (full-time range)
- Raw light curve
Spectra
Notes:
- 1) The fitting includes the systematic errors.
- 2) When the burst includes telescope slew time periods, the fitting uses an average response file made from multiple 5-s response files through out the slew time plus single time preiod for the non-slew times, and weighted by the total counts in the corresponding time period using addrmf. An average response file is needed becuase a spectral fit using the pre-slew DRM will introduce some errors in both a spectral shape and a normalization if the PHA file contains a lot of the slew/post-slew time interval.
- 3) For fits to more complicated models (e.g. a power-law over a cutoff power-law), the BAT team has decided to require a chi-square improvement of more than 6 for each extra dof.
Time averaged spectrum fit using the average DRM
Power-law model
Time interval is from   -0.028 sec. to   14.972 sec.

Spectral model in power-law:
------------------------------------------------------------
Parameters  : value       lower 90%   higher 90%
Photon index: -1.77266     ( -0.131438   0.12854 )
Norm@50keV  : 4.43238E-03    ( -0.000363907   0.000360102 )
------------------------------------------------------------
#Fit statistic : Chi-Squared =          46.64 using 59 PHA bins.
# Reduced chi-squared =         0.8183 for     57 degrees of freedom
# Null hypothesis probability =   8.345749e-01

Photon flux (15-150 keV)    in 15 sec: 0.604448 ( -0.045036  0.045072 ) ph/cm2/s
Energy fluence (15-150 keV)             : 6.1286e-07 ( -5.14609e-08  5.20174e-08 ) ergs/cm2
Cutoff power-law model
Time interval is from   -0.028 sec. to   14.972 sec.
Spectral model in the cutoff power-law:
------------------------------------------------------------
Parameters  : value       lower 90%   higher 90%
Photon index: -1.04567     ( -0.549155   0.629082 )
Epeak [keV] : 59.5825      ( -11.261 44.8546 )
Norm@50keV  : 1.10122E-02    ( -0.00538645   0.0129789 )
------------------------------------------------------------
#Fit statistic : Chi-Squared =          41.35 using 59 PHA bins.
# Reduced chi-squared =         0.7383 for     56 degrees of freedom
# Null hypothesis probability =   9.283549e-01

Photon flux (15-150 keV)    in 15 sec: 0.586432 ( -0.047017  0.047012 ) ph/cm2/s
Energy fluence (15-150 keV)             : 5.75124e-07 ( -5.71579e-08  5.85432e-08 ) ergs/cm2
1-s peak spectrum fit
Power-law model
Time interval is from    2.760 sec. to    3.760 sec.

Spectral model in power-law:
------------------------------------------------------------
Parameters  : value       lower 90%   higher 90%
Photon index: -1.81961     ( -0.258038   0.243769 )
Norm@50keV  : 8.46667E-03    ( -0.00146777   0.00143137 )
------------------------------------------------------------
#Fit statistic : Chi-Squared =          56.25 using 59 PHA bins.
# Reduced chi-squared =         0.9868 for     57 degrees of freedom
# Null hypothesis probability =   5.032577e-01

Photon flux (15-150 keV)    in 1 sec: 1.17574 ( -0.17157  0.1716 ) ph/cm2/s
Energy fluence (15-150 keV)             : 7.79094e-08 ( -1.34316e-08  1.37211e-08 ) ergs/cm2
Cutoff power-law model
Time interval is from    2.760 sec. to    3.760 sec.
Spectral model in the cutoff power-law:
------------------------------------------------------------
Parameters  : value       lower 90%   higher 90%
Photon index: -0.929266     ( -1.00837   1.36922 )
Epeak [keV] : 51.4799      ( -15.3408 -51.48 )
Norm@50keV  : 2.73814E-02    ( -0.0273814   0.141013 )
------------------------------------------------------------
#Fit statistic : Chi-Squared =          54.16 using 59 PHA bins.
# Reduced chi-squared =         0.9672 for     56 degrees of freedom
# Null hypothesis probability =   5.446295e-01

Photon flux (15-150 keV)    in 1 sec: 1.15009 ( -0.174238  0.17429 ) ph/cm2/s
Energy fluence (15-150 keV)             : 7.2124e-08 ( -1.40636e-08  1.5145e-08 ) ergs/cm2
Time-resolved spectra
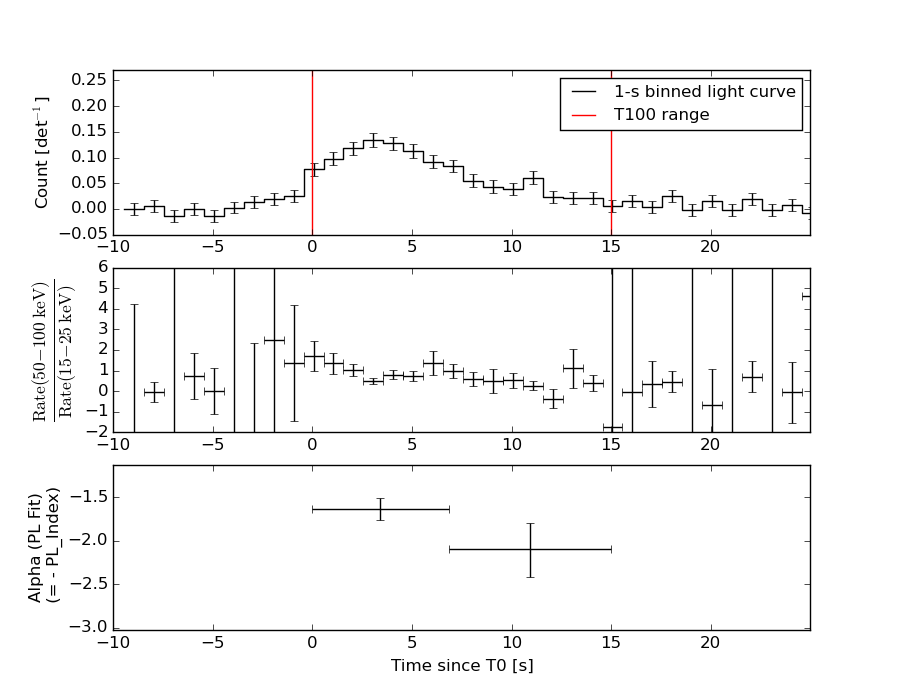
Distribution
T90 vs. Hardness ratio plot
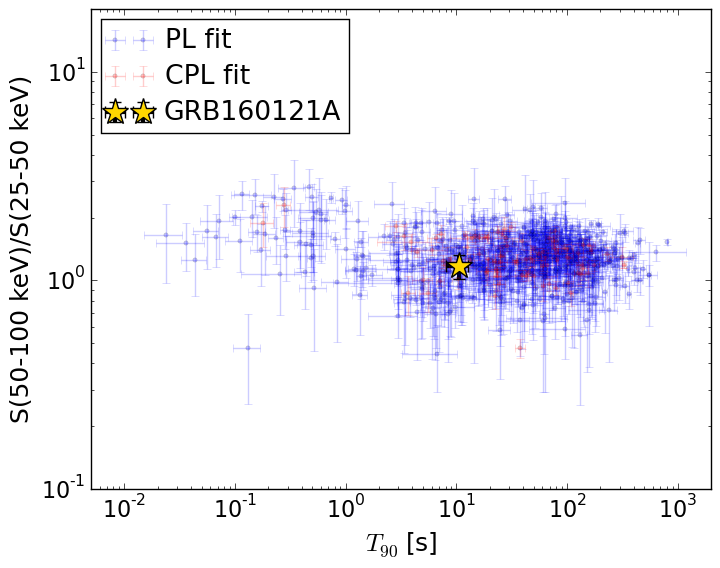
T90                                   = 10.5 sec.
Hardness ratio (energy fluence ratio) = 1.17073911944
S(15-50 keV) vs. S(50-150 keV) plot
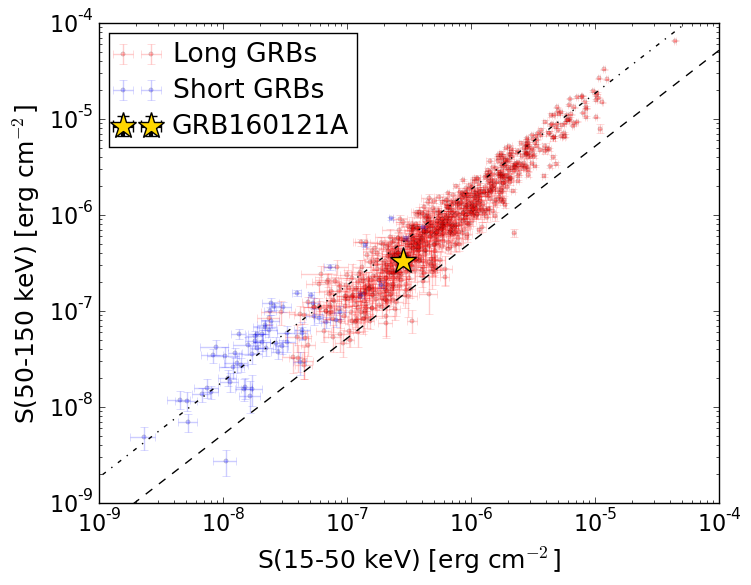
S(15-50 keV)  = 2.805004e-07
S(50-150 keV) = 3.3236e-07
The dash-dotted line and the dashed line traces the fluences calculated from the Band function with Epeak = 15 and 150 keV, respectively. Both lines assume a canonical values of alpha = -1 and beta = -2.5.
Mask shadow pattern
IMX = 4.172220750241890E-01, IMY = -5.643792970956614E-02
Spacecraft aspect plot
Bright source in the pre-burst/pre-slew/post-slew images
Pre-burst image of 15-350 keV band
Time interval of the image:
-239.440000 -0.028000

# RAcent  DECcent POSerr Theta    Phi  PeakCts   SNR AngSep     Name
#  [deg]    [deg]    ['] [deg]  [deg]                   [']
135.5164 -40.5795    1.1  24.4  -66.3   2.6207  10.4    1.6	Vela X-1
162.5867  11.7878    2.4  41.2  168.7   1.7338   4.9 ------	UNKNOWN
 80.1889 -28.9283    2.7  49.2    5.5   1.9781   4.3 ------	UNKNOWN
Pre-slew background subtracted image of 15-350 keV band
Time interval of the image:
-0.028000 11.060590

# RAcent  DECcent POSerr Theta    Phi  PeakCts   SNR AngSep     Name
#  [deg]    [deg]    ['] [deg]  [deg]                   [']
135.3858 -40.4804    3.8  24.3  -66.1  -0.1515  -3.0    7.9	Vela X-1
109.0798 -23.5893    0.5  22.8    7.7   1.0218  24.2 ------	UNKNOWN
161.4984 -13.4709    2.0  28.5 -152.0   0.2617   5.7 ------	UNKNOWN
Post-slew image of 15-350 keV band
Time interval of the image:
73.460610 917.060590

# RAcent  DECcent POSerr Theta    Phi  PeakCts   SNR AngSep     Name
#  [deg]    [deg]    ['] [deg]  [deg]                   [']
135.5243 -40.5478    1.2  27.9 -154.7   5.6172   9.9    0.5	Vela X-1
139.9915   4.2927    3.3  41.0  122.8   7.3291   3.5 ------	UNKNOWN
149.9719  -0.7768    3.6  45.7  137.7   8.3539   3.2 ------	UNKNOWN
 67.1889  11.0802    3.1  53.6   17.1   9.0261   3.7 ------	UNKNOWN
123.0665 -14.4070    3.9  16.1  129.3   1.6720   2.9 ------	UNKNOWN
 55.0781 -23.4851    3.3  49.2  -29.9   4.6834   3.5 ------	UNKNOWN
 51.5758 -34.4127    3.7  50.8  -44.6  11.6018   3.1 ------	UNKNOWN
149.2957 -64.4272    4.9  48.5 -130.3   7.3791   2.4 ------	UNKNOWN
112.6749 -66.1815    2.9  42.7 -110.6  11.7687   4.0 ------	UNKNOWN