Analysis Summary
Notes:
- 1) No attempt has been made to eliminate the non-significant decimal places.
- 2) This batgrbproduct analysis is done using the HEASARC data.
- 3) This batgrbproduct analysis is using the flight position for the mask-weighting calculation.
======================================================================
                  BAT GRB EVENT DATA PROCESSING REPORT
    Process Script Ver: batgrbproduct v2.46
    Process Start Time: Thu Mar 17 18:54:03 EDT 2016
             Host Name: bat1
   Current Working Dir: /local/data/bat1/alien/Swift_3rdBATcatalog/event/batevent_reproc/trigger671447
======================================================================

  Trigger: 00671447      Segment: 000

  BAT Trigger Time: 475232315.904   [s; MET]
      Trigger Stop: 475232316.928   [s; MET]
               UTC: 2016-01-23T08:58:20.166340    [includes UTCF correction]
       Where From?: TDRSS position message

  BAT
    RA: 150.286562972773   Dec: -33.7790721449038  [deg; J2000]

     Catalogged Source?: NO
     Point Source?:      YES
     GRB Indicated?:     YES    [ by BAT flight software ]
     Image S/N Ratio:    8.65
     Image Trigger?:     NO
     Rate S/N Ratio:     16.9115345252878  [ if not an image trigger ]
     Image S/N Ratio:    8.65

  Analysis Position:   [ source = BAT ]
    RA: 150.286562972773   Dec: -33.7790721449038  [deg; J2000]

  Refined Position:   [ source = BAT pre-slew burst ]
    RA: 150.276634862504   Dec: -33.7897251236089  [deg; J2000]
        { 10h 01m 06.4s , -33d 47' 23.0" }
         +/- 1.57196349720789 [arcmin] (estimated 90% radius based on SNR)
         +/- 0.608294588531128 [arcmin] (formal 1-sigma fit error)
    SNR: 15.9399259143936

  Angular difference between the analysis and refined position is 0.808499 arcmin

  Partial Coding Fraction: 0.6875    [ including projection effects ]

  Duration
     T90: 3.95199990272522 +/- 0.623246350817473
        Measured from: -1.27599996328354
                   to: 2.67599993944168     [s; relative to TRIGTIME]
     T50: 2.1159999370575 +/- 0.459077335217155
        Measured from: -0.547999978065491
                   to: 1.567999958992     [s; relative to TRIGTIME]


  Fluence
     Peak Flux  (peak 1 second)
        Measured from: 0.00800001621246338
                   to: 1.00800001621246     [s; relative to TRIGTIME]
     Total Fluence
        Measured from: -2.04799997806549
                   to: 3     [s; relative to TRIGTIME]

             Band 1     Band 2     Band 3     Band 4
              15-25      25-50     50-100    100-350     keV
 Total     0.141867   0.259866   0.143502   0.041699
           0.018826   0.019827   0.016844   0.013425 [error]
 Peak      0.045329   0.071220   0.042797   0.016521
           0.008666   0.009241   0.007887   0.006160 [error]

     [ fluence units of on-axis counts / fully illuminated detector ]

======================================================================


====== Table of the duration information =============================

        Value   tstart    tstop
T100    5.048   -2.048    3.000
T90     3.952   -1.276    2.676
T50     2.116   -0.548    1.568
Peak    1.000    0.008    1.008


====== Spectral Analysis Summary =====================================

Model      : spectral model: simple power-law (PL) and cutoff power-law (CPL)
Ph_index   : photon index: E^{Ph_index}
Ph_90err   : 90% error of the photon index
Epeak      : Epeak in keV
Epeak_90err: 90% error of Epeak
Norm       : normalization at 50 keV in both the PL model and CPL model
Nomr_90err : 90% error of the normalization
chi2       : Chi-Squared
dof        : degree of freedo

=== Time-averaged spectral analysis ===
(Best model with acceptable fit: PL)

Model Ph_index Ph_90err_low Ph_90err_hi  Epeak  Epeak_90err_low  Epeak_90err_hi  Norm       Nomr_90err_low    Norm_90err_hi    chi2    dof
PL      -1.509    -0.162      0.161       -           -               -         7.34e-03     -7.50e-04          7.46e-04      47.720   57
CPL     -0.566    -0.732      0.915       69.615     -16.049        80.821      2.39e-02     -1.42e-02          5.15e-02      42.640   56


=== 1-s peak spectral analysis ===
(Best model with acceptable fit: PL)

Model Ph_index Ph_90err_low Ph_90err_hi  Epeak  Epeak_90err_low  Epeak_90err_hi  Norm       Nomr_90err_low    Norm_90err_hi    chi2    dof
PL      -1.547     -0.264     0.258       -           -               -         1.04e-02     -1.75e-03          1.73e-03      57.050   57
CPL     -0.531     -1.102     1.502       66.898     -19.073       -66.898      3.67e-02     -3.67e-02          1.98e-01      54.710   56


=== Fluence/Peak Flux Summary ===

              Model    Band1     Band2     Band3     Band4     Band5     Total
                       15-25     25-50    50-100    100-350    15-150    15-350    keV
Fluence         PL   4.77e-08  8.72e-08  1.23e-07  3.61e-07  3.51e-07  6.19e-07   erg/cm2
      90%_error_low -7.39e-09 -8.84e-09 -1.60e-08 -8.88e-08 -3.90e-08 -1.04e-07   erg/cm2
      90%_error_hi   7.63e-09  8.81e-09  1.60e-08  1.06e-07  3.94e-08  1.18e-07   erg/cm2
Peak flux       PL   4.47e-01  4.38e-01  3.00e-01  3.22e-01  1.31e+00  1.51e+00   ph/cm2/s
      90%_error_low -1.09e-01 -7.20e-02 -6.28e-02 -1.16e-01 -2.10e-01 -2.44e-01   ph/cm2/s
      90%_error_hi   1.15e-01  7.15e-02  6.25e-02  1.49e-01  2.10e-01  2.47e-01   ph/cm2/s

Fluence        CPL   4.28e-08  9.78e-08  1.25e-07  9.40e-08  3.22e-07  3.59e-07   erg/cm2
      90%_error_low -8.45e-09 -1.21e-08 -1.91e-08 -5.88e-08 -4.47e-08 -7.31e-08   erg/cm2
      90%_error_hi   8.57e-09  1.28e-08  1.84e-08  1.59e-07  4.56e-08  1.60e-07   erg/cm2
Peak flux      CPL   3.91e-01  4.91e-01  3.15e-01  1.08e-01  1.27e+00  1.30e+00   ph/cm2/s
      90%_error_low -1.27e-01 -9.37e-02 -7.40e-02 -1.08e-01 -2.15e-01 -2.34e-01   ph/cm2/s
      90%_error_hi   1.31e-01  9.97e-02  7.33e-02  2.61e-01  2.15e-01  2.98e-01   ph/cm2/s

======================================================================
Image
Pre-slew 15.0-350.0 keV image (Event data)
#   RAcent    DECcent   POSerr    Theta     Phi              Peak Cts       SNR   Name
  150.2766   -33.7897   0.0120    23.8425  -107.2257         0.5670870     15.940 TRIG_00671447

Foreground time interval of the image:
 -2.048   3.000 (delta_t =   5.048 [sec])
Background time interval of the image:
-239.904  -2.048 (delta_t = 237.856 [sec])
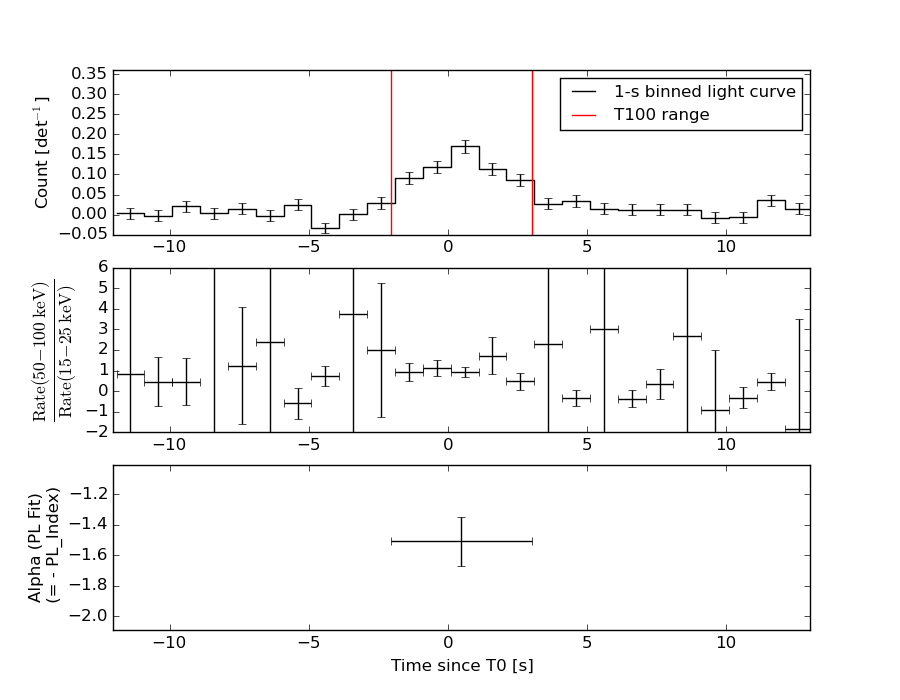
Light Curves
Note: The mask-weighted lightcurves have units of either count/det or counts/sec/det, where a det is 0.4 x 0.4 = 0.16 sq cm.
Full-time range; 1 s binning
Other quick-look light curves:
- 64 ms binning (zoomed)
- 16 ms binning (zoomed)
- 8 ms binning (zoomed)
- 2 ms binning (zoomed)
- SN=5 or 10 s binning (full-time range)
- Raw light curve
Spectra
- 64 ms binning (zoomed)
- 16 ms binning (zoomed)
- 8 ms binning (zoomed)
- 2 ms binning (zoomed)
- SN=5 or 10 s binning (full-time range)
- Raw light curve
Spectra
Notes:
- 1) The fitting includes the systematic errors.
- 2) When the burst includes telescope slew time periods, the fitting uses an average response file made from multiple 5-s response files through out the slew time plus single time preiod for the non-slew times, and weighted by the total counts in the corresponding time period using addrmf. An average response file is needed becuase a spectral fit using the pre-slew DRM will introduce some errors in both a spectral shape and a normalization if the PHA file contains a lot of the slew/post-slew time interval.
- 3) For fits to more complicated models (e.g. a power-law over a cutoff power-law), the BAT team has decided to require a chi-square improvement of more than 6 for each extra dof.
Time averaged spectrum fit using the average DRM
Power-law model
Time interval is from   -2.048 sec. to    3.000 sec.

Spectral model in power-law:
------------------------------------------------------------
Parameters  : value       lower 90%   higher 90%
Photon index: -1.50898     ( -0.162291   0.161363 )
Norm@50keV  : 7.34386E-03    ( -0.00075043   0.000746272 )
------------------------------------------------------------
#Fit statistic : Chi-Squared =          47.72 using 59 PHA bins.
# Reduced chi-squared =         0.8371 for     57 degrees of freedom
# Null hypothesis probability =   8.046777e-01

Photon flux (15-150 keV)    in 5.048 sec: 0.919055 ( -0.091252  0.091325 ) ph/cm2/s
Energy fluence (15-150 keV)             : 3.5122e-07 ( -3.89868e-08  3.94042e-08 ) ergs/cm2
Cutoff power-law model
Time interval is from   -2.048 sec. to    3.000 sec.
Spectral model in the cutoff power-law:
------------------------------------------------------------
Parameters  : value       lower 90%   higher 90%
Photon index: -0.565751     ( -0.731694   0.914924 )
Epeak [keV] : 69.6151      ( -16.0464 80.8233 )
Norm@50keV  : 2.38976E-02    ( -0.0141581   0.0514935 )
------------------------------------------------------------
#Fit statistic : Chi-Squared =          42.64 using 59 PHA bins.
# Reduced chi-squared =         0.7614 for     56 degrees of freedom
# Null hypothesis probability =   9.057651e-01

Photon flux (15-150 keV)    in 5.048 sec: 0.890187 ( -0.094382  0.094252 ) ph/cm2/s
Energy fluence (15-150 keV)             : 3.21514e-07 ( -4.47499e-08  4.56328e-08 ) ergs/cm2
1-s peak spectrum fit
Power-law model
Time interval is from    0.008 sec. to    1.008 sec.

Spectral model in power-law:
------------------------------------------------------------
Parameters  : value       lower 90%   higher 90%
Photon index: -1.54662     ( -0.264181   0.25804 )
Norm@50keV  : 1.03844E-02    ( -0.0017489   0.00172745 )
------------------------------------------------------------
#Fit statistic : Chi-Squared =          57.05 using 59 PHA bins.
# Reduced chi-squared =          1.001 for     57 degrees of freedom
# Null hypothesis probability =   4.733039e-01

Photon flux (15-150 keV)    in 1 sec: 1.31337 ( -0.20993  0.21009 ) ph/cm2/s
Energy fluence (15-150 keV)             : 9.78205e-08 ( -1.76675e-08  1.79639e-08 ) ergs/cm2
Cutoff power-law model
Time interval is from    0.008 sec. to    1.008 sec.
Spectral model in the cutoff power-law:
------------------------------------------------------------
Parameters  : value       lower 90%   higher 90%
Photon index: -0.530726     ( -1.10159   1.50206 )
Epeak [keV] : 66.8982      ( -19.0731 -66.8981 )
Norm@50keV  : 3.67180E-02    ( -0.0367181   0.198496 )
------------------------------------------------------------
#Fit statistic : Chi-Squared =          54.71 using 59 PHA bins.
# Reduced chi-squared =         0.9770 for     56 degrees of freedom
# Null hypothesis probability =   5.236351e-01

Photon flux (15-150 keV)    in 1 sec: 1.27434 ( -0.21528  0.21513 ) ph/cm2/s
Energy fluence (15-150 keV)             : 9.00596e-08 ( -1.89759e-08  1.99271e-08 ) ergs/cm2
Time-resolved spectra
Distribution
T90 vs. Hardness ratio plot
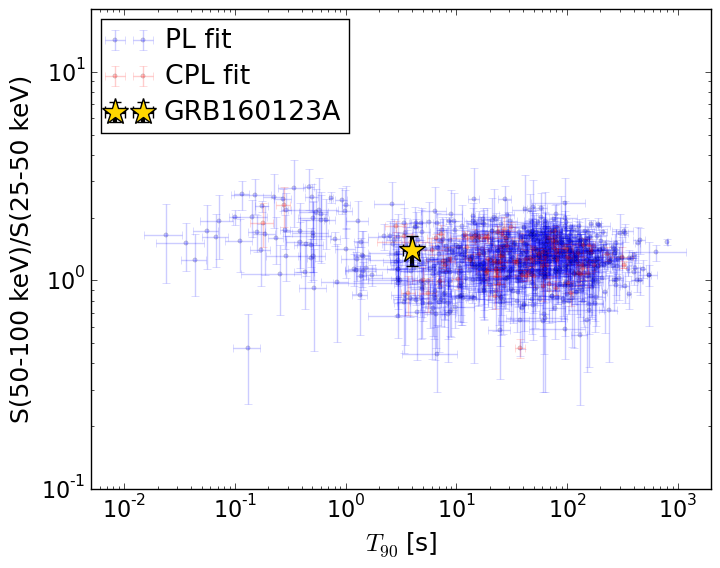
T90                                   = 3.952 sec.
Hardness ratio (energy fluence ratio) = 1.40549730607
S(15-50 keV) vs. S(50-150 keV) plot
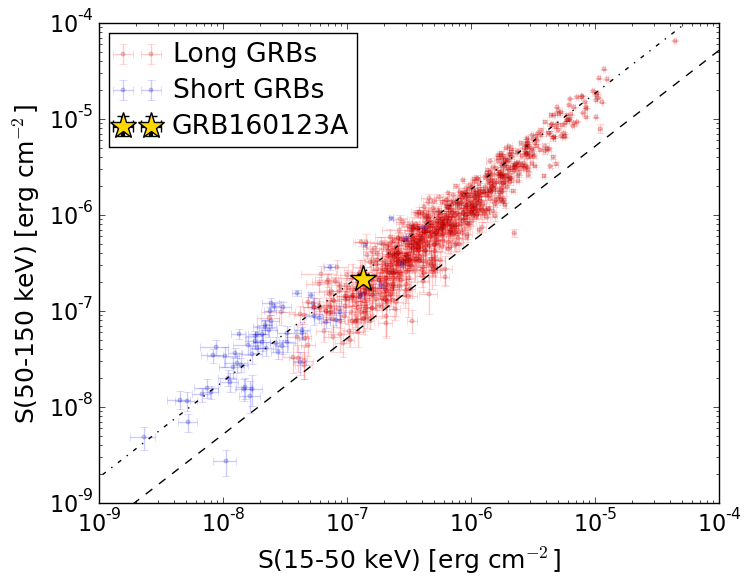
S(15-50 keV)  = 1.349751e-07
S(50-150 keV) = 2.1624688e-07
The dash-dotted line and the dashed line traces the fluences calculated from the Band function with Epeak = 15 and 150 keV, respectively. Both lines assume a canonical values of alpha = -1 and beta = -2.5.
Mask shadow pattern
IMX = -1.308747690339830E-01, IMY = 4.221164039280391E-01
Spacecraft aspect plot
Bright source in the pre-burst/pre-slew/post-slew images
Pre-burst image of 15-350 keV band
Time interval of the image:
-239.904000 -2.048000

# RAcent  DECcent POSerr Theta    Phi  PeakCts   SNR AngSep     Name
#  [deg]    [deg]    ['] [deg]  [deg]                   [']
135.5351 -40.5329    1.7  24.3  -73.7   1.8387   6.7    1.3	Vela X-1
151.8719  25.1273    3.1  45.7  137.7   3.8587   3.7 ------	UNKNOWN
160.1718  25.3614    2.8  49.8  146.2   4.5450   4.1 ------	UNKNOWN
108.9571  -7.5885    2.5  24.3   40.9   1.1458   4.6 ------	UNKNOWN
155.9693   4.4414    2.8  31.4  163.0   1.2295   4.1 ------	UNKNOWN
114.2628 -53.3720    2.3  39.6  -50.8   2.2450   5.1 ------	UNKNOWN
170.8698 -43.6563    3.2  42.6 -109.5   3.7182   3.7 ------	UNKNOWN
Pre-slew background subtracted image of 15-350 keV band
Time interval of the image:
-2.048000 3.000000

# RAcent  DECcent POSerr Theta    Phi  PeakCts   SNR AngSep     Name
#  [deg]    [deg]    ['] [deg]  [deg]                   [']
135.6419 -40.6142   47.4  24.4  -73.9   0.0089   0.2    6.3	Vela X-1
143.5082  11.7155    2.3  30.2  134.9   0.2043   4.9 ------	UNKNOWN
171.6769 -15.1069    2.2  38.0 -153.8   0.2042   5.2 ------	UNKNOWN
150.2766 -33.7897    0.7  23.8 -107.2   0.5671  15.9 ------	UNKNOWN
Post-slew image of 15-350 keV band
Time interval of the image:
62.396640 962.194500

# RAcent  DECcent POSerr Theta    Phi  PeakCts   SNR AngSep     Name
#  [deg]    [deg]    ['] [deg]  [deg]                   [']
135.5434 -40.5346    0.8  13.5   -6.0   9.8239  14.2    1.4	Vela X-1
170.3475 -60.6191    4.9  29.9  -81.5  -2.4597  -2.4    1.0	Cen X-3
186.7574 -62.7994   14.1  36.9  -88.6   1.7076   0.8    3.3	GX 301-2
169.9998   5.1835    2.3  43.2  147.7   9.7034   5.0 ------	UNKNOWN
196.1837   1.2092    4.8  55.5  178.9   8.2241   2.4 ------	UNKNOWN
 69.7233 -67.0119    2.9  55.6  -33.9  17.7810   4.0 ------	UNKNOWN
 86.7206 -75.1989    3.8  50.8  -44.5  13.2501   3.1 ------	UNKNOWN