Analysis Summary
Notes:
- 1) No attempt has been made to eliminate the non-significant decimal places.
- 2) This batgrbproduct analysis is done using the HEASARC data.
- 3) This batgrbproduct analysis is using the flight position for the mask-weighting calculation.
======================================================================
BAT GRB EVENT DATA PROCESSING REPORT
Process Script Ver: batgrbproduct v2.46
Process Start Time: Thu Mar 17 18:46:57 EDT 2016
Host Name: bat1
Current Working Dir: /local/data/bat1/alien/Swift_3rdBATcatalog/event/batevent_reproc/trigger672236
======================================================================
Trigger: 00672236 Segment: 000
BAT Trigger Time: 475921247.744 [s; MET]
Trigger Stop: 475921248.768 [s; MET]
UTC: 2016-01-31T08:20:31.969040 [includes UTCF correction]
Where From?: TDRSS position message
BAT
RA: 78.1817178167953 Dec: -7.06755751563068 [deg; J2000]
Catalogged Source?: NO
Point Source?: YES
GRB Indicated?: YES [ by BAT flight software ]
Image S/N Ratio: 7.32
Image Trigger?: NO
Rate S/N Ratio: 11.6619037896906 [ if not an image trigger ]
Image S/N Ratio: 7.32
Analysis Position: [ source = BAT ]
RA: 78.1817178167953 Dec: -7.06755751563068 [deg; J2000]
Refined Position: [ source = BAT pre-slew burst ]
RA: 78.1685449857049 Dec: -7.03847058064275 [deg; J2000]
{ 05h 12m 40.5s , -07d 02' 18.5" }
+/- 1.08535062368957 [arcmin] (estimated 90% radius based on SNR)
+/- 0.380568137913955 [arcmin] (formal 1-sigma fit error)
SNR: 27.0585181131645
Angular difference between the analysis and refined position is 1.913386 arcmin
Partial Coding Fraction: 0.6484375 [ including projection effects ]
Duration
T90: 327.751999974251 +/- 71.029021038502
Measured from: 12.8079999685287
to: 340.55999994278 [s; relative to TRIGTIME]
T50: 64.3879999518394 +/- 5.0269799927161
Measured from: 21.0239999890327
to: 85.4119999408722 [s; relative to TRIGTIME]
Fluence
Peak Flux (peak 1 second)
Measured from: 15.972000002861
to: 16.972000002861 [s; relative to TRIGTIME]
Total Fluence
Measured from: -1.49200004339218
to: 773.032000005245 [s; relative to TRIGTIME]
Band 1 Band 2 Band 3 Band 4
15-25 25-50 50-100 100-350 keV
Total 6.899761 10.672348 9.534881 3.253039
0.198139 0.209287 0.185796 0.160217 [error]
Peak 0.155088 0.280972 0.279466 0.118139
0.011451 0.014370 0.014797 0.012332 [error]
[ fluence units of on-axis counts / fully illuminated detector ]
======================================================================
====== Table of the duration information =============================
Value tstart tstop
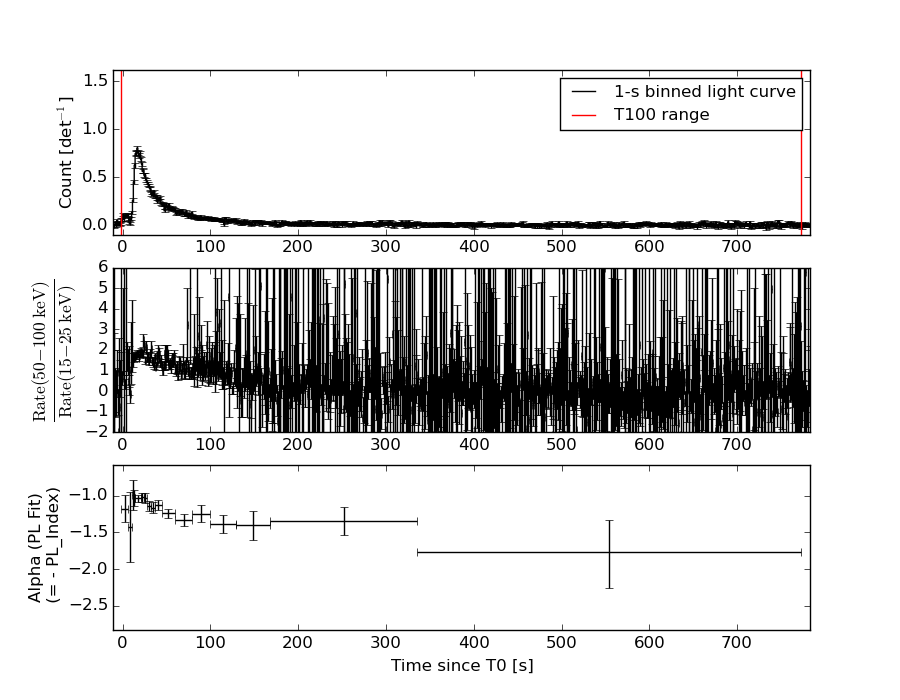
T100 774.524 -1.492 773.032
T90 327.752 12.808 340.560
T50 64.388 21.024 85.412
Peak 1.000 15.972 16.972
====== Spectral Analysis Summary =====================================
Model : spectral model: simple power-law (PL) and cutoff power-law (CPL)
Ph_index : photon index: E^{Ph_index}
Ph_90err : 90% error of the photon index
Epeak : Epeak in keV
Epeak_90err: 90% error of Epeak
Norm : normalization at 50 keV in both the PL model and CPL model
Nomr_90err : 90% error of the normalization
chi2 : Chi-Squared
dof : degree of freedo
=== Time-averaged spectral analysis ===
(Best model with acceptable fit: PL)
Model Ph_index Ph_90err_low Ph_90err_hi Epeak Epeak_90err_low Epeak_90err_hi Norm Nomr_90err_low Norm_90err_hi chi2 dof
PL -1.212 -0.045 0.046 - - - 2.57e-03 -6.08e-05 6.07e-05 54.430 57
CPL -1.209 -0.044 0.048 9999.360 -9999.360 -9999.360 2.58e-03 -5.91e-05 2.37e-04 54.540 56
=== 1-s peak spectral analysis ===
(Best model with acceptable fit: N/A)
Model Ph_index Ph_90err_low Ph_90err_hi Epeak Epeak_90err_low Epeak_90err_hi Norm Nomr_90err_low Norm_90err_hi chi2 dof
PL -1.069 -0.097 0.098 - - - 5.49e-02 -2.98e-03 2.98e-03 42.620 57
CPL -1.000 -0.239 0.325 794.234 -794.234 -794.234 5.92e-02 -6.94e-03 2.35e-02 42.650 56
=== Fluence/Peak Flux Summary ===
Model Band1 Band2 Band3 Band4 Band5 Total
15-25 25-50 50-100 100-350 15-150 15-350 keV
Fluence PL 1.94e-06 4.26e-06 7.35e-06 2.94e-05 2.01e-05 4.30e-05 erg/cm2
90%_error_low -1.01e-07 -1.28e-07 -1.92e-07 -1.83e-06 -4.89e-07 -1.90e-06 erg/cm2
90%_error_hi 1.03e-07 1.28e-07 1.92e-07 1.92e-06 4.90e-07 1.98e-06 erg/cm2
Peak flux PL 6.10e-04 6.17e-03 6.74e-02 7.58e+00 2.99e-01 7.60e+00 ph/cm2/s
90%_error_low -2.52e-05 N/A N/A -4.43e-01 N/A -3.71e-01 ph/cm2/s
90%_error_hi 7.58e-05 N/A N/A 4.54e-01 N/A 5.49e-01 ph/cm2/s
Fluence CPL 1.94e-06 4.26e-06 7.29e-06 2.92e-05 2.02e-05 4.30e-05 erg/cm2
90%_error_low N/A -1.29e-07 N/A N/A -5.95e-07 -4.25e-06 erg/cm2
90%_error_hi N/A 1.28e-07 N/A N/A 3.84e-07 6.85e-07 erg/cm2
Peak flux CPL 1.50e+00 1.95e+00 1.86e+00 3.04e+00 6.34e+00 8.41e+00 ph/cm2/s
90%_error_low -2.06e-01 -1.33e-01 -1.26e-01 -1.05e+00 -3.50e-01 -1.15e+00 ph/cm2/s
90%_error_hi 1.28e-01 1.29e-01 1.42e-01 3.56e-01 3.63e-01 5.13e-01 ph/cm2/s
======================================================================
Image
Pre-slew 15.0-350.0 keV image (Event data)
#   RAcent    DECcent   POSerr    Theta     Phi              Peak Cts       SNR   Name
   78.1685    -7.0385   0.0071    23.7670   -92.9450         1.9697471     27.059 TRIG_00672236

Foreground time interval of the image:
 -1.492  13.557 (delta_t =  15.049 [sec])
Background time interval of the image:
-239.744  -1.492 (delta_t = 238.252 [sec])
Light Curves
Note: The mask-weighted lightcurves have units of either count/det or counts/sec/det, where a det is 0.4 x 0.4 = 0.16 sq cm.
Full-time range; 1 s binning
Other quick-look light curves:
- 64 ms binning (zoomed)
- 16 ms binning (zoomed)
- 8 ms binning (zoomed)
- 2 ms binning (zoomed)
- SN=5 or 10 s binning (full-time range)
- Raw light curve
Spectra
- 64 ms binning (zoomed)
- 16 ms binning (zoomed)
- 8 ms binning (zoomed)
- 2 ms binning (zoomed)
- SN=5 or 10 s binning (full-time range)
- Raw light curve
Spectra
Notes:
- 1) The fitting includes the systematic errors.
- 2) When the burst includes telescope slew time periods, the fitting uses an average response file made from multiple 5-s response files through out the slew time plus single time preiod for the non-slew times, and weighted by the total counts in the corresponding time period using addrmf. An average response file is needed becuase a spectral fit using the pre-slew DRM will introduce some errors in both a spectral shape and a normalization if the PHA file contains a lot of the slew/post-slew time interval.
- 3) For fits to more complicated models (e.g. a power-law over a cutoff power-law), the BAT team has decided to require a chi-square improvement of more than 6 for each extra dof.
Time averaged spectrum fit using the average DRM
Power-law model
Time interval is from   -1.492 sec. to  773.032 sec.

Spectral model in power-law:
------------------------------------------------------------
Parameters  : value       lower 90%   higher 90%
Photon index: -1.21193     ( -0.0453108   0.0455391 )
Norm@50keV  : 2.56990E-03    ( -6.08443e-05   6.07313e-05 )
------------------------------------------------------------
#Fit statistic : Chi-Squared =          54.43 using 59 PHA bins.
# Reduced chi-squared =         0.9549 for     57 degrees of freedom
# Null hypothesis probability =   5.721771e-01

Photon flux (15-150 keV)    in 774.5 sec: 0.302172 ( -0.007807  0.00784 ) ph/cm2/s
Energy fluence (15-150 keV)             : 2.0128e-05 ( -4.89376e-07  4.90216e-07 ) ergs/cm2
Cutoff power-law model
Time interval is from   -1.492 sec. to  773.032 sec.
Spectral model in the cutoff power-law:
------------------------------------------------------------
Parameters  : value       lower 90%   higher 90%
Photon index: -1.20944     ( -0.0437552   0.0478891 )
Epeak [keV] : 9999.36      ( -9999.36 -9999.36 )
Norm@50keV  : 2.58082E-03    ( -6.05887e-05   0.000235772 )
------------------------------------------------------------
#Fit statistic : Chi-Squared =          54.54 using 59 PHA bins.
# Reduced chi-squared =         0.9739 for     56 degrees of freedom
# Null hypothesis probability =   5.302476e-01

Photon flux (15-150 keV)    in 774.5 sec: 0.304470 ( -0.010203  0.005433 ) ph/cm2/s
Energy fluence (15-150 keV)             : 2.02279e-05 ( -5.95164e-07  3.8366e-07 ) ergs/cm2
1-s peak spectrum fit
Power-law model
Time interval is from   15.972 sec. to   16.972 sec.

Spectral model in power-law:
------------------------------------------------------------
Parameters  : value       lower 90%   higher 90%
Photon index: -1.0695     ( -0.0972536   0.0977638 )
Norm@50keV  : 5.48944E-02    ( -0.00297656   0.00297655 )
------------------------------------------------------------
#Fit statistic : Chi-Squared =          42.62 using 59 PHA bins.
# Reduced chi-squared =         0.7477 for     57 degrees of freedom
# Null hypothesis probability =   9.217109e-01

Photon flux (15-150 keV)    in 1 sec: 0.299354 (    ) ph/cm2/s
Energy fluence (15-150 keV)             : 5.79709e-07 ( -3.63211e-08  3.6517e-08 ) ergs/cm2
Cutoff power-law model
Time interval is from   15.972 sec. to   16.972 sec.
Spectral model in the cutoff power-law:
------------------------------------------------------------
Parameters  : value       lower 90%   higher 90%
Photon index: -1.06432     ( -0.235603   0.328591 )
Epeak [keV] : 9998.11      ( -9998.02 -9998.02 )
Norm@50keV  : 5.52024E-02    ( -0.00299326   0.0274489 )
------------------------------------------------------------
#Fit statistic : Chi-Squared =          42.61 using 59 PHA bins.
# Reduced chi-squared =         0.7609 for     56 degrees of freedom
# Null hypothesis probability =   9.063104e-01

Photon flux (15-150 keV)    in 1 sec: 6.34267 ( -0.35024  0.36289 ) ph/cm2/s
Energy fluence (15-150 keV)             : 5.78709e-07 ( -3.99928e-08  3.84968e-08 ) ergs/cm2
Time-resolved spectra
Distribution
T90 vs. Hardness ratio plot
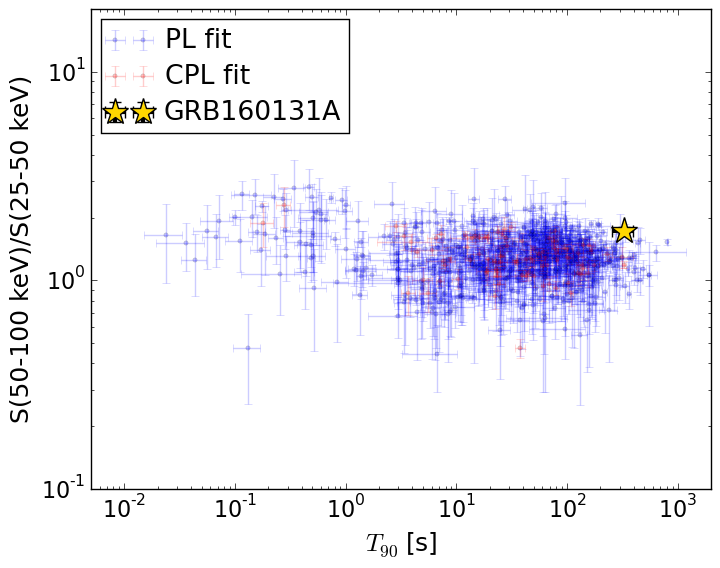
T90                                   = 327.752 sec.
Hardness ratio (energy fluence ratio) = 1.72679174487
S(15-50 keV) vs. S(50-150 keV) plot
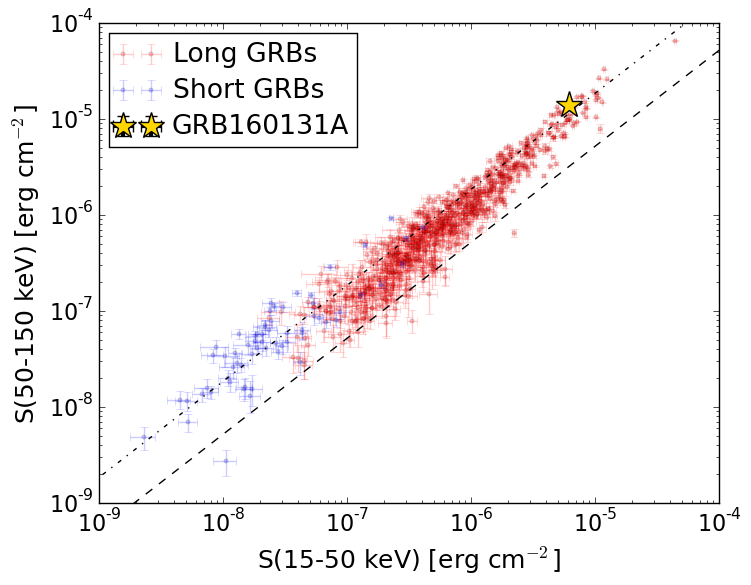
S(15-50 keV)  = 6.19937e-06
S(50-150 keV) = 1.392887e-05
The dash-dotted line and the dashed line traces the fluences calculated from the Band function with Epeak = 15 and 150 keV, respectively. Both lines assume a canonical values of alpha = -1 and beta = -2.5.
Mask shadow pattern
IMX = -2.262474928634723E-02, IMY = 4.397838829652273E-01
Spacecraft aspect plot
Bright source in the pre-burst/pre-slew/post-slew images
Pre-burst image of 15-350 keV band
Time interval of the image:
-239.744000 -1.492000

# RAcent  DECcent POSerr Theta    Phi  PeakCts   SNR AngSep     Name
#  [deg]    [deg]    ['] [deg]  [deg]                   [']
 83.6333  22.0204    0.3  21.5  -10.0  10.2836  40.6    0.4	Crab
137.7041 -12.9898    2.9  43.5  145.4   2.8604   4.0 ------	UNKNOWN
119.3974 -12.5314    3.2  28.0  160.7   1.0571   3.6 ------	UNKNOWN
 66.8802  -6.3287    2.4  33.5  -81.2   2.1750   4.8 ------	UNKNOWN
 54.3359   5.2262    3.1  43.6  -59.0   4.0934   3.7 ------	UNKNOWN
 46.2003  17.8106    3.7  52.1  -42.4   4.4166   3.2 ------	UNKNOWN
Pre-slew background subtracted image of 15-350 keV band
Time interval of the image:
-1.492000 13.556590

# RAcent  DECcent POSerr Theta    Phi  PeakCts   SNR AngSep     Name
#  [deg]    [deg]    ['] [deg]  [deg]                   [']
 83.4390  22.0740    6.8  21.6  -10.3  -0.0953  -1.7   11.4	Crab
134.7125  20.4425    2.8  38.3   93.6   0.8650   4.0 ------	UNKNOWN
120.6399  25.5193    1.9  29.1   74.6   0.5340   6.1 ------	UNKNOWN
112.3852   5.2936    2.1  14.1  121.0   0.3093   5.5 ------	UNKNOWN
 62.4669  40.0264    2.1  46.9   -8.2   0.5231   5.4 ------	UNKNOWN
 59.5657  29.1803    2.8  43.3  -23.1   0.3628   4.1 ------	UNKNOWN
 78.1686  -7.0385    0.4  23.8  -92.9   1.9695  27.0 ------	UNKNOWN
Post-slew image of 15-350 keV band
Time interval of the image:
58.956600 596.256590

# RAcent  DECcent POSerr Theta    Phi  PeakCts   SNR AngSep     Name
#  [deg]    [deg]    ['] [deg]  [deg]                   [']
 83.6467  22.0133    0.4  29.5   35.5  21.7736  31.7    0.8	Crab
117.5304 -21.1441    2.0  40.5  139.7   8.0959   5.7 ------	UNKNOWN
115.6033 -53.2756    3.3  55.3  179.0  10.1326   3.4 ------	UNKNOWN
 78.1886  -7.0450    0.6   0.0  -65.9  10.1667  19.1 ------	UNKNOWN
 29.7844  13.0531    3.7  52.1  -42.2  11.5276   3.1 ------	UNKNOWN