Analysis Summary
Notes:
- 1) No attempt has been made to eliminate the non-significant decimal places.
- 2) This batgrbproduct analysis is done using the HEASARC data.
- 3) This batgrbproduct analysis is using the flight position for the mask-weighting calculation.
======================================================================
BAT GRB EVENT DATA PROCESSING REPORT
Process Script Ver: batgrbproduct v2.46
Process Start Time: Thu Mar 17 18:44:07 EDT 2016
Host Name: bat1
Current Working Dir: /local/data/bat1/alien/Swift_3rdBATcatalog/event/batevent_reproc/trigger672525
======================================================================
Trigger: 00672525 Segment: 000
BAT Trigger Time: 476158406.4 [s; MET]
Trigger Stop: 476158422.784 [s; MET]
UTC: 2016-02-03T02:13:10.612140 [includes UTCF correction]
Where From?: TDRSS position message
BAT
RA: 161.951792632841 Dec: -24.7621168677871 [deg; J2000]
Catalogged Source?: NO
Point Source?: YES
GRB Indicated?: YES [ by BAT flight software ]
Image S/N Ratio: 8.81
Image Trigger?: NO
Rate S/N Ratio: 14.1774468787578 [ if not an image trigger ]
Image S/N Ratio: 8.81
Analysis Position: [ source = BAT ]
RA: 161.951792632841 Dec: -24.7621168677871 [deg; J2000]
Refined Position: [ source = BAT pre-slew burst ]
RA: 161.975327594921 Dec: -24.7689926893186 [deg; J2000]
{ 10h 47m 54.1s , -24d 46' 08.4" }
+/- 1.73490565806985 [arcmin] (estimated 90% radius based on SNR)
+/- 0.75974114968461 [arcmin] (formal 1-sigma fit error)
SNR: 13.8450879205332
Angular difference between the analysis and refined position is 1.346960 arcmin
Partial Coding Fraction: 0.203125 [ including projection effects ]
Duration
T90: 17.4400000572205 +/- 2.28598513042857
Measured from: 6.68000000715256
to: 24.120000064373 [s; relative to TRIGTIME]
T50: 8.432000041008 +/- 2.5837399360243
Measured from: 10.3600000143051
to: 18.7920000553131 [s; relative to TRIGTIME]
Fluence
Peak Flux (peak 1 second)
Measured from: 11.9800000190735
to: 12.9800000190735 [s; relative to TRIGTIME]
Total Fluence
Measured from: 6.08799999952316
to: 25.7840000391006 [s; relative to TRIGTIME]
Band 1 Band 2 Band 3 Band 4
15-25 25-50 50-100 100-350 keV
Total 0.653406 0.706446 0.360860 0.067036
0.067753 0.071130 0.058294 0.048792 [error]
Peak 0.060200 0.053487 0.030209 0.020681
0.015248 0.017867 0.014779 0.011595 [error]
[ fluence units of on-axis counts / fully illuminated detector ]
======================================================================
====== Table of the duration information =============================
Value tstart tstop
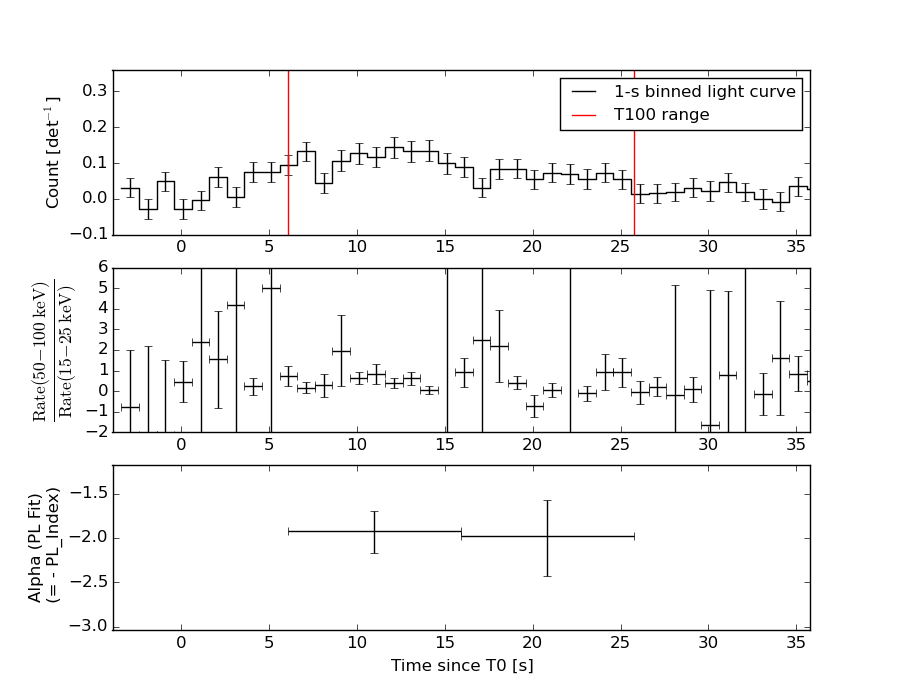
T100 19.696 6.088 25.784
T90 17.440 6.680 24.120
T50 8.432 10.360 18.792
Peak 1.000 11.980 12.980
====== Spectral Analysis Summary =====================================
Model : spectral model: simple power-law (PL) and cutoff power-law (CPL)
Ph_index : photon index: E^{Ph_index}
Ph_90err : 90% error of the photon index
Epeak : Epeak in keV
Epeak_90err: 90% error of Epeak
Norm : normalization at 50 keV in both the PL model and CPL model
Nomr_90err : 90% error of the normalization
chi2 : Chi-Squared
dof : degree of freedo
=== Time-averaged spectral analysis ===
(Best model with acceptable fit: PL)
Model Ph_index Ph_90err_low Ph_90err_hi Epeak Epeak_90err_low Epeak_90err_hi Norm Nomr_90err_low Norm_90err_hi chi2 dof
PL -1.941 -0.218 0.207 - - - 5.48e-03 -7.61e-04 7.42e-04 50.830 57
CPL -1.776 -0.518 0.943 58.475 N/A N/A 6.80e-03 N/A N/A 50.710 56
=== 1-s peak spectral analysis ===
(Best model with acceptable fit: N/A)
Model Ph_index Ph_90err_low Ph_90err_hi Epeak Epeak_90err_low Epeak_90err_hi Norm Nomr_90err_low Norm_90err_hi chi2 dof
PL -2.003 -0.705 0.560 - - - 8.60e-03 -3.85e-03 3.53e-03 53.710 57
CPL -2.021 -0.144 3.591 48.083 N/A N/A 8.38e-03 N/A N/A 53.710 56
=== Fluence/Peak Flux Summary ===
Model Band1 Band2 Band3 Band4 Band5 Total
15-25 25-50 50-100 100-350 15-150 15-350 keV
Fluence PL 2.09e-07 2.94e-07 3.06e-07 5.85e-07 9.93e-07 1.39e-06 erg/cm2
90%_error_low -3.43e-08 -3.33e-08 -5.71e-08 -1.93e-07 -1.32e-07 -2.60e-07 erg/cm2
90%_error_hi 3.53e-08 3.33e-08 5.78e-08 2.47e-07 1.34e-07 3.01e-07 erg/cm2
Peak flux PL 5.75e-01 4.30e-01 2.15e-01 1.53e-01 1.29e+00 1.37e+00 ph/cm2/s
90%_error_low -2.35e-01 -1.40e-01 -1.16e-01 -1.53e-01 -4.06e-01 -4.42e-01 ph/cm2/s
90%_error_hi 2.47e-01 1.37e-01 1.21e-01 2.13e-01 4.06e-01 4.49e-01 ph/cm2/s
Fluence CPL 2.06e-07 3.00e-07 3.05e-07 4.29e-07 9.77e-07 1.24e-06 erg/cm2
90%_error_low -3.78e-08 N/A -6.10e-08 -3.27e-07 -1.53e-07 -3.73e-07 erg/cm2
90%_error_hi 3.65e-08 N/A 5.93e-08 3.04e-07 1.38e-07 4.84e-07 erg/cm2
Peak flux CPL 5.75e-01 4.29e-01 2.15e-01 1.90e-01 1.29e+00 1.38e+00 ph/cm2/s
90%_error_low -2.34e-01 N/A -1.11e-01 -1.90e-01 -4.05e-01 -4.34e-01 ph/cm2/s
90%_error_hi 2.48e-01 N/A 4.26e-02 5.46e-02 4.06e-01 4.58e-01 ph/cm2/s
======================================================================
Image
Pre-slew 15.0-350.0 keV image (Event data)
#   RAcent    DECcent   POSerr    Theta     Phi              Peak Cts       SNR   Name
  161.9753   -24.7690   0.0139    34.8490   110.1820         1.8311919     13.845 TRIG_00672525

Foreground time interval of the image:
  6.088  25.784 (delta_t =  19.696 [sec])
Background time interval of the image:
-239.400   6.088 (delta_t = 245.488 [sec])
Light Curves
Note: The mask-weighted lightcurves have units of either count/det or counts/sec/det, where a det is 0.4 x 0.4 = 0.16 sq cm.
Full-time range; 1 s binning
Other quick-look light curves:
- 64 ms binning (zoomed)
- 16 ms binning (zoomed)
- 8 ms binning (zoomed)
- 2 ms binning (zoomed)
- SN=5 or 10 s binning (full-time range)
- Raw light curve
Spectra
- 64 ms binning (zoomed)
- 16 ms binning (zoomed)
- 8 ms binning (zoomed)
- 2 ms binning (zoomed)
- SN=5 or 10 s binning (full-time range)
- Raw light curve
Spectra
Notes:
- 1) The fitting includes the systematic errors.
- 2) When the burst includes telescope slew time periods, the fitting uses an average response file made from multiple 5-s response files through out the slew time plus single time preiod for the non-slew times, and weighted by the total counts in the corresponding time period using addrmf. An average response file is needed becuase a spectral fit using the pre-slew DRM will introduce some errors in both a spectral shape and a normalization if the PHA file contains a lot of the slew/post-slew time interval.
- 3) For fits to more complicated models (e.g. a power-law over a cutoff power-law), the BAT team has decided to require a chi-square improvement of more than 6 for each extra dof.
Time averaged spectrum fit using the average DRM
Power-law model
Time interval is from    6.088 sec. to   25.784 sec.

Spectral model in power-law:
------------------------------------------------------------
Parameters  : value       lower 90%   higher 90%
Photon index: -1.94144     ( -0.217695   0.206835 )
Norm@50keV  : 5.47648E-03    ( -0.00076123   0.000741711 )
------------------------------------------------------------
#Fit statistic : Chi-Squared =          50.83 using 59 PHA bins.
# Reduced chi-squared =         0.8918 for     57 degrees of freedom
# Null hypothesis probability =   7.043842e-01

Photon flux (15-150 keV)    in 19.7 sec: 0.800179 ( -0.091528  0.09158 ) ph/cm2/s
Energy fluence (15-150 keV)             : 9.92764e-07 ( -1.31777e-07  1.33957e-07 ) ergs/cm2
Cutoff power-law model
Time interval is from    6.088 sec. to   25.784 sec.
Spectral model in the cutoff power-law:
------------------------------------------------------------
Parameters  : value       lower 90%   higher 90%
Photon index: -1.77633     ( -0.518069   0.943466 )
Epeak [keV] : 58.4746      (   )
Norm@50keV  : 6.80099E-03    (     )
------------------------------------------------------------
#Fit statistic : Chi-Squared =          50.71 using 59 PHA bins.
# Reduced chi-squared =         0.9055 for     56 degrees of freedom
# Null hypothesis probability =   6.747746e-01

Photon flux (15-150 keV)    in 19.7 sec: 0.795516 ( -0.094445  0.094027 ) ph/cm2/s
Energy fluence (15-150 keV)             : 9.76667e-07 ( -1.53029e-07  1.38131e-07 ) ergs/cm2
1-s peak spectrum fit
Power-law model
Time interval is from   11.980 sec. to   12.980 sec.

Spectral model in power-law:
------------------------------------------------------------
Parameters  : value       lower 90%   higher 90%
Photon index: -2.00301     ( -0.704835   0.5601 )
Norm@50keV  : 8.59621E-03    ( -0.00384608   0.00352646 )
------------------------------------------------------------
#Fit statistic : Chi-Squared =          53.71 using 59 PHA bins.
# Reduced chi-squared =         0.9424 for     57 degrees of freedom
# Null hypothesis probability =   5.991156e-01

Photon flux (15-150 keV)    in 1 sec: 1.29131 ( -0.40567  0.40572 ) ph/cm2/s
Energy fluence (15-150 keV)             : 7.92994e-08 ( -3.09813e-08  3.28198e-08 ) ergs/cm2
Cutoff power-law model

Time interval is from   11.980 sec. to   12.980 sec.
Spectral model in the cutoff power-law:
------------------------------------------------------------
Parameters  : value       lower 90%   higher 90%
Photon index: -2.02123     ( -0.144169   3.59117 )
Epeak [keV] : 48.0827      (   )
Norm@50keV  : 8.38375E-03    (     )
------------------------------------------------------------
#Fit statistic : Chi-Squared =          53.71 using 59 PHA bins.
# Reduced chi-squared =         0.9592 for     56 degrees of freedom
# Null hypothesis probability =   5.618816e-01

Photon flux (15-150 keV)    in 1 sec: 1.29170 ( -0.40542  0.40577 ) ph/cm2/s
Energy fluence (15-150 keV)             : 0 ( 0  0 ) ergs/cm2
Time-resolved spectra
Distribution
T90 vs. Hardness ratio plot

T90                                   = 17.44 sec.
Hardness ratio (energy fluence ratio) = 1.04145380962
S(15-50 keV) vs. S(50-150 keV) plot
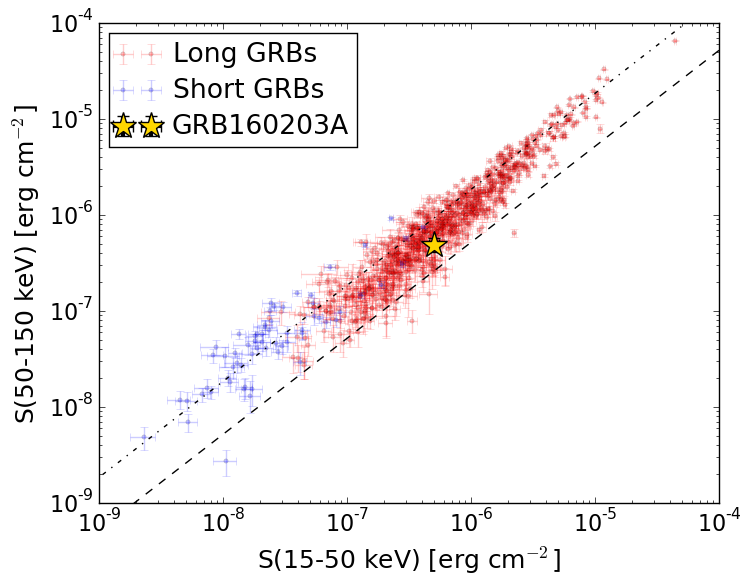
S(15-50 keV)  = 5.023969e-07
S(50-150 keV) = 4.90376e-07
The dash-dotted line and the dashed line traces the fluences calculated from the Band function with Epeak = 15 and 150 keV, respectively. Both lines assume a canonical values of alpha = -1 and beta = -2.5.
Mask shadow pattern
IMX = -2.402208657539906E-01, IMY = -6.535364046436554E-01
Spacecraft aspect plot
Bright source in the pre-burst/pre-slew/post-slew images
Pre-burst image of 15-350 keV band
Time interval of the image:
-239.400000 6.088000

# RAcent  DECcent POSerr Theta    Phi  PeakCts   SNR AngSep     Name
#  [deg]    [deg]    ['] [deg]  [deg]                   [']
135.4334 -40.5658    3.2  24.8   57.3  -1.0316  -3.6    4.4	Vela X-1
170.6612 -60.6988  471.8   4.9 -144.4   0.0054   0.0   11.1	Cen X-3
186.6609 -62.7544    0.9  12.7 -136.0   2.7673  12.3    1.0	GX 301-2
 93.3417 -36.2340    3.0  48.3   16.0   2.2372   3.9 ------	UNKNOWN
 86.3873 -34.9938    2.8  52.8   11.2   3.4675   4.1 ------	UNKNOWN
168.9269 -44.3687    2.8  16.0  129.6   0.8693   4.1 ------	UNKNOWN
118.3065 -57.4191    2.9  22.0    5.6   0.9146   4.0 ------	UNKNOWN
 87.1599 -69.8633    2.4  30.9  -31.2   1.2867   4.8 ------	UNKNOWN
246.0708 -73.3305    3.1  33.0 -103.0   1.3851   3.7 ------	UNKNOWN
268.4238 -79.1501    2.7  35.0  -89.6   2.1267   4.3 ------	UNKNOWN
279.3044 -75.0653    3.5  39.5  -92.2   3.2609   3.3 ------	UNKNOWN
Pre-slew background subtracted image of 15-350 keV band
Time interval of the image:
6.088000 25.784000

# RAcent  DECcent POSerr Theta    Phi  PeakCts   SNR AngSep     Name
#  [deg]    [deg]    ['] [deg]  [deg]                   [']
135.5865 -40.6999    5.6  24.7   57.4   0.1543   2.1    9.1	Vela X-1
169.9073 -60.5561    0.0   4.5 -145.5  -0.0969  -2.0   12.7	Cen X-3
186.4227 -62.8734    6.9  12.6 -135.4   0.0924   1.7    8.9	GX 301-2
180.5751 -15.9584    2.6  45.9  135.3   1.1452   4.4 ------	UNKNOWN
161.9753 -24.7690    0.8  34.8  110.2   1.8313  13.9 ------	UNKNOWN
 88.3783 -64.4050    2.8  32.5  -21.3   0.2663   4.1 ------	UNKNOWN
 56.4175 -50.4224    2.1  54.3  -21.9   0.8741   5.4 ------	UNKNOWN
Post-slew image of 15-350 keV band
Time interval of the image:
121.100580 458.900590

# RAcent  DECcent POSerr Theta    Phi  PeakCts   SNR AngSep     Name
#  [deg]    [deg]    ['] [deg]  [deg]                   [']
135.6792 -40.5962    4.0  27.0   -8.2   0.8404   2.9    7.3	Vela X-1
170.5451 -60.7187    4.0  36.4  -63.0  -1.3827  -2.8    8.9	Cen X-3
186.7922 -62.7372    3.7  41.4  -72.9   3.2949   3.1    4.2	GX 301-2
127.3140  -0.2124    2.5  41.5   65.0   5.4631   4.6 ------	UNKNOWN
150.4350   7.8930    3.5  34.6  103.6   2.1250   3.3 ------	UNKNOWN
114.5666 -15.8757    3.4  45.1   36.0   2.9036   3.4 ------	UNKNOWN
163.9925   7.6891    2.6  32.5  127.8   2.2370   4.5 ------	UNKNOWN
163.5557  -8.8231    3.3  16.0  129.8   0.9618   3.5 ------	UNKNOWN
209.0496 -12.6397    3.1  46.0 -152.3   2.2042   3.7 ------	UNKNOWN
218.3263  -2.2560    3.1  58.7 -159.2   7.2379   3.7 ------	UNKNOWN
215.0008 -16.3635    3.1  50.1 -144.9   3.1964   3.8 ------	UNKNOWN
 97.9869 -65.3254    3.1  56.8  -29.3   6.1539   3.7 ------	UNKNOWN
211.0870 -38.9731    2.4  43.5 -114.6   6.0450   4.9 ------	UNKNOWN