Analysis Summary
Notes:
- 1) No attempt has been made to eliminate the non-significant decimal places.
- 2) This batgrbproduct analysis is done using the HEASARC data.
- 3) This batgrbproduct analysis is using the flight position for the mask-weighting calculation.
======================================================================
BAT GRB EVENT DATA PROCESSING REPORT
Process Script Ver: batgrbproduct v2.46
Process Start Time: Thu Mar 17 18:07:40 EDT 2016
Host Name: bat1
Current Working Dir: /local/data/bat1/alien/Swift_3rdBATcatalog/event/batevent_reproc/trigger675998
======================================================================
Trigger: 00675998 Segment: 000
BAT Trigger Time: 478102872.32 [s; MET]
Trigger Stop: 478102899.2 [s; MET]
UTC: 2016-02-25T14:20:56.426440 [includes UTCF correction]
Where From?: TDRSS position message
BAT
RA: 164.2420743311 Dec: 53.6552363651881 [deg; J2000]
Catalogged Source?: NO
Point Source?: YES
GRB Indicated?: YES [ by BAT flight software ]
Image S/N Ratio: 8.62
Image Trigger?: NO
Rate S/N Ratio: 10.816653826392 [ if not an image trigger ]
Image S/N Ratio: 8.62
Analysis Position: [ source = BAT ]
RA: 164.2420743311 Dec: 53.6552363651881 [deg; J2000]
Refined Position: [ source = BAT pre-slew burst ]
RA: 164.217310471855 Dec: 53.6605408842222 [deg; J2000]
{ 10h 56m 52.2s , +53d 39' 37.9" }
+/- 1.93152477858558 [arcmin] (estimated 90% radius based on SNR)
+/- 0.907527613699469 [arcmin] (formal 1-sigma fit error)
SNR: 11.876525431041
Angular difference between the analysis and refined position is 0.936268 arcmin
Partial Coding Fraction: 0.3554688 [ including projection effects ]
Duration
T90: 157.456000030041 +/- 70.4915463812023
Measured from: -23.8320000171661
to: 133.624000012875 [s; relative to TRIGTIME]
T50: 38.336000084877 +/- 11.2071206291115
Measured from: -0.920000016689301
to: 37.4160000681877 [s; relative to TRIGTIME]
Fluence
Peak Flux (peak 1 second)
Measured from: 37.1320000290871
to: 38.1320000290871 [s; relative to TRIGTIME]
Total Fluence
Measured from: -30.3759999871254
to: 135.287999987602 [s; relative to TRIGTIME]
Band 1 Band 2 Band 3 Band 4
15-25 25-50 50-100 100-350 keV
Total 0.715580 0.801375 0.708217 0.172508
0.113178 0.116681 0.100292 0.084164 [error]
Peak 0.035072 0.024164 0.047075 0.013563
0.009218 0.010029 0.008325 0.006626 [error]
[ fluence units of on-axis counts / fully illuminated detector ]
======================================================================
====== Table of the duration information =============================
Value tstart tstop
T100 165.664 -30.376 135.288
T90 157.456 -23.832 133.624
T50 38.336 -0.920 37.416
Peak 1.000 37.132 38.132
====== Spectral Analysis Summary =====================================
Model : spectral model: simple power-law (PL) and cutoff power-law (CPL)
Ph_index : photon index: E^{Ph_index}
Ph_90err : 90% error of the photon index
Epeak : Epeak in keV
Epeak_90err: 90% error of Epeak
Norm : normalization at 50 keV in both the PL model and CPL model
Nomr_90err : 90% error of the normalization
chi2 : Chi-Squared
dof : degree of freedo
=== Time-averaged spectral analysis ===
(Best model with acceptable fit: PL)
Model Ph_index Ph_90err_low Ph_90err_hi Epeak Epeak_90err_low Epeak_90err_hi Norm Nomr_90err_low Norm_90err_hi chi2 dof
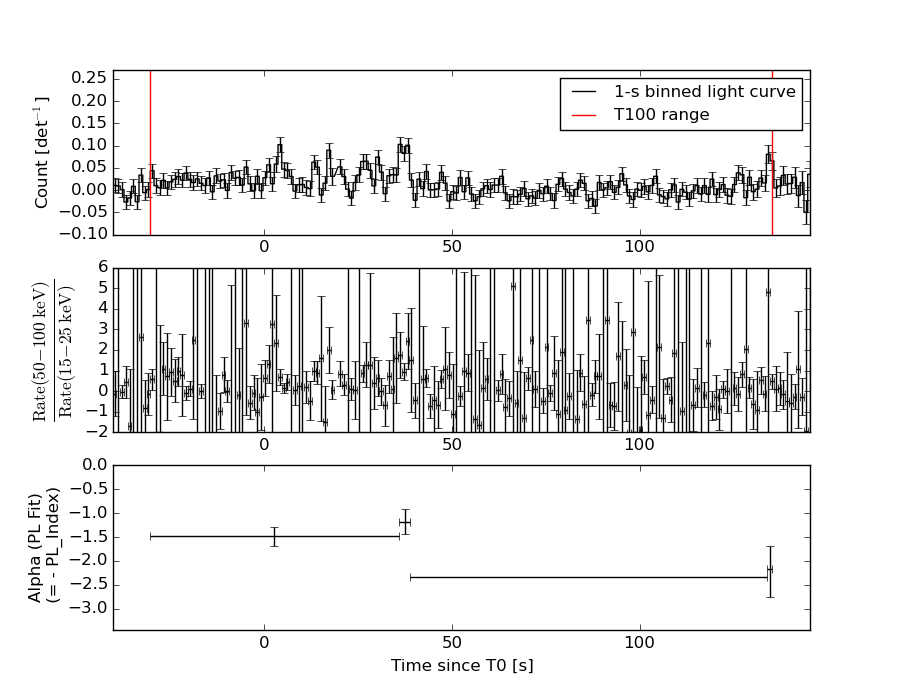
PL -1.568 -0.241 0.238 - - - 1.02e-03 -1.45e-04 1.44e-04 56.930 57
CPL -1.165 -0.620 1.213 104.125 -77.445 -104.125 1.64e-03 -1.64e-03 4.86e-03 56.460 56
=== 1-s peak spectral analysis ===
(Best model with acceptable fit: PL)
Model Ph_index Ph_90err_low Ph_90err_hi Epeak Epeak_90err_low Epeak_90err_hi Norm Nomr_90err_low Norm_90err_hi chi2 dof
PL -1.167 -0.413 0.453 - - - 8.65e-03 -2.02e-03 1.95e-03 45.690 57
CPL -1.170 1.170 1.069 9999.350 N/A N/A 8.71e-03 N/A N/A 45.700 56
=== Fluence/Peak Flux Summary ===
Model Band1 Band2 Band3 Band4 Band5 Total
15-25 25-50 50-100 100-350 15-150 15-350 keV
Fluence PL 2.29e-07 4.03e-07 5.44e-07 1.51e-06 1.58e-06 2.69e-06 erg/cm2
90%_error_low -5.22e-08 -5.91e-08 -9.90e-08 -5.09e-07 -2.38e-07 -6.03e-07 erg/cm2
90%_error_hi 5.54e-08 5.85e-08 9.78e-08 6.55e-07 2.40e-07 7.15e-07 erg/cm2
Peak flux PL 2.59e-01 3.18e-01 2.83e-01 4.35e-01 1.01e+00 1.30e+00 ph/cm2/s
90%_error_low -1.20e-01 -9.96e-02 -6.70e-02 -1.94e-01 -2.49e-01 -2.86e-01 ph/cm2/s
90%_error_hi 1.43e-01 9.41e-02 6.53e-02 2.79e-01 2.51e-01 2.88e-01 ph/cm2/s
Fluence CPL 2.14e-07 4.21e-07 5.60e-07 8.49e-07 1.54e-06 2.04e-06 erg/cm2
90%_error_low -6.42e-08 -7.12e-08 -1.07e-07 -6.09e-07 -2.62e-07 -6.69e-07 erg/cm2
90%_error_hi 6.48e-08 7.63e-08 1.11e-07 1.21e-06 2.59e-07 8.89e-07 erg/cm2
Peak flux CPL 2.59e-01 3.19e-01 2.83e-01 4.45e-01 1.02e+00 1.31e+00 ph/cm2/s
90%_error_low N/A N/A N/A N/A N/A -3.02e-01 ph/cm2/s
90%_error_hi N/A N/A N/A N/A N/A 2.69e-01 ph/cm2/s
======================================================================
Image
Pre-slew 15.0-350.0 keV image (Event data)
#   RAcent    DECcent   POSerr    Theta     Phi              Peak Cts       SNR   Name
  164.2173    53.6605   0.0162    41.5659    19.9838         2.8644119     11.877 TRIG_00675998

Foreground time interval of the image:
-30.376  18.376 (delta_t =  48.752 [sec])
 19.680 109.581 (delta_t =  89.901 [sec])
Background time interval of the image:
-239.320 -30.376 (delta_t = 208.944 [sec])
Light Curves
Note: The mask-weighted lightcurves have units of either count/det or counts/sec/det, where a det is 0.4 x 0.4 = 0.16 sq cm.
Full-time range; 1 s binning
Other quick-look light curves:
- 64 ms binning (zoomed)
- 16 ms binning (zoomed)
- 8 ms binning (zoomed)
- 2 ms binning (zoomed)
- SN=5 or 10 s binning (full-time range)
- Raw light curve
Spectra
- 64 ms binning (zoomed)
- 16 ms binning (zoomed)
- 8 ms binning (zoomed)
- 2 ms binning (zoomed)
- SN=5 or 10 s binning (full-time range)
- Raw light curve
Spectra
Notes:
- 1) The fitting includes the systematic errors.
- 2) When the burst includes telescope slew time periods, the fitting uses an average response file made from multiple 5-s response files through out the slew time plus single time preiod for the non-slew times, and weighted by the total counts in the corresponding time period using addrmf. An average response file is needed becuase a spectral fit using the pre-slew DRM will introduce some errors in both a spectral shape and a normalization if the PHA file contains a lot of the slew/post-slew time interval.
- 3) For fits to more complicated models (e.g. a power-law over a cutoff power-law), the BAT team has decided to require a chi-square improvement of more than 6 for each extra dof.
Time averaged spectrum fit using the average DRM
Power-law model
Multiple GTIs in the spectrum
tstart tstop
-30.376000 18.375600
19.680000 135.288000

Spectral model in power-law:
------------------------------------------------------------
Parameters  : value       lower 90%   higher 90%
Photon index: -1.56788     ( -0.240599   0.237517 )
Norm@50keV  : 1.02244E-03    ( -0.000145223   0.000144264 )
------------------------------------------------------------
#Fit statistic : Chi-Squared =          56.93 using 59 PHA bins.
# Reduced chi-squared =         0.9988 for     57 degrees of freedom
# Null hypothesis probability =   4.776447e-01

Photon flux (15-150 keV)    in 164.4 sec: 0.130119 ( -0.018636  0.018691 ) ph/cm2/s
Energy fluence (15-150 keV)             : 1.57871e-06 ( -2.38347e-07  2.40371e-07 ) ergs/cm2
Cutoff power-law model
Multiple GTIs in the spectrum
tstart tstop
-30.376000 18.375600
19.680000 135.288000
Spectral model in the cutoff power-law:
------------------------------------------------------------
Parameters  : value       lower 90%   higher 90%
Photon index: -1.16496     ( -0.619884   1.21356 )
Epeak [keV] : 104.125      ( -77.4542 -104.134 )
Norm@50keV  : 1.63586E-03    ( -0.00163572   0.00486251 )
------------------------------------------------------------
#Fit statistic : Chi-Squared =          56.46 using 59 PHA bins.
# Reduced chi-squared =          1.008 for     56 degrees of freedom
# Null hypothesis probability =   4.576963e-01

Photon flux (15-150 keV)    in 164.4 sec: 0.128029 ( -0.019489  0.019381 ) ph/cm2/s
Energy fluence (15-150 keV)             : 1.53848e-06 ( -2.618e-07  2.59321e-07 ) ergs/cm2
1-s peak spectrum fit
Power-law model
Time interval is from   37.132 sec. to   38.132 sec.

Spectral model in power-law:
------------------------------------------------------------
Parameters  : value       lower 90%   higher 90%
Photon index: -1.16745     ( -0.413042   0.453251 )
Norm@50keV  : 8.65383E-03    ( -0.00201546   0.00195418 )
------------------------------------------------------------
#Fit statistic : Chi-Squared =          45.69 using 59 PHA bins.
# Reduced chi-squared =         0.8016 for     57 degrees of freedom
# Null hypothesis probability =   8.587638e-01

Photon flux (15-150 keV)    in 1 sec: 1.01137 ( -0.24901  0.25139 ) ph/cm2/s
Energy fluence (15-150 keV)             : 8.86339e-08 ( -2.00898e-08  2.00912e-08 ) ergs/cm2
Cutoff power-law model
Time interval is from   37.132 sec. to   38.132 sec.
Spectral model in the cutoff power-law:
------------------------------------------------------------
Parameters  : value       lower 90%   higher 90%
Photon index: -2.60014     ( 2.60037   2.49959 )
Epeak [keV] : 190.706      (   )
Norm@50keV  : 1.37670E-03    (     )
------------------------------------------------------------
#Fit statistic : Chi-Squared =          45.60 using 59 PHA bins.
# Reduced chi-squared =         0.8143 for     56 degrees of freedom
# Null hypothesis probability =   8.382258e-01

Photon flux (15-150 keV)    in 1 sec: 1.01629 (    ) ph/cm2/s
Energy fluence (15-150 keV)             : 2.45697e-08 ( 0  0 ) ergs/cm2
Time-resolved spectra
Distribution
T90 vs. Hardness ratio plot
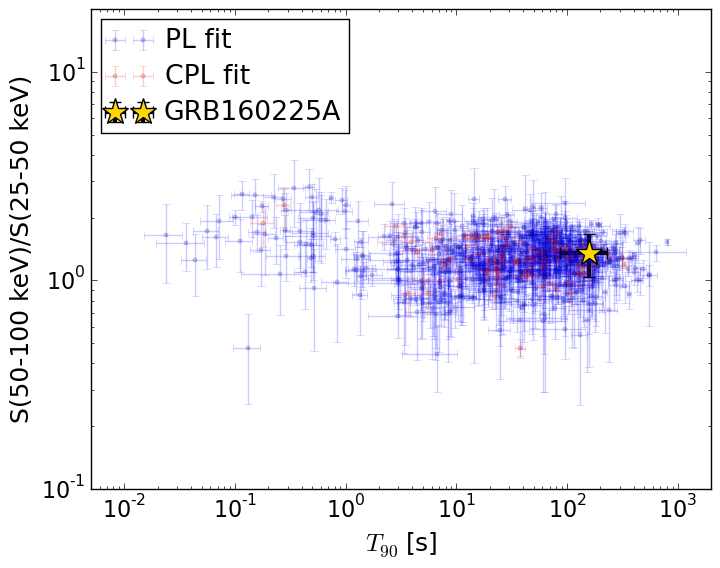
T90                                   = 157.456 sec.
Hardness ratio (energy fluence ratio) = 1.3492421434
S(15-50 keV) vs. S(50-150 keV) plot
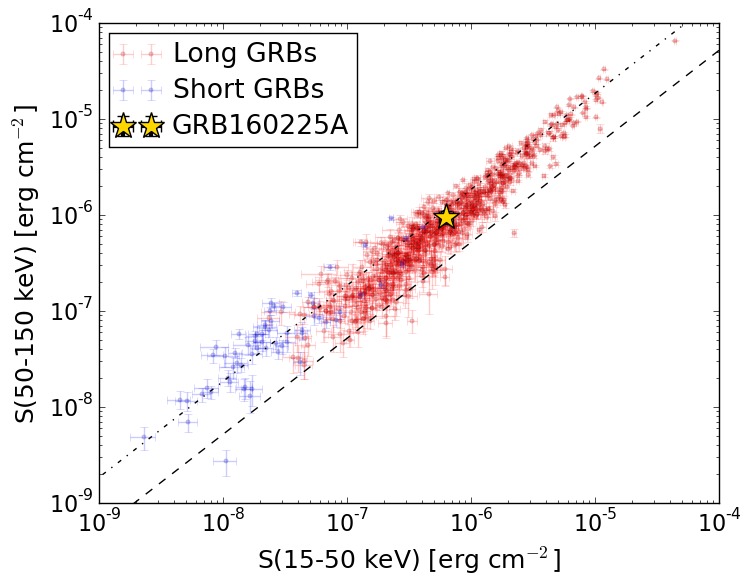
S(15-50 keV)  = 6.320259e-07
S(50-150 keV) = 9.466775e-07
The dash-dotted line and the dashed line traces the fluences calculated from the Band function with Epeak = 15 and 150 keV, respectively. Both lines assume a canonical values of alpha = -1 and beta = -2.5.
Mask shadow pattern
IMX = 8.333837529970634E-01, IMY = -3.030601412418512E-01
Spacecraft aspect plot
Bright source in the pre-burst/pre-slew/post-slew images
Pre-burst image of 15-350 keV band
Time interval of the image:
-239.320000 -30.376000

# RAcent  DECcent POSerr Theta    Phi  PeakCts   SNR AngSep     Name
#  [deg]    [deg]    ['] [deg]  [deg]                   [']
 83.6310  22.0196    0.3  27.4 -133.1   8.2756  39.2    0.3	Crab
155.8018  21.5593    3.3  40.5   70.8   2.4552   3.5 ------	UNKNOWN
201.9164  77.1989    2.8  57.2   -9.8   3.0541   4.0 ------	UNKNOWN
Pre-slew background subtracted image of 15-350 keV band
Time interval of the image:
-30.376000 18.375600
19.680000 109.580600

# RAcent  DECcent POSerr Theta    Phi  PeakCts   SNR AngSep     Name
#  [deg]    [deg]    ['] [deg]  [deg]                   [']
 83.6479  22.1255    6.3  27.3 -132.9   0.3148   1.8    6.7	Crab
164.2172  53.6606    1.0  41.6   20.0   2.8650  11.9 ------	UNKNOWN
158.9161  84.9356    2.7  52.9  -20.4   1.6212   4.4 ------	UNKNOWN
 69.3703  76.7328    2.1  47.0  -37.3   1.8605   5.5 ------	UNKNOWN
 70.4840   0.0809    2.7  51.3 -147.3   1.8948   4.3 ------	UNKNOWN
Post-slew image of 15-350 keV band
Time interval of the image:
262.380600 589.080600

# RAcent  DECcent POSerr Theta    Phi  PeakCts   SNR AngSep     Name
#  [deg]    [deg]    ['] [deg]  [deg]                   [']
135.5711 -40.5752    1.4  24.8   45.1   2.1490   8.1    2.3	Vela X-1
170.3694 -60.4619    4.5   4.8 -160.4   0.5474   2.6    9.8	Cen X-3
186.6240 -62.7580    2.7  12.6 -148.9   0.9658   4.3    1.2	GX 301-2
159.0653 -34.7702    2.5  24.9   92.4   1.3237   4.6 ------	UNKNOWN
162.2556 -43.0857    3.2  16.6   99.4   0.8057   3.6 ------	UNKNOWN
224.0643 -26.2464    2.7  54.1  177.1   3.9521   4.4 ------	UNKNOWN
 67.9782 -45.9225    2.0  53.0  -23.5   3.5485   5.7 ------	UNKNOWN
263.2729 -57.4277    2.3  48.0 -129.0   5.2337   4.9 ------	UNKNOWN
297.1695 -76.3783    4.9  41.1  -98.3   3.0613   2.4 ------	UNKNOWN