Analysis Summary
Notes:
- 1) No attempt has been made to eliminate the non-significant decimal places.
- 2) This batgrbproduct analysis is done using the HEASARC data.
- 3) This batgrbproduct analysis is using the flight position for the mask-weighting calculation.
======================================================================
                  BAT GRB EVENT DATA PROCESSING REPORT
    Process Script Ver: batgrbproduct v2.46
    Process Start Time: Thu Mar 17 18:00:38 EDT 2016
             Host Name: bat1
   Current Working Dir: /local/data/bat1/alien/Swift_3rdBATcatalog/event/batevent_reproc/trigger676595
======================================================================

  Trigger: 00676595      Segment: 000

  BAT Trigger Time: 478373688.384   [s; MET]
      Trigger Stop: 478373689.408   [s; MET]
               UTC: 2016-02-28T17:34:32.475720    [includes UTCF correction]
       Where From?: TDRSS position message

  BAT
    RA: 107.322435346999   Dec: 26.9564510226191  [deg; J2000]

     Catalogged Source?: NO
     Point Source?:      YES
     GRB Indicated?:     YES    [ by BAT flight software ]
     Image S/N Ratio:    10.09
     Image Trigger?:     NO
     Rate S/N Ratio:     29.9165506033032  [ if not an image trigger ]
     Image S/N Ratio:    10.09

  Analysis Position:   [ source = BAT ]
    RA: 107.322435346999   Dec: 26.9564510226191  [deg; J2000]

  Refined Position:   [ source = BAT pre-slew burst ]
    RA: 107.315275107078   Dec: 26.9511857867491  [deg; J2000]
        { 07h 09m 15.7s , +26d 57' 04.3" }
         +/- 1.35075461417458 [arcmin] (estimated 90% radius based on SNR)
         +/- 0.608133391071857 [arcmin] (formal 1-sigma fit error)
    SNR: 19.7961429085091

  Angular difference between the analysis and refined position is 0.496437 arcmin

  Partial Coding Fraction: 0.8125    [ including projection effects ]

  Duration
     T90: 98.9079999923706 +/- 23.8907387298692
        Measured from: 2.07599997520447
                   to: 100.983999967575     [s; relative to TRIGTIME]
     T50: 47.595999956131 +/- 4.79087295793669
        Measured from: 11.972000002861
                   to: 59.567999958992     [s; relative to TRIGTIME]


  Fluence
     Peak Flux  (peak 1 second)
        Measured from: -0.00800001621246338
                   to: 0.991999983787537     [s; relative to TRIGTIME]
     Total Fluence
        Measured from: -0.00800001621246338
                   to: 119.579999983311     [s; relative to TRIGTIME]

             Band 1     Band 2     Band 3     Band 4
              15-25      25-50     50-100    100-350     keV
 Total     0.766920   1.042985   0.898947   0.278507
           0.056938   0.059391   0.051974   0.045300 [error]
 Peak      0.025637   0.036924   0.067979   0.028048
           0.006034   0.006409   0.006376   0.005479 [error]

     [ fluence units of on-axis counts / fully illuminated detector ]

======================================================================


====== Table of the duration information =============================

        Value   tstart    tstop
T100  119.588   -0.008  119.580
T90    98.908    2.076  100.984
T50    47.596   11.972   59.568
Peak    1.000   -0.008    0.992


====== Spectral Analysis Summary =====================================

Model      : spectral model: simple power-law (PL) and cutoff power-law (CPL)
Ph_index   : photon index: E^{Ph_index}
Ph_90err   : 90% error of the photon index
Epeak      : Epeak in keV
Epeak_90err: 90% error of Epeak
Norm       : normalization at 50 keV in both the PL model and CPL model
Nomr_90err : 90% error of the normalization
chi2       : Chi-Squared
dof        : degree of freedo

=== Time-averaged spectral analysis ===
(Best model with acceptable fit: PL)

Model Ph_index Ph_90err_low Ph_90err_hi  Epeak  Epeak_90err_low  Epeak_90err_hi  Norm       Nomr_90err_low    Norm_90err_hi    chi2    dof
PL      -1.301    -0.108      0.109       -           -               -         1.64e-03     -9.60e-05          9.60e-05      41.180   57
CPL     -1.219    -0.183      0.378      509.538    -509.538      -509.538      1.79e-03     -2.43e-04          8.63e-04      41.220   56


=== 1-s peak spectral analysis ===
(Best model with acceptable fit: PL)

Model Ph_index Ph_90err_low Ph_90err_hi  Epeak  Epeak_90err_low  Epeak_90err_hi  Norm       Nomr_90err_low    Norm_90err_hi    chi2    dof
PL      -0.383     -0.250     0.273       -           -               -         9.63e-03     -1.55e-03          1.48e-03      42.190   57
CPL     -0.374     -0.249     0.386     9999.360    -9999.360      -9999.360      9.73e-03     -1.57e-03          7.85e-03      42.220   56


=== Fluence/Peak Flux Summary ===

              Model    Band1     Band2     Band3     Band4     Band5     Total
                       15-25     25-50    50-100    100-350    15-150    15-350    keV
Fluence         PL   2.07e-07  4.31e-07  6.99e-07  2.55e-06  1.93e-06  3.89e-06   erg/cm2
      90%_error_low -2.33e-08 -2.88e-08 -5.11e-08 -4.00e-07 -1.26e-07 -4.34e-07   erg/cm2
      90%_error_hi   2.42e-08  2.86e-08  5.09e-08  4.51e-07  1.27e-07  4.77e-07   erg/cm2
Peak flux       PL   1.38e-01  2.72e-01  4.16e-01  1.40e+00  1.17e+00  2.22e+00   ph/cm2/s
      90%_error_low -4.59e-02 -5.98e-02 -4.84e-02 -3.52e-01 -1.47e-01 -3.37e-01   ph/cm2/s
      90%_error_hi   5.51e-02  6.06e-02  4.82e-02  4.43e-01  1.48e-01  3.94e-01   ph/cm2/s

Fluence        CPL   2.07e-07  4.35e-07  7.01e-07  2.45e-06  1.93e-06  3.57e-06   erg/cm2
      90%_error_low -3.17e-08 -3.29e-08 -5.42e-08 -1.11e-06 -1.42e-07 -8.78e-07   erg/cm2
      90%_error_hi   2.05e-08  2.93e-08  5.74e-08  3.47e-07  1.32e-07  4.48e-07   erg/cm2
Peak flux      CPL   1.37e-01  2.72e-01  4.15e-01  1.40e+00  1.17e+00  2.04e+00   ph/cm2/s
      90%_error_low     N/A   -6.01e-02 -4.65e-02 -6.31e-01 -1.38e-01 -5.00e-01   ph/cm2/s
      90%_error_hi      N/A    4.50e-02  5.00e-02  4.37e-01  1.46e-01  5.58e-01   ph/cm2/s

======================================================================
Image
Pre-slew 15.0-350.0 keV image (Event data)
#   RAcent    DECcent   POSerr    Theta     Phi              Peak Cts       SNR   Name
  107.3153    26.9512   0.0097    21.6749    35.3397         0.9820134     19.796 TRIG_00676595

Foreground time interval of the image:
 -0.008  17.917 (delta_t =  17.925 [sec])
Background time interval of the image:
-787.183 -771.961 (delta_t =  15.222 [sec])
-239.384  -0.008 (delta_t = 239.376 [sec])
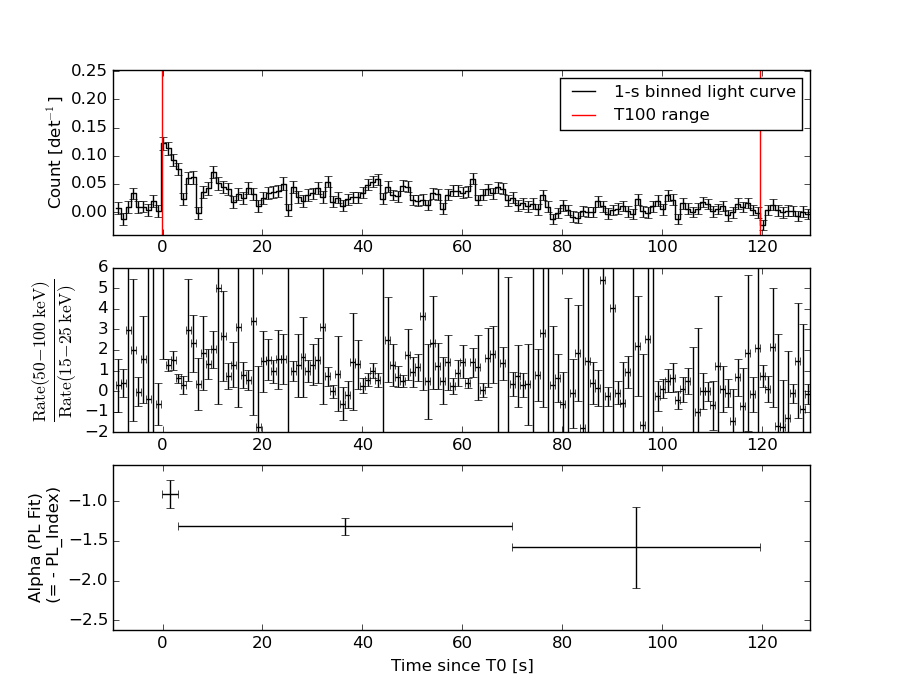
Light Curves
Note: The mask-weighted lightcurves have units of either count/det or counts/sec/det, where a det is 0.4 x 0.4 = 0.16 sq cm.
Full-time range; 1 s binning
Other quick-look light curves:
- 64 ms binning (zoomed)
- 16 ms binning (zoomed)
- 8 ms binning (zoomed)
- 2 ms binning (zoomed)
- SN=5 or 10 s binning (full-time range)
- Raw light curve
Spectra
- 64 ms binning (zoomed)
- 16 ms binning (zoomed)
- 8 ms binning (zoomed)
- 2 ms binning (zoomed)
- SN=5 or 10 s binning (full-time range)
- Raw light curve
Spectra
Notes:
- 1) The fitting includes the systematic errors.
- 2) When the burst includes telescope slew time periods, the fitting uses an average response file made from multiple 5-s response files through out the slew time plus single time preiod for the non-slew times, and weighted by the total counts in the corresponding time period using addrmf. An average response file is needed becuase a spectral fit using the pre-slew DRM will introduce some errors in both a spectral shape and a normalization if the PHA file contains a lot of the slew/post-slew time interval.
- 3) For fits to more complicated models (e.g. a power-law over a cutoff power-law), the BAT team has decided to require a chi-square improvement of more than 6 for each extra dof.
Time averaged spectrum fit using the average DRM
Power-law model
Time interval is from   -0.008 sec. to  119.580 sec.

Spectral model in power-law:
------------------------------------------------------------
Parameters  : value       lower 90%   higher 90%
Photon index: -1.301     ( -0.108439   0.108959 )
Norm@50keV  : 1.63628E-03    ( -9.60421e-05   9.60146e-05 )
------------------------------------------------------------
#Fit statistic : Chi-Squared =          41.18 using 59 PHA bins.
# Reduced chi-squared =         0.7224 for     57 degrees of freedom
# Null hypothesis probability =   9.432745e-01

Photon flux (15-150 keV)    in 119.6 sec: 0.195251 ( -0.011913  0.011944 ) ph/cm2/s
Energy fluence (15-150 keV)             : 1.93362e-06 ( -1.26276e-07  1.27014e-07 ) ergs/cm2
Cutoff power-law model

Time interval is from   -0.008 sec. to  119.580 sec.
Spectral model in the cutoff power-law:
------------------------------------------------------------
Parameters  : value       lower 90%   higher 90%
Photon index: -1.29721     ( -0.178346   0.382289 )
Epeak [keV] : 9995.80      ( -9995.31 -9995.31 )
Norm@50keV  : 1.64313E-03    ( -9.63514e-05   0.00100994 )
------------------------------------------------------------
#Fit statistic : Chi-Squared =          41.17 using 59 PHA bins.
# Reduced chi-squared =         0.7352 for     56 degrees of freedom
# Null hypothesis probability =   9.310547e-01

Photon flux (15-150 keV)    in 119.6 sec: 0.195000 ( -0.012839  0.012292 ) ph/cm2/s
Energy fluence (15-150 keV)             : 1.93055e-06 ( -1.42367e-07  1.31845e-07 ) ergs/cm2
1-s peak spectrum fit
Power-law model
Time interval is from   -0.008 sec. to    0.992 sec.

Spectral model in power-law:
------------------------------------------------------------
Parameters  : value       lower 90%   higher 90%
Photon index: -0.382976     ( -0.250281   0.272879 )
Norm@50keV  : 9.63035E-03    ( -0.00155281   0.00147929 )
------------------------------------------------------------
#Fit statistic : Chi-Squared =          42.19 using 59 PHA bins.
# Reduced chi-squared =         0.7402 for     57 degrees of freedom
# Null hypothesis probability =   9.286025e-01

Photon flux (15-150 keV)    in 1 sec: 1.16583 ( -0.14684  0.14803 ) ph/cm2/s
Energy fluence (15-150 keV)             : 1.37553e-07 ( -1.64988e-08  1.65106e-08 ) ergs/cm2
Cutoff power-law model
Time interval is from   -0.008 sec. to    0.992 sec.
Spectral model in the cutoff power-law:
------------------------------------------------------------
Parameters  : value       lower 90%   higher 90%
Photon index: -0.374378     ( -0.249536   0.385419 )
Epeak [keV] : 9999.36      ( -9999.36 -9999.36 )
Norm@50keV  : 9.72986E-03    ( -0.00157272   0.00785558 )
------------------------------------------------------------
#Fit statistic : Chi-Squared =          42.22 using 59 PHA bins.
# Reduced chi-squared =         0.7539 for     56 degrees of freedom
# Null hypothesis probability =   9.136209e-01

Photon flux (15-150 keV)    in 1 sec: 1.16764 ( -0.13787  0.14649 ) ph/cm2/s
Energy fluence (15-150 keV)             : 5.72888e-10 ( 0  0 ) ergs/cm2
Time-resolved spectra
Distribution
T90 vs. Hardness ratio plot
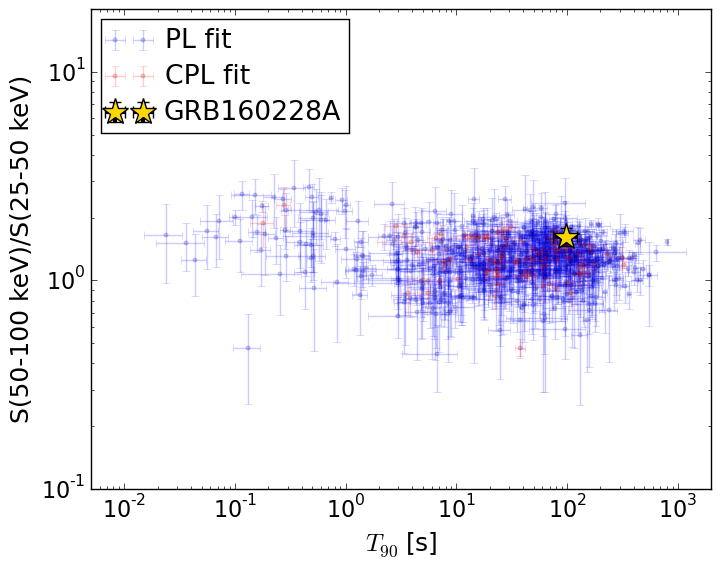
T90                                   = 98.908 sec.
Hardness ratio (energy fluence ratio) = 1.62341686464
S(15-50 keV) vs. S(50-150 keV) plot
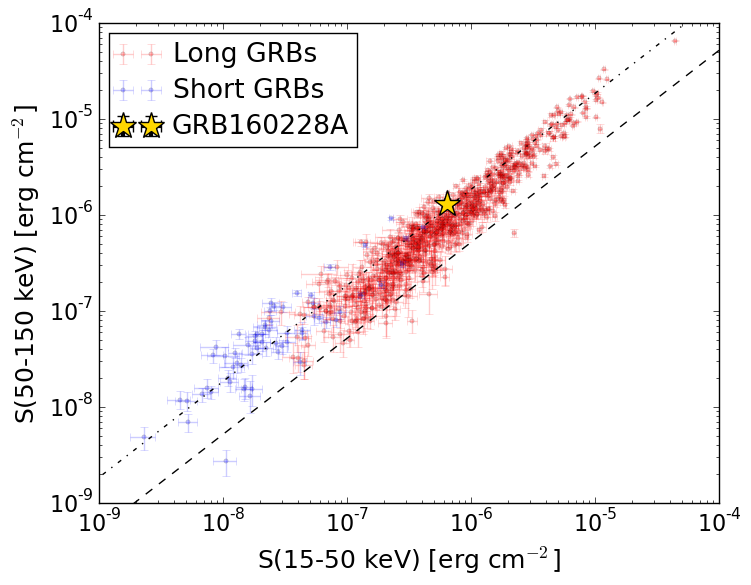
S(15-50 keV)  = 6.380516e-07
S(50-150 keV) = 1.2955582e-06
The dash-dotted line and the dashed line traces the fluences calculated from the Band function with Epeak = 15 and 150 keV, respectively. Both lines assume a canonical values of alpha = -1 and beta = -2.5.
Mask shadow pattern
IMX = 3.242073016236385E-01, IMY = -2.298890802045160E-01
Spacecraft aspect plot
Bright source in the pre-burst/pre-slew/post-slew images
Pre-burst image of 15-350 keV band
Time interval of the image:
-787.183400 -771.961400
-239.384000 -0.008000

# RAcent  DECcent POSerr Theta    Phi  PeakCts   SNR AngSep     Name
#  [deg]    [deg]    ['] [deg]  [deg]                   [']
 83.6318  22.0142    0.2  16.4  -34.9  10.5889  54.3    0.1	Crab
134.4779  10.4815    3.1  39.7   86.8   3.4717   3.7 ------	UNKNOWN
 92.0826  36.5656    2.6  27.5   -1.5   0.9774   4.5 ------	UNKNOWN
 80.7434  61.3776    2.9  53.2   -5.8   2.2083   4.0 ------	UNKNOWN
 62.6885 -20.9474    2.4  43.2 -132.2   2.3952   4.8 ------	UNKNOWN
 50.8183  22.9950    3.0  43.8  -64.0   4.2249   3.8 ------	UNKNOWN
Pre-slew background subtracted image of 15-350 keV band
Time interval of the image:
-0.008000 17.916590

# RAcent  DECcent POSerr Theta    Phi  PeakCts   SNR AngSep     Name
#  [deg]    [deg]    ['] [deg]  [deg]                   [']
 83.7789  22.1780    0.0  16.4  -34.2   0.1489   3.3   12.7	Crab
107.3153  26.9512    0.6  21.7   35.3   0.9820  19.8 ------	UNKNOWN
 96.6223 -48.0676    2.3  57.3 -179.7   1.3448   4.9 ------	UNKNOWN
 93.9367 -12.9028    2.0  22.1 -177.0   0.2548   5.8 ------	UNKNOWN
 55.3440  56.3326    2.4  56.1  -22.6   0.8806   4.9 ------	UNKNOWN
 52.2276  13.3678    2.5  41.4  -77.9   0.8640   4.7 ------	UNKNOWN
Post-slew image of 15-350 keV band
Time interval of the image:
62.116610 949.916600

# RAcent  DECcent POSerr Theta    Phi  PeakCts   SNR AngSep     Name
#  [deg]    [deg]    ['] [deg]  [deg]                   [']
 83.6333  22.0205    0.2  22.1 -107.6  37.2313  59.8    0.4	Crab
115.2800  64.2915    3.1  37.7   -4.2   3.1108   3.7 ------	UNKNOWN
116.2055  71.5212    2.4  44.8   -5.9   4.9693   4.8 ------	UNKNOWN
 68.9371  -9.7386    3.0  52.3 -139.2  11.5141   3.8 ------	UNKNOWN
 56.8037  43.5004    3.1  43.7  -64.0  11.5280   3.7 ------	UNKNOWN
 61.2034  27.3767    3.9  40.8  -88.3   8.6557   3.0 ------	UNKNOWN