Analysis Summary
Notes:
- 1) No attempt has been made to eliminate the non-significant decimal places.
- 2) This batgrbproduct analysis is done using the HEASARC data.
- 3) This batgrbproduct analysis is using the flight position for the mask-weighting calculation.
======================================================================
BAT GRB EVENT DATA PROCESSING REPORT
Process Script Ver: batgrbproduct v2.46
Process Start Time: Mon Mar 28 15:39:30 EDT 2016
Host Name: bat1
Current Working Dir: /local/data/bat1/alien/Swift_3rdBATcatalog/event/batevent_reproc/trigger677495
======================================================================
Trigger: 00677495 Segment: 000
BAT Trigger Time: 478695297.984 [s; MET]
Trigger Stop: 478695298.24 [s; MET]
UTC: 2016-03-03T10:54:42.058240 [includes UTCF correction]
Where From?: TDRSS position message
BAT
RA: 168.681372288036 Dec: 22.7424795077935 [deg; J2000]
Catalogged Source?: NO
Point Source?: YES
GRB Indicated?: YES [ by BAT flight software ]
Image S/N Ratio: 8.2
Image Trigger?: NO
Rate S/N Ratio: 29.4108823397055 [ if not an image trigger ]
Image S/N Ratio: 8.2
Analysis Position: [ source = BAT ]
RA: 168.681372288036 Dec: 22.7424795077935 [deg; J2000]
Refined Position: [ source = BAT pre-slew burst ]
RA: 168.714337841967 Dec: 22.708156718444 [deg; J2000]
{ 11h 14m 51.4s , +22d 42' 29.4" }
+/- 2.01008996009481 [arcmin] (estimated 90% radius based on SNR)
+/- 1.05890206865951 [arcmin] (formal 1-sigma fit error)
SNR: 11.218980366806
Angular difference between the analysis and refined position is 2.751247 arcmin
Partial Coding Fraction: 0.9609375 [ including projection effects ]
Duration
T90: 4.97599995136261 +/- 1.00625245213938
Measured from: -0.0120000243186951
to: 4.96399992704391 [s; relative to TRIGTIME]
T50: 1.57199990749359 +/- 1.49214611727068
Measured from: 0.171999990940094
to: 1.74399989843369 [s; relative to TRIGTIME]
Fluence
Peak Flux (peak 1 second)
Measured from: -0.0879999995231628
to: 0.912000000476837 [s; relative to TRIGTIME]
Total Fluence
Measured from: -0.0879999995231628
to: 5.31999999284744 [s; relative to TRIGTIME]
Band 1 Band 2 Band 3 Band 4
15-25 25-50 50-100 100-350 keV
Total 0.040896 0.073038 0.058930 0.046892
0.011604 0.012297 0.010870 0.009448 [error]
Peak 0.018298 0.042181 0.046754 0.021379
0.005351 0.005763 0.005391 0.004693 [error]
[ fluence units of on-axis counts / fully illuminated detector ]
======================================================================
====== Table of the duration information =============================
Value tstart tstop
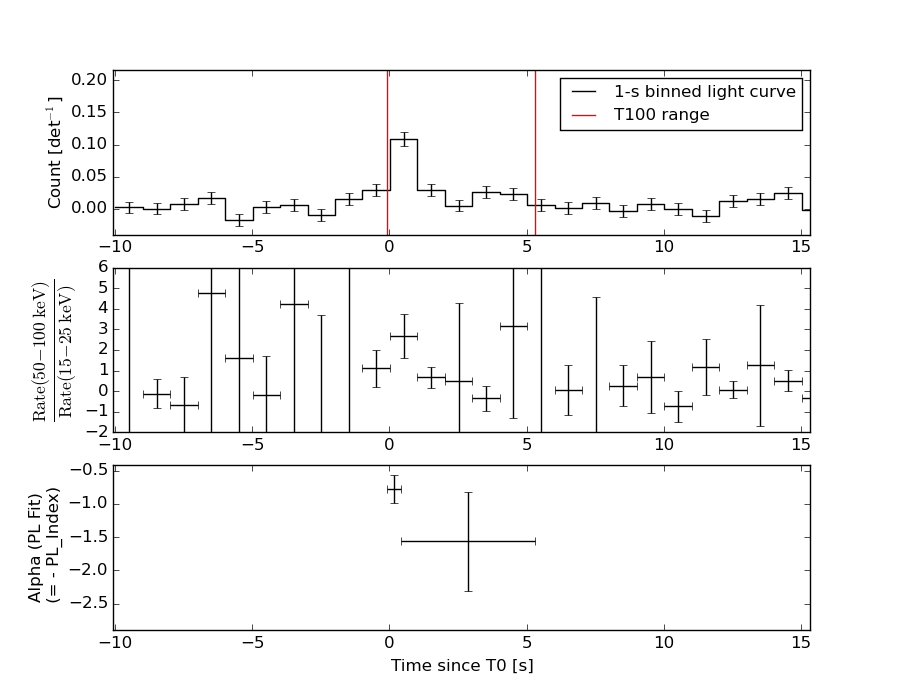
T100 5.408 -0.088 5.320
T90 4.976 -0.012 4.964
T50 1.572 0.172 1.744
Peak 1.000 -0.088 0.912
====== Spectral Analysis Summary =====================================
Model : spectral model: simple power-law (PL) and cutoff power-law (CPL)
Ph_index : photon index: E^{Ph_index}
Ph_90err : 90% error of the photon index
Epeak : Epeak in keV
Epeak_90err: 90% error of Epeak
Norm : normalization at 50 keV in both the PL model and CPL model
Nomr_90err : 90% error of the normalization
chi2 : Chi-Squared
dof : degree of freedo
=== Time-averaged spectral analysis ===
(Best model with acceptable fit: PL)
Model Ph_index Ph_90err_low Ph_90err_hi Epeak Epeak_90err_low Epeak_90err_hi Norm Nomr_90err_low Norm_90err_hi chi2 dof
PL -1.052 -0.322 0.346 - - - 2.57e-03 -4.38e-04 4.34e-04 54.490 57
CPL -1.065 -0.306 0.383 9999.360 -9999.360 -9999.360 2.59e-03 -4.35e-04 1.91e-03 54.520 56
=== 1-s peak spectral analysis ===
(Best model with acceptable fit: PL)
Model Ph_index Ph_90err_low Ph_90err_hi Epeak Epeak_90err_low Epeak_90err_hi Norm Nomr_90err_low Norm_90err_hi chi2 dof
PL -0.803 -0.238 0.254 - - - 8.25e-03 -1.17e-03 1.15e-03 43.860 57
CPL -0.506 -0.508 1.163 299.331 -299.331 -299.331 1.10e-02 N/A N/A 43.580 56
=== Fluence/Peak Flux Summary ===
Model Band1 Band2 Band3 Band4 Band5 Total
15-25 25-50 50-100 100-350 15-150 15-350 keV
Fluence PL 1.17e-08 2.83e-08 5.46e-08 2.59e-07 1.48e-07 3.53e-07 erg/cm2
90%_error_low -4.12e-09 -6.21e-09 -1.06e-08 -1.02e-07 -2.70e-08 -1.09e-07 erg/cm2
90%_error_hi 4.58e-09 5.88e-09 1.03e-08 1.48e-07 2.73e-08 1.49e-07 erg/cm2
Peak flux PL 1.75e-01 2.67e-01 3.06e-01 6.72e-01 9.48e-01 1.42e+00 ph/cm2/s
90%_error_low -5.08e-02 -5.02e-02 -4.16e-02 -1.84e-01 -1.30e-01 -2.10e-01 ph/cm2/s
90%_error_hi 5.71e-02 4.93e-02 4.14e-02 2.32e-01 1.30e-01 2.26e-01 ph/cm2/s
Fluence CPL 1.17e-08 2.80e-08 5.30e-08 2.65e-07 1.48e-07 3.45e-07 erg/cm2
90%_error_low N/A -5.87e-09 -8.99e-09 -1.68e-07 -2.75e-08 -1.41e-07 erg/cm2
90%_error_hi N/A 6.23e-09 1.20e-08 1.57e-07 2.68e-08 1.20e-07 erg/cm2
Peak flux CPL 1.60e-01 2.70e-01 3.17e-01 4.98e-01 9.36e-01 1.25e+00 ph/cm2/s
90%_error_low -6.52e-02 -5.23e-02 -4.98e-02 -2.91e-01 -1.36e-01 -3.32e-01 ph/cm2/s
90%_error_hi 6.78e-02 5.29e-02 5.45e-02 2.13e-01 1.33e-01 2.23e-01 ph/cm2/s
======================================================================
Image
Pre-slew 15.0-350.0 keV image (Event data)
#   RAcent    DECcent   POSerr    Theta     Phi              Peak Cts       SNR   Name
  168.7143    22.7082   0.0172    22.5514  -171.1635         0.2339239     11.219 TRIG_00677495

Foreground time interval of the image:
 -0.088   5.320 (delta_t =   5.408 [sec])
Background time interval of the image:
-244.083  -0.088 (delta_t = 243.995 [sec])
Light Curves
Note: The mask-weighted lightcurves have units of either count/det or counts/sec/det, where a det is 0.4 x 0.4 = 0.16 sq cm.
Full-time range; 1 s binning
Other quick-look light curves:
- 64 ms binning (zoomed)
- 16 ms binning (zoomed)
- 8 ms binning (zoomed)
- 2 ms binning (zoomed)
- SN=5 or 10 s binning (full-time range)
- Raw light curve
Spectra
- 64 ms binning (zoomed)
- 16 ms binning (zoomed)
- 8 ms binning (zoomed)
- 2 ms binning (zoomed)
- SN=5 or 10 s binning (full-time range)
- Raw light curve
Spectra
Notes:
- 1) The fitting includes the systematic errors.
- 2) When the burst includes telescope slew time periods, the fitting uses an average response file made from multiple 5-s response files through out the slew time plus single time preiod for the non-slew times, and weighted by the total counts in the corresponding time period using addrmf. An average response file is needed becuase a spectral fit using the pre-slew DRM will introduce some errors in both a spectral shape and a normalization if the PHA file contains a lot of the slew/post-slew time interval.
- 3) For fits to more complicated models (e.g. a power-law over a cutoff power-law), the BAT team has decided to require a chi-square improvement of more than 6 for each extra dof.
Time averaged spectrum fit using the average DRM
Power-law model
Time interval is from   -0.088 sec. to    5.320 sec.

Spectral model in power-law:
------------------------------------------------------------
Parameters  : value       lower 90%   higher 90%
Photon index: -1.0516     ( -0.32183   0.346065 )
Norm@50keV  : 2.57135E-03    ( -0.000438346   0.000434243 )
------------------------------------------------------------
#Fit statistic : Chi-Squared =          54.49 using 59 PHA bins.
# Reduced chi-squared =         0.9559 for     57 degrees of freedom
# Null hypothesis probability =   5.699589e-01

Photon flux (15-150 keV)    in 5.408 sec: 0.297016 ( -0.05209  0.05226 ) ph/cm2/s
Energy fluence (15-150 keV)             : 1.47729e-07 ( -2.70489e-08  2.72783e-08 ) ergs/cm2
Cutoff power-law model

Time interval is from   -0.088 sec. to    5.320 sec.
Spectral model in the cutoff power-law:
------------------------------------------------------------
Parameters  : value       lower 90%   higher 90%
Photon index: -1.06521     ( -0.306888   0.381496 )
Epeak [keV] : 9999.36      ( -9999.36 -9999.36 )
Norm@50keV  : 2.58949E-03    ( -0.000434014   0.00191444 )
------------------------------------------------------------
#Fit statistic : Chi-Squared =          54.52 using 59 PHA bins.
# Reduced chi-squared =         0.9736 for     56 degrees of freedom
# Null hypothesis probability =   5.310604e-01

Photon flux (15-150 keV)    in 5.408 sec: 0.301659 ( -0.056793  0.04755 ) ph/cm2/s
Energy fluence (15-150 keV)             : 1.48111e-07 ( -2.75079e-08  2.67801e-08 ) ergs/cm2
1-s peak spectrum fit
Power-law model

Time interval is from   -0.088 sec. to    0.912 sec.

Spectral model in power-law:
------------------------------------------------------------
Parameters  : value       lower 90%   higher 90%
Photon index: -0.803042     ( -0.237819   0.253919 )
Norm@50keV  : 8.25025E-03    ( -0.00116714   0.00114651 )
------------------------------------------------------------
#Fit statistic : Chi-Squared =          43.86 using 59 PHA bins.
# Reduced chi-squared =         0.7695 for     57 degrees of freedom
# Null hypothesis probability =   8.991643e-01

Photon flux (15-150 keV)    in 1 sec: 0.948107 ( -0.129706  0.130353 ) ph/cm2/s
Energy fluence (15-150 keV)             : 9.62986e-08 ( -1.34701e-08  1.35539e-08 ) ergs/cm2
Cutoff power-law model
Time interval is from   -0.088 sec. to    0.912 sec.
Spectral model in the cutoff power-law:
------------------------------------------------------------
Parameters  : value       lower 90%   higher 90%
Photon index: -0.505937     ( -0.507626   1.16264 )
Epeak [keV] : 299.331      ( -299.168 -299.168 )
Norm@50keV  : 1.10493E-02    (     )
------------------------------------------------------------
#Fit statistic : Chi-Squared =          43.58 using 59 PHA bins.
# Reduced chi-squared =         0.7782 for     56 degrees of freedom
# Null hypothesis probability =   8.867404e-01

Photon flux (15-150 keV)    in 1 sec: 0.936113 ( -0.13572  0.133227 ) ph/cm2/s
Energy fluence (15-150 keV)             : 9.48943e-08 ( -1.46914e-08  1.28092e-08 ) ergs/cm2
Time-resolved spectra
Distribution
T90 vs. Hardness ratio plot
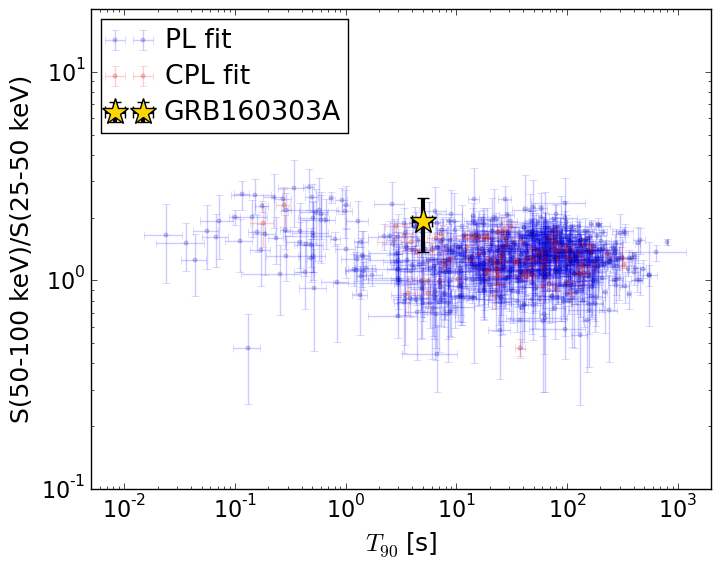
T90                                   = 4.976 sec.
Hardness ratio (energy fluence ratio) = 1.92974455973
S(15-50 keV) vs. S(50-150 keV) plot
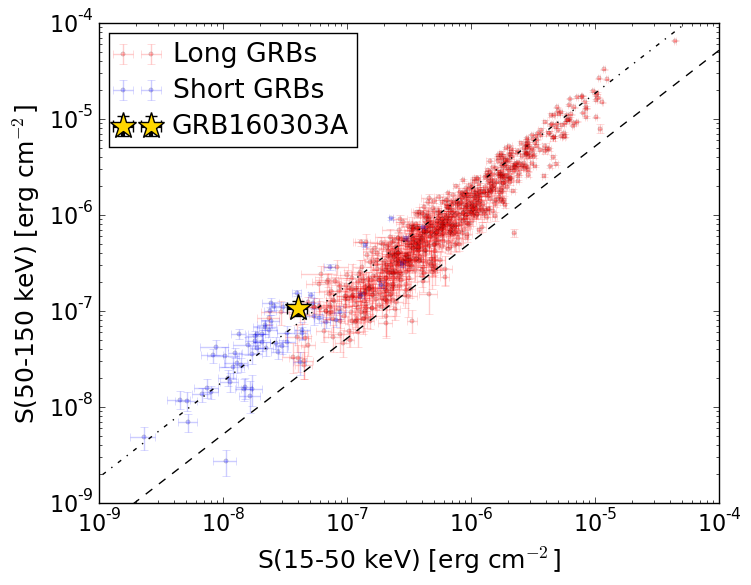
S(15-50 keV)  = 3.998148e-08
S(50-150 keV) = 1.0774853e-07
The dash-dotted line and the dashed line traces the fluences calculated from the Band function with Epeak = 15 and 150 keV, respectively. Both lines assume a canonical values of alpha = -1 and beta = -2.5.
Mask shadow pattern

IMX = -4.103354961843101E-01, IMY = 6.379121452094097E-02
Spacecraft aspect plot
Bright source in the pre-burst/pre-slew/post-slew images
Pre-burst image of 15-350 keV band
Time interval of the image:
-244.083380 -0.088000

# RAcent  DECcent POSerr Theta    Phi  PeakCts   SNR AngSep     Name
#  [deg]    [deg]    ['] [deg]  [deg]                   [']
157.6604   9.3596    3.3  18.0  139.8   0.6779   3.4 ------	UNKNOWN
197.9386  48.5221    3.6  52.3 -139.4   3.5602   3.2 ------	UNKNOWN
Pre-slew background subtracted image of 15-350 keV band
Time interval of the image:
-0.088000 5.320000

# RAcent  DECcent POSerr Theta    Phi  PeakCts   SNR AngSep     Name
#  [deg]    [deg]    ['] [deg]  [deg]                   [']
168.7143  22.7082    1.0  22.6 -171.2   0.2339  11.2 ------	UNKNOWN
Post-slew image of 15-350 keV band
Time interval of the image:
86.316600 962.096000

# RAcent  DECcent POSerr Theta    Phi  PeakCts   SNR AngSep     Name
#  [deg]    [deg]    ['] [deg]  [deg]                   [']
124.7451  14.3207    2.9  42.4  162.4   0.8753   4.0 ------	UNKNOWN
102.0163  42.6873    4.2  58.0 -156.9   1.8783   2.7 ------	UNKNOWN