Analysis Summary
Notes:
- 1) No attempt has been made to eliminate the non-significant decimal places.
- 2) This batgrbproduct analysis is done using the HEASARC data.
- 3) This batgrbproduct analysis is using the flight position for the mask-weighting calculation.
======================================================================
BAT GRB EVENT DATA PROCESSING REPORT
Process Script Ver: batgrbproduct v2.46
Process Start Time: Mon Mar 28 14:22:03 EDT 2016
Host Name: bat1
Current Working Dir: /local/data/bat1/alien/Swift_3rdBATcatalog/event/batevent_reproc/trigger678929
======================================================================
Trigger: 00678929 Segment: 000
BAT Trigger Time: 479529451.776 [s; MET]
Trigger Stop: 479529478.656 [s; MET]
UTC: 2016-03-13T02:37:15.804900 [includes UTCF correction]
Where From?: TDRSS position message
BAT
RA: 183.787873774764 Dec: 57.2928358615757 [deg; J2000]
Catalogged Source?: NO
Point Source?: YES
GRB Indicated?: YES [ by BAT flight software ]
Image S/N Ratio: 8.71
Image Trigger?: NO
Rate S/N Ratio: 9.89949493661167 [ if not an image trigger ]
Image S/N Ratio: 8.71
Analysis Position: [ source = BAT ]
RA: 183.787873774764 Dec: 57.2928358615757 [deg; J2000]
Refined Position: [ source = BAT pre-slew burst ]
RA: 183.819620681679 Dec: 57.2799178763181 [deg; J2000]
{ 12h 15m 16.7s , +57d 16' 47.7" }
+/- 2.00346933649191 [arcmin] (estimated 90% radius based on SNR)
+/- 0.93537714587284 [arcmin] (formal 1-sigma fit error)
SNR: 11.2719807218026
Angular difference between the analysis and refined position is 1.288601 arcmin
Partial Coding Fraction: 0.8046875 [ including projection effects ]
Duration
T90: 41.5359999537468 +/- 6.18321240663874
Measured from: -1.45200002193451
to: 40.0839999318123 [s; relative to TRIGTIME]
T50: 22.3679999709129 +/- 5.97979697204795
Measured from: 5.83199995756149
to: 28.1999999284744 [s; relative to TRIGTIME]
Fluence
Peak Flux (peak 1 second)
Measured from: 24.7919999957085
to: 25.7919999957085 [s; relative to TRIGTIME]
Total Fluence
Measured from: -5.60400003194809
to: 44.6559999585152 [s; relative to TRIGTIME]
Band 1 Band 2 Band 3 Band 4
15-25 25-50 50-100 100-350 keV
Total 0.268840 0.269509 0.329309 0.083141
0.038766 0.040436 0.034956 0.029407 [error]
Peak 0.013690 0.019137 0.010443 0.009083
0.005538 0.005901 0.004941 0.004190 [error]
[ fluence units of on-axis counts / fully illuminated detector ]
======================================================================
====== Table of the duration information =============================
Value tstart tstop
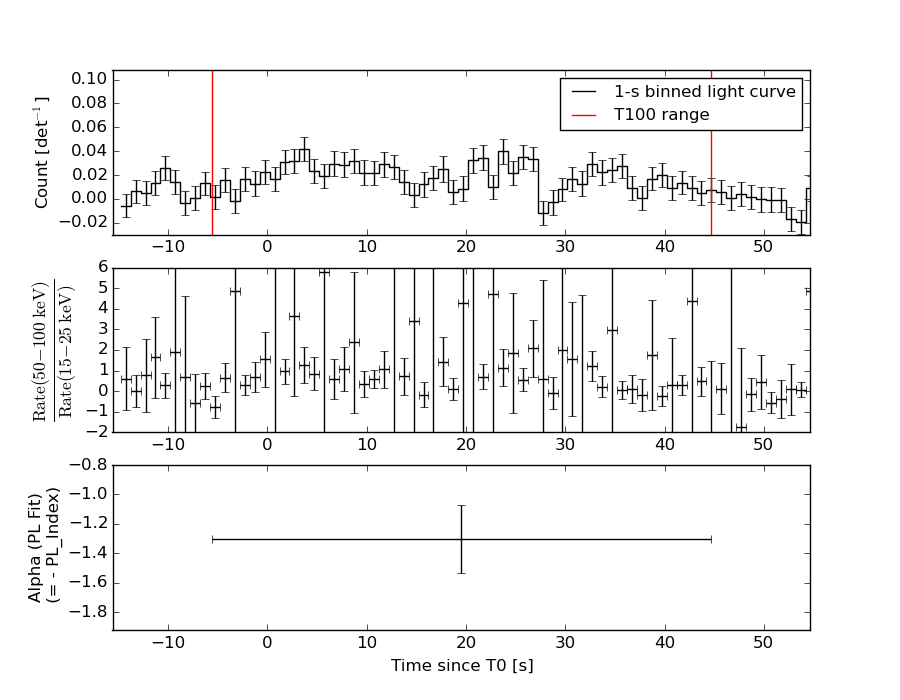
T100 50.260 -5.604 44.656
T90 41.536 -1.452 40.084
T50 22.368 5.832 28.200
Peak 1.000 24.792 25.792
====== Spectral Analysis Summary =====================================
Model : spectral model: simple power-law (PL) and cutoff power-law (CPL)
Ph_index : photon index: E^{Ph_index}
Ph_90err : 90% error of the photon index
Epeak : Epeak in keV
Epeak_90err: 90% error of Epeak
Norm : normalization at 50 keV in both the PL model and CPL model
Nomr_90err : 90% error of the normalization
chi2 : Chi-Squared
dof : degree of freedo
=== Time-averaged spectral analysis ===
(Best model with acceptable fit: N/A)
Model Ph_index Ph_90err_low Ph_90err_hi Epeak Epeak_90err_low Epeak_90err_hi Norm Nomr_90err_low Norm_90err_hi chi2 dof
PL -1.304 -0.234 0.235 - - - 1.20e-03 -1.52e-04 1.51e-04 75.620 57
CPL -1.305 -0.230 0.637 9999.320 -9999.320 -9999.320 1.21e-03 -1.21e-03 1.07e-03 75.630 56
=== 1-s peak spectral analysis ===
(Best model with acceptable fit: N/A)
Model Ph_index Ph_90err_low Ph_90err_hi Epeak Epeak_90err_low Epeak_90err_hi Norm Nomr_90err_low Norm_90err_hi chi2 dof
PL -1.690 -0.798 0.703 - - - 2.68e-03 -1.22e-03 1.11e-03 69.010 57
CPL -1.694 -1.108 1.043 9999.140 -9999.130 -9999.140 2.67e-03 N/A N/A 69.010 56
=== Fluence/Peak Flux Summary ===
Model Band1 Band2 Band3 Band4 Band5 Total
15-25 25-50 50-100 100-350 15-150 15-350 keV
Fluence PL 6.43e-08 1.33e-07 2.16e-07 7.85e-07 5.97e-07 1.20e-06 erg/cm2
90%_error_low -1.49e-08 -1.89e-08 -3.47e-08 -2.50e-07 -8.47e-08 -2.77e-07 erg/cm2
90%_error_hi 1.59e-08 1.85e-08 3.41e-08 3.23e-07 8.55e-08 3.39e-07 erg/cm2
Peak flux PL 1.33e-01 1.19e-01 7.39e-02 6.97e-02 3.55e-01 3.95e-01 ph/cm2/s
90%_error_low -7.20e-02 -4.48e-02 -4.13e-02 -6.97e-02 -1.32e-01 -1.50e-01 ph/cm2/s
90%_error_hi 7.99e-02 4.44e-02 4.14e-02 1.12e-01 1.32e-01 1.54e-01 ph/cm2/s
Fluence CPL 6.54e-08 1.32e-07 2.14e-07 8.44e-07 6.00e-07 1.15e-06 erg/cm2
90%_error_low -1.92e-08 N/A -3.87e-08 -5.15e-07 -1.03e-07 -4.23e-07 erg/cm2
90%_error_hi 1.70e-08 N/A 4.32e-08 9.30e-08 9.77e-08 3.69e-07 erg/cm2
Peak flux CPL 1.35e-01 1.19e-01 7.31e-02 7.59e-02 3.56e-01 3.94e-01 ph/cm2/s
90%_error_low -8.12e-02 -4.36e-02 -4.05e-02 N/A -1.32e-01 -1.63e-01 ph/cm2/s
90%_error_hi 4.14e-02 4.49e-02 4.37e-02 N/A 1.31e-01 1.52e-01 ph/cm2/s
======================================================================
Image
Pre-slew 15.0-350.0 keV image (Event data)
#   RAcent    DECcent   POSerr    Theta     Phi              Peak Cts       SNR   Name
  183.8196    57.2799   0.0171    17.9582  -102.9766         0.9208755     11.272 TRIG_00678929

Foreground time interval of the image:
 -5.604  44.656 (delta_t =  50.260 [sec])
Background time interval of the image:
-239.275  -5.604 (delta_t = 233.671 [sec])
Light Curves
Note: The mask-weighted lightcurves have units of either count/det or counts/sec/det, where a det is 0.4 x 0.4 = 0.16 sq cm.
Full-time range; 1 s binning
Other quick-look light curves:
- 64 ms binning (zoomed)
- 16 ms binning (zoomed)
- 8 ms binning (zoomed)
- 2 ms binning (zoomed)
- SN=5 or 10 s binning (full-time range)
- Raw light curve
Spectra
- 64 ms binning (zoomed)
- 16 ms binning (zoomed)
- 8 ms binning (zoomed)
- 2 ms binning (zoomed)
- SN=5 or 10 s binning (full-time range)
- Raw light curve
Spectra
Notes:
- 1) The fitting includes the systematic errors.
- 2) When the burst includes telescope slew time periods, the fitting uses an average response file made from multiple 5-s response files through out the slew time plus single time preiod for the non-slew times, and weighted by the total counts in the corresponding time period using addrmf. An average response file is needed becuase a spectral fit using the pre-slew DRM will introduce some errors in both a spectral shape and a normalization if the PHA file contains a lot of the slew/post-slew time interval.
- 3) For fits to more complicated models (e.g. a power-law over a cutoff power-law), the BAT team has decided to require a chi-square improvement of more than 6 for each extra dof.
Time averaged spectrum fit using the average DRM
Power-law model
Time interval is from   -5.604 sec. to   44.656 sec.

Spectral model in power-law:
------------------------------------------------------------
Parameters  : value       lower 90%   higher 90%
Photon index: -1.30371     ( -0.233708   0.235242 )
Norm@50keV  : 1.20329E-03    ( -0.000151628   0.000151411 )
------------------------------------------------------------
#Fit statistic : Chi-Squared =          75.62 using 59 PHA bins.
# Reduced chi-squared =          1.327 for     57 degrees of freedom
# Null hypothesis probability =   5.004063e-02

Photon flux (15-150 keV)    in 50.26 sec: 0.143656 ( -0.018527  0.018599 ) ph/cm2/s
Energy fluence (15-150 keV)             : 5.97149e-07 ( -8.46861e-08  8.5539e-08 ) ergs/cm2
Cutoff power-law model

Time interval is from   -5.604 sec. to   44.656 sec.
Spectral model in the cutoff power-law:
------------------------------------------------------------
Parameters  : value       lower 90%   higher 90%
Photon index: -1.30547     ( -0.230038   0.63704 )
Epeak [keV] : 9999.32      ( -9999.36 -9999.36 )
Norm@50keV  : 1.20549E-03    ( -0.00120792   0.00106483 )
------------------------------------------------------------
#Fit statistic : Chi-Squared =          75.63 using 59 PHA bins.
# Reduced chi-squared =          1.351 for     56 degrees of freedom
# Null hypothesis probability =   4.134737e-02

Photon flux (15-150 keV)    in 50.26 sec: 0.144593 (    ) ph/cm2/s
Energy fluence (15-150 keV)             : 6.00155e-07 ( -1.02724e-07  9.76959e-08 ) ergs/cm2
1-s peak spectrum fit
Power-law model
Time interval is from   24.792 sec. to   25.792 sec.

Spectral model in power-law:
------------------------------------------------------------
Parameters  : value       lower 90%   higher 90%
Photon index: -1.69041     ( -0.797865   0.703255 )
Norm@50keV  : 2.68253E-03    ( -0.00122336   0.00111309 )
------------------------------------------------------------
#Fit statistic : Chi-Squared =          69.01 using 59 PHA bins.
# Reduced chi-squared =          1.211 for     57 degrees of freedom
# Null hypothesis probability =   1.323051e-01

Photon flux (15-150 keV)    in 1 sec: 0.355099 ( -0.131712  0.131752 ) ph/cm2/s
Energy fluence (15-150 keV)             : 2.48599e-08 ( -1.09546e-08  1.16382e-08 ) ergs/cm2
Cutoff power-law model

Time interval is from   24.792 sec. to   25.792 sec.
Spectral model in the cutoff power-law:
------------------------------------------------------------
Parameters  : value       lower 90%   higher 90%
Photon index: -1.6942     ( -1.10829   1.04221 )
Epeak [keV] : 9999.14      ( -9999.34 -9999.35 )
Norm@50keV  : 2.66864E-03    (     )
------------------------------------------------------------
#Fit statistic : Chi-Squared =          69.01 using 59 PHA bins.
# Reduced chi-squared =          1.232 for     56 degrees of freedom
# Null hypothesis probability =   1.137162e-01

Photon flux (15-150 keV)    in 1 sec: 0.355642 ( -0.132468  0.131373 ) ph/cm2/s
Energy fluence (15-150 keV)             : 2.50484e-08 ( -1.18306e-08  8.00529e-09 ) ergs/cm2
Time-resolved spectra
Distribution
T90 vs. Hardness ratio plot
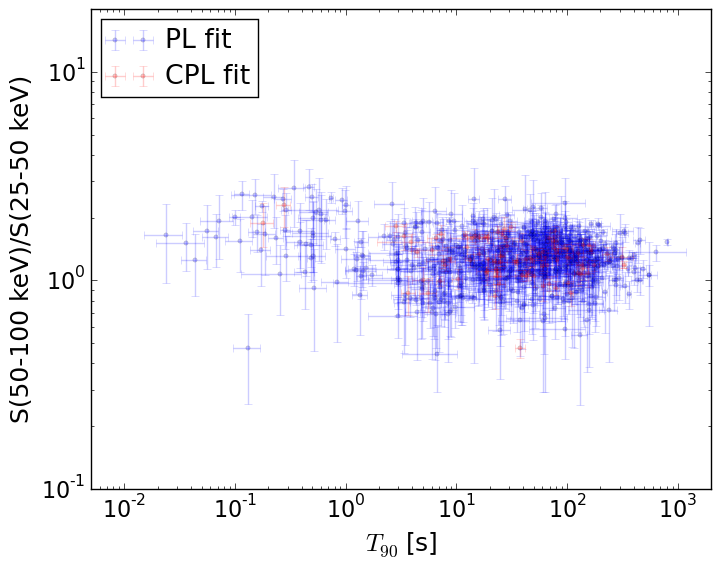
T90                                   = N/A sec.
Hardness ratio (energy fluence ratio) = N/A
S(15-50 keV) vs. S(50-150 keV) plot
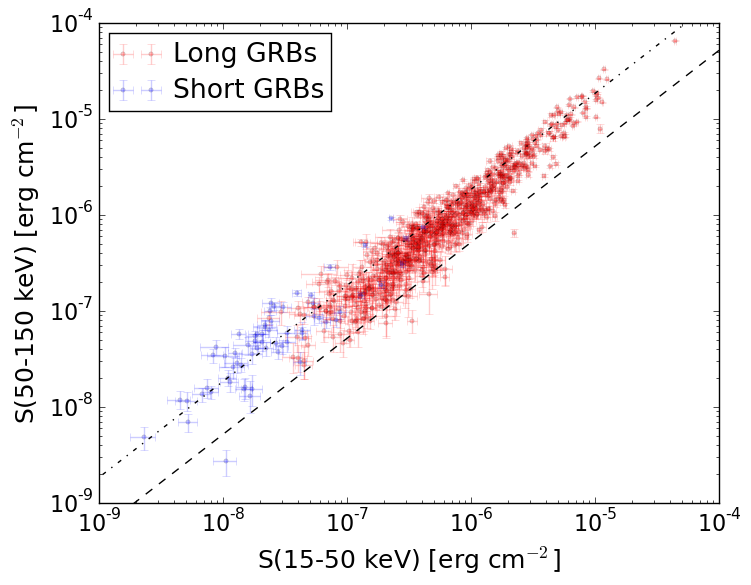
S(15-50 keV)  = N/A
S(50-150 keV) = N/A
The dash-dotted line and the dashed line traces the fluences calculated from the Band function with Epeak = 15 and 150 keV, respectively. Both lines assume a canonical values of alpha = -1 and beta = -2.5.
Mask shadow pattern
IMX = -7.278023838885109E-02, IMY = 3.158355388760571E-01
Spacecraft aspect plot
Bright source in the pre-burst/pre-slew/post-slew images
Pre-burst image of 15-350 keV band
Time interval of the image:
-239.275410 -5.604000

# RAcent  DECcent POSerr Theta    Phi  PeakCts   SNR AngSep     Name
#  [deg]    [deg]    ['] [deg]  [deg]                   [']
107.9321  34.7983    2.2  58.1 -173.9   5.5483   5.3 ------	UNKNOWN
218.1220  41.7978    3.3  26.8  -31.7   0.6596   3.5 ------	UNKNOWN
Pre-slew background subtracted image of 15-350 keV band
Time interval of the image:
-5.604000 44.656000

# RAcent  DECcent POSerr Theta    Phi  PeakCts   SNR AngSep     Name
#  [deg]    [deg]    ['] [deg]  [deg]                   [']
191.2205   3.7359    3.0  36.4   60.7   0.6349   3.9 ------	UNKNOWN
216.1134   3.2927    3.0  47.1   26.5   0.7863   3.9 ------	UNKNOWN
181.3940  41.9576    2.4   2.8 -125.5   0.3481   4.9 ------	UNKNOWN
183.8196  57.2799    1.0  18.0 -103.0   0.9207  11.3 ------	UNKNOWN
242.1888  22.0814    2.1  53.0  -14.4   1.0791   5.4 ------	UNKNOWN
Post-slew image of 15-350 keV band
Time interval of the image:
136.724600 921.924600

# RAcent  DECcent POSerr Theta    Phi  PeakCts   SNR AngSep     Name
#  [deg]    [deg]    ['] [deg]  [deg]                   [']
254.6005  35.2902    9.3  50.9  -18.7   1.1532   1.2    7.7	Her X-1
140.2402  23.4408    3.6  46.0  139.1   5.5155   3.2 ------	UNKNOWN
196.4739  46.0944    2.6  13.6   37.4   1.5921   4.5 ------	UNKNOWN
 95.7499  38.4940    4.9  57.5 -170.4   4.8374   2.4 ------	UNKNOWN