Analysis Summary
Notes:
- 1) No attempt has been made to eliminate the non-significant decimal places.
- 2) This batgrbproduct analysis is done using the HEASARC data.
- 3) This batgrbproduct analysis is using the flight position for the mask-weighting calculation.
======================================================================
BAT GRB EVENT DATA PROCESSING REPORT
Process Script Ver: batgrbproduct v2.46
Process Start Time: Mon Mar 28 14:19:19 EDT 2016
Host Name: bat1
Current Working Dir: /local/data/bat1/alien/Swift_3rdBATcatalog/event/batevent_reproc/trigger679120
======================================================================
Trigger: 00679120 Segment: 000
BAT Trigger Time: 479647987.776 [s; MET]
Trigger Stop: 479647989.824 [s; MET]
UTC: 2016-03-14T11:32:51.798460 [includes UTCF correction]
Where From?: TDRSS position message
BAT
RA: 112.780775633225 Dec: 17.00092392601 [deg; J2000]
Catalogged Source?: NO
Point Source?: YES
GRB Indicated?: YES [ by BAT flight software ]
Image S/N Ratio: 8.54
Image Trigger?: NO
Rate S/N Ratio: 14.1774468787578 [ if not an image trigger ]
Image S/N Ratio: 8.54
Analysis Position: [ source = BAT ]
RA: 112.780775633225 Dec: 17.00092392601 [deg; J2000]
Refined Position: [ source = BAT pre-slew burst ]
RA: 112.766207779711 Dec: 17.0234503011397 [deg; J2000]
{ 07h 31m 03.9s , +17d 01' 24.4" }
+/- 1.72851934259036 [arcmin] (estimated 90% radius based on SNR)
+/- 0.817643453877885 [arcmin] (formal 1-sigma fit error)
SNR: 13.9182215729122
Angular difference between the analysis and refined position is 1.589144 arcmin
Partial Coding Fraction: 0.75 [ including projection effects ]
Duration
T90: 8.73199993371964 +/- 1.51638125570509
Measured from: 0.255999982357025
to: 8.98799991607666 [s; relative to TRIGTIME]
T50: 3.11199992895126 +/- 1.42999997780873
Measured from: 1.37999999523163
to: 4.49199992418289 [s; relative to TRIGTIME]
Fluence
Peak Flux (peak 1 second)
Measured from: 1.12000000476837
to: 2.12000000476837 [s; relative to TRIGTIME]
Total Fluence
Measured from: -0.0360000133514404
to: 9.31199997663498 [s; relative to TRIGTIME]
Band 1 Band 2 Band 3 Band 4
15-25 25-50 50-100 100-350 keV
Total 0.140798 0.166740 0.116350 0.052304
0.018960 0.019376 0.016588 0.013450 [error]
Peak 0.036316 0.040673 0.027093 0.016098
0.006666 0.006594 0.005718 0.004544 [error]
[ fluence units of on-axis counts / fully illuminated detector ]
======================================================================
====== Table of the duration information =============================
Value tstart tstop
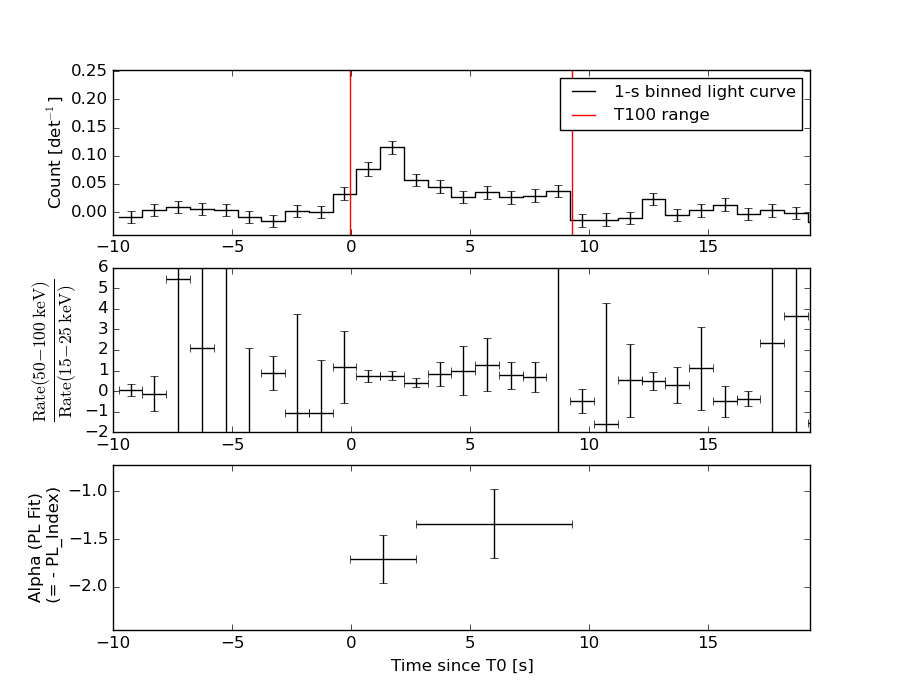
T100 9.348 -0.036 9.312
T90 8.732 0.256 8.988
T50 3.112 1.380 4.492
Peak 1.000 1.120 2.120
====== Spectral Analysis Summary =====================================
Model : spectral model: simple power-law (PL) and cutoff power-law (CPL)
Ph_index : photon index: E^{Ph_index}
Ph_90err : 90% error of the photon index
Epeak : Epeak in keV
Epeak_90err: 90% error of Epeak
Norm : normalization at 50 keV in both the PL model and CPL model
Nomr_90err : 90% error of the normalization
chi2 : Chi-Squared
dof : degree of freedo
=== Time-averaged spectral analysis ===
(Best model with acceptable fit: PL)
Model Ph_index Ph_90err_low Ph_90err_hi Epeak Epeak_90err_low Epeak_90err_hi Norm Nomr_90err_low Norm_90err_hi chi2 dof
PL -1.528 -0.223 0.220 - - - 3.12e-03 -4.03e-04 3.98e-04 62.830 57
CPL -1.530 -0.220 0.225 9999.360 -9999.360 -9999.360 3.12e-03 -2.25e-03 4.36e-03 62.840 56
=== 1-s peak spectral analysis ===
(Best model with acceptable fit: PL)
Model Ph_index Ph_90err_low Ph_90err_hi Epeak Epeak_90err_low Epeak_90err_hi Norm Nomr_90err_low Norm_90err_hi chi2 dof
PL -1.505 -0.325 0.328 - - - 7.27e-03 -1.29e-03 1.26e-03 68.970 57
CPL -1.530 -0.302 0.452 9999.360 -9999.360 -9999.360 7.18e-03 -1.19e-03 -7.18e-03 69.010 56
=== Fluence/Peak Flux Summary ===
Model Band1 Band2 Band3 Band4 Band5 Total
15-25 25-50 50-100 100-350 15-150 15-350 keV
Fluence PL 3.82e-08 6.91e-08 9.58e-08 2.77e-07 2.75e-07 4.80e-07 erg/cm2
90%_error_low -7.67e-09 -8.71e-09 -1.64e-08 -8.89e-08 -3.89e-08 -1.04e-07 erg/cm2
90%_error_hi 7.99e-09 8.65e-09 1.64e-08 1.15e-07 3.95e-08 1.25e-07 erg/cm2
Peak flux PL 3.01e-01 3.02e-01 2.12e-01 2.38e-01 9.08e-01 1.05e+00 ph/cm2/s
90%_error_low -8.85e-02 -5.46e-02 -4.92e-02 -9.78e-02 -1.54e-01 -1.80e-01 ph/cm2/s
90%_error_hi 9.35e-02 5.32e-02 4.81e-02 1.37e-01 1.54e-01 1.82e-01 ph/cm2/s
Fluence CPL 3.82e-08 6.91e-08 9.53e-08 2.75e-07 2.78e-07 4.83e-07 erg/cm2
90%_error_low N/A N/A -2.18e-08 N/A N/A -2.02e-07 erg/cm2
90%_error_hi N/A N/A 2.28e-08 N/A N/A 5.50e-08 erg/cm2
Peak flux CPL 3.01e-01 3.00e-01 2.10e-01 2.35e-01 9.18e-01 1.04e+00 ph/cm2/s
90%_error_low -8.88e-02 -5.55e-02 -4.83e-02 N/A -1.59e-01 -1.72e-01 ph/cm2/s
90%_error_hi 9.34e-02 5.73e-02 5.28e-02 N/A 1.46e-01 1.90e-01 ph/cm2/s
======================================================================
Image
Pre-slew 15.0-350.0 keV image (Event data)
#   RAcent    DECcent   POSerr    Theta     Phi              Peak Cts       SNR   Name
  112.7662    17.0235   0.0138    19.6953    61.4634         0.4841346     13.918 TRIG_00679120

Foreground time interval of the image:
 -0.036   9.312 (delta_t =   9.348 [sec])
Background time interval of the image:
-239.776  -0.036 (delta_t = 239.740 [sec])
Light Curves
Note: The mask-weighted lightcurves have units of either count/det or counts/sec/det, where a det is 0.4 x 0.4 = 0.16 sq cm.
Full-time range; 1 s binning
Other quick-look light curves:
- 64 ms binning (zoomed)
- 16 ms binning (zoomed)
- 8 ms binning (zoomed)
- 2 ms binning (zoomed)
- SN=5 or 10 s binning (full-time range)
- Raw light curve
Spectra
- 64 ms binning (zoomed)
- 16 ms binning (zoomed)
- 8 ms binning (zoomed)
- 2 ms binning (zoomed)
- SN=5 or 10 s binning (full-time range)
- Raw light curve
Spectra
Notes:
- 1) The fitting includes the systematic errors.
- 2) When the burst includes telescope slew time periods, the fitting uses an average response file made from multiple 5-s response files through out the slew time plus single time preiod for the non-slew times, and weighted by the total counts in the corresponding time period using addrmf. An average response file is needed becuase a spectral fit using the pre-slew DRM will introduce some errors in both a spectral shape and a normalization if the PHA file contains a lot of the slew/post-slew time interval.
- 3) For fits to more complicated models (e.g. a power-law over a cutoff power-law), the BAT team has decided to require a chi-square improvement of more than 6 for each extra dof.
Time averaged spectrum fit using the average DRM
Power-law model
Time interval is from   -0.036 sec. to    9.312 sec.

Spectral model in power-law:
------------------------------------------------------------
Parameters  : value       lower 90%   higher 90%
Photon index: -1.52836     ( -0.222498   0.219949 )
Norm@50keV  : 3.11909E-03    ( -0.00040331   0.000398262 )
------------------------------------------------------------
#Fit statistic : Chi-Squared =          62.83 using 59 PHA bins.
# Reduced chi-squared =          1.102 for     57 degrees of freedom
# Null hypothesis probability =   2.773965e-01

Photon flux (15-150 keV)    in 9.348 sec: 0.392441 ( -0.04844  0.048497 ) ph/cm2/s
Energy fluence (15-150 keV)             : 2.75403e-07 ( -3.89101e-08  3.94866e-08 ) ergs/cm2
Cutoff power-law model

Time interval is from   -0.036 sec. to    9.312 sec.
Spectral model in the cutoff power-law:
------------------------------------------------------------
Parameters  : value       lower 90%   higher 90%
Photon index: -1.52962     ( -0.220702   0.22448 )
Epeak [keV] : 9999.36      ( -9999.36 -9999.36 )
Norm@50keV  : 3.12120E-03    ( -0.00225277   0.00435825 )
------------------------------------------------------------
#Fit statistic : Chi-Squared =          62.84 using 59 PHA bins.
# Reduced chi-squared =          1.122 for     56 degrees of freedom
# Null hypothesis probability =   2.470212e-01

Photon flux (15-150 keV)    in 9.348 sec: 0.393417 ( -0.051805  0.049339 ) ph/cm2/s
Energy fluence (15-150 keV)             : 2.77958e-07 ( 0  0 ) ergs/cm2
1-s peak spectrum fit
Power-law model
Time interval is from    1.120 sec. to    2.120 sec.

Spectral model in power-law:
------------------------------------------------------------
Parameters  : value       lower 90%   higher 90%
Photon index: -1.50511     ( -0.325436   0.327818 )
Norm@50keV  : 7.26617E-03    ( -0.00128593   0.00125803 )
------------------------------------------------------------
#Fit statistic : Chi-Squared =          68.97 using 59 PHA bins.
# Reduced chi-squared =          1.210 for     57 degrees of freedom
# Null hypothesis probability =   1.329721e-01

Photon flux (15-150 keV)    in 1 sec: 0.908380 ( -0.153933  0.15404 ) ph/cm2/s
Energy fluence (15-150 keV)             : 6.88811e-08 ( -1.34006e-08  1.36428e-08 ) ergs/cm2
Cutoff power-law model

Time interval is from    1.120 sec. to    2.120 sec.
Spectral model in the cutoff power-law:
------------------------------------------------------------
Parameters  : value       lower 90%   higher 90%
Photon index: -1.50428     ( -0.303865   0.45031 )
Epeak [keV] : 1.00000E+04      ( -10000 -10000 )
Norm@50keV  : 7.28521E-03    ( -0.00129489   -0.00728523 )
------------------------------------------------------------
#Fit statistic : Chi-Squared =          68.99 using 59 PHA bins.
# Reduced chi-squared =          1.232 for     56 degrees of freedom
# Null hypothesis probability =   1.140564e-01

Photon flux (15-150 keV)    in 1 sec: 0.918153 ( -0.159414  0.146057 ) ph/cm2/s
Energy fluence (15-150 keV)             : 3.83469e-08 ( -1.50172e-08  1.13856e-08 ) ergs/cm2
Time-resolved spectra
Distribution
T90 vs. Hardness ratio plot
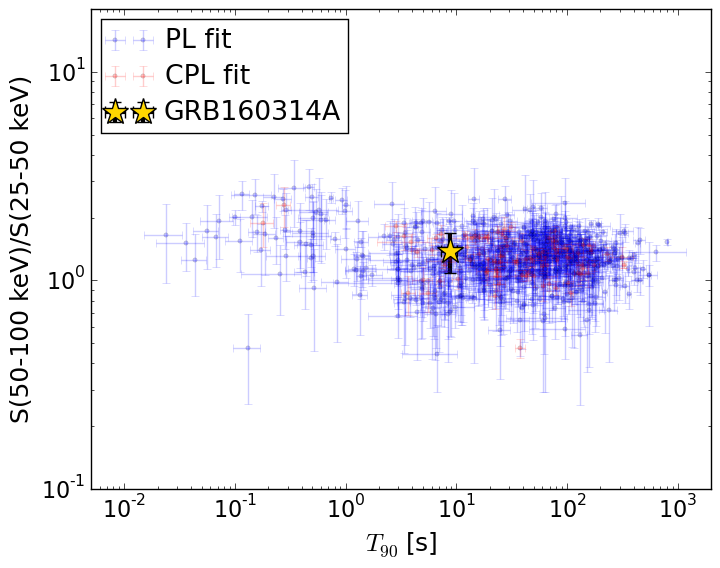
T90                                   = 8.732 sec.
Hardness ratio (energy fluence ratio) = 1.38672354267
S(15-50 keV) vs. S(50-150 keV) plot
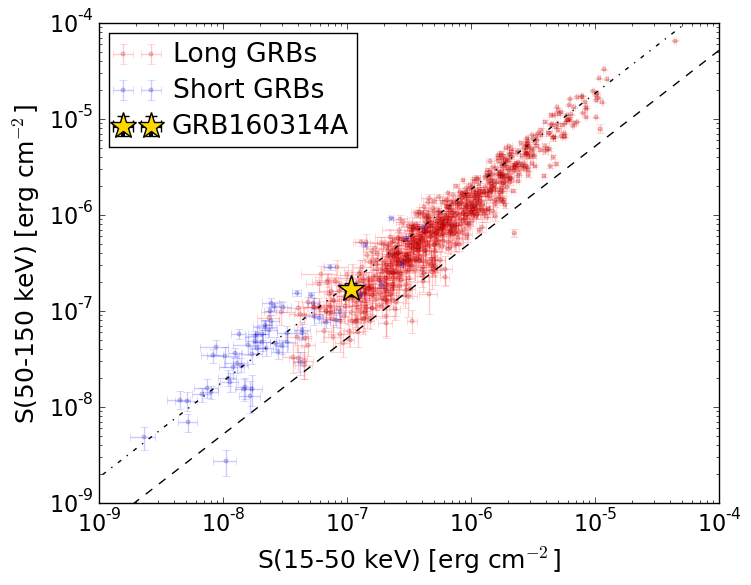
S(15-50 keV)  = 1.0728559e-07
S(50-150 keV) = 1.6811606e-07
The dash-dotted line and the dashed line traces the fluences calculated from the Band function with Epeak = 15 and 150 keV, respectively. Both lines assume a canonical values of alpha = -1 and beta = -2.5.
Mask shadow pattern
IMX = 1.710043101406890E-01, IMY = -3.144712058619749E-01
Spacecraft aspect plot
Bright source in the pre-burst/pre-slew/post-slew images
Pre-burst image of 15-350 keV band
Time interval of the image:
-239.776000 -0.036000

# RAcent  DECcent POSerr Theta    Phi  PeakCts   SNR AngSep     Name
#  [deg]    [deg]    ['] [deg]  [deg]                   [']
 83.6283  22.0218    0.2  16.4  -40.1   9.9195  50.9    0.5	Crab
 83.1061 -29.1693    3.0  39.8 -167.8   1.1021   3.9 ------	UNKNOWN
 83.3661  58.2979    3.5  49.9  -10.5   1.3281   3.3 ------	UNKNOWN
 55.3358  27.5867    3.6  41.0  -61.1   1.9809   3.2 ------	UNKNOWN
Pre-slew background subtracted image of 15-350 keV band
Time interval of the image:
-0.036000 9.312000

# RAcent  DECcent POSerr Theta    Phi  PeakCts   SNR AngSep     Name
#  [deg]    [deg]    ['] [deg]  [deg]                   [']
 83.7129  21.8682    4.2  16.2  -40.3   0.0792   2.8    9.8	Crab
112.7662  17.0234    0.8  19.7   61.5   0.4840  13.9 ------	UNKNOWN
 96.3594 -34.1500    2.5  43.3  174.4   0.2424   4.6 ------	UNKNOWN
Post-slew image of 15-350 keV band
Time interval of the image:
75.124610 962.291800

# RAcent  DECcent POSerr Theta    Phi  PeakCts   SNR AngSep     Name
#  [deg]    [deg]    ['] [deg]  [deg]                   [']
 83.6329  22.0212    0.2  27.9  -81.2  36.8827  49.2    0.4	Crab
147.4921  38.4268    3.5  37.1   41.5   3.1207   3.3 ------	UNKNOWN
129.7179  61.5494    2.7  46.1    4.9   4.2964   4.2 ------	UNKNOWN
110.7459 -10.8022    2.9  27.9  178.0   2.4764   3.9 ------	UNKNOWN
114.1220  52.0780    2.9  35.1   -4.8   2.5420   3.9 ------	UNKNOWN
 97.5733  -3.2984    3.0  25.2 -148.4   2.0208   3.8 ------	UNKNOWN