Analysis Summary
Notes:
- 1) No attempt has been made to eliminate the non-significant decimal places.
- 2) This batgrbproduct analysis is done using the HEASARC data.
- 3) This batgrbproduct analysis is using the flight position for the mask-weighting calculation.
======================================================================
BAT GRB EVENT DATA PROCESSING REPORT
Process Script Ver: batgrbproduct v2.46
Process Start Time: Thu Apr 14 18:25:10 EDT 2016
Host Name: bat1
Current Working Dir: /local/data/bat1/alien/Swift_3rdBATcatalog/event/batevent_reproc/trigger680017
======================================================================
Trigger: 00680017 Segment: 000
BAT Trigger Time: 480268543.232 [s; MET]
Trigger Stop: 480268551.424 [s; MET]
UTC: 2016-03-21T15:55:27.220500 [includes UTCF correction]
Where From?: TDRSS position message
BAT
RA: 99.4143335524643 Dec: 5.71469069735744 [deg; J2000]
Catalogged Source?: NO
Point Source?: YES
GRB Indicated?: YES [ by BAT flight software ]
Image S/N Ratio: 9.2
Image Trigger?: NO
Rate S/N Ratio: 13.3041346956501 [ if not an image trigger ]
Image S/N Ratio: 9.2
Analysis Position: [ source = BAT ]
RA: 99.4143335524643 Dec: 5.71469069735744 [deg; J2000]
Refined Position: [ source = BAT pre-slew burst ]
RA: 99.4212181814234 Dec: 5.75268135623526 [deg; J2000]
{ 06h 37m 41.1s , +05d 45' 09.7" }
+/- 1.61811279350972 [arcmin] (estimated 90% radius based on SNR)
+/- 0.67868839833209 [arcmin] (formal 1-sigma fit error)
SNR: 15.2944685913674
Angular difference between the analysis and refined position is 2.316198 arcmin
Partial Coding Fraction: 0.9609375 [ including projection effects ]
Duration
T90: 33.4759999513626 +/- 4.82827839746115
Measured from: -18.1359999775887
to: 15.339999973774 [s; relative to TRIGTIME]
T50: 16.8879999518394 +/- 5.19521778066117
Measured from: -9.71999996900558
to: 7.16799998283386 [s; relative to TRIGTIME]
Fluence
Peak Flux (peak 1 second)
Measured from: 1.7960000038147
to: 2.7960000038147 [s; relative to TRIGTIME]
Total Fluence
Measured from: -20.8840000033379
to: 19.1000000238419 [s; relative to TRIGTIME]
Band 1 Band 2 Band 3 Band 4
15-25 25-50 50-100 100-350 keV
Total 0.356468 0.409269 0.202134 0.015496
0.034318 0.035969 0.032025 0.030118 [error]
Peak 0.019696 0.021223 0.010212 0.007957
0.005436 0.005897 0.005098 0.004678 [error]
[ fluence units of on-axis counts / fully illuminated detector ]
======================================================================
====== Table of the duration information =============================
Value tstart tstop
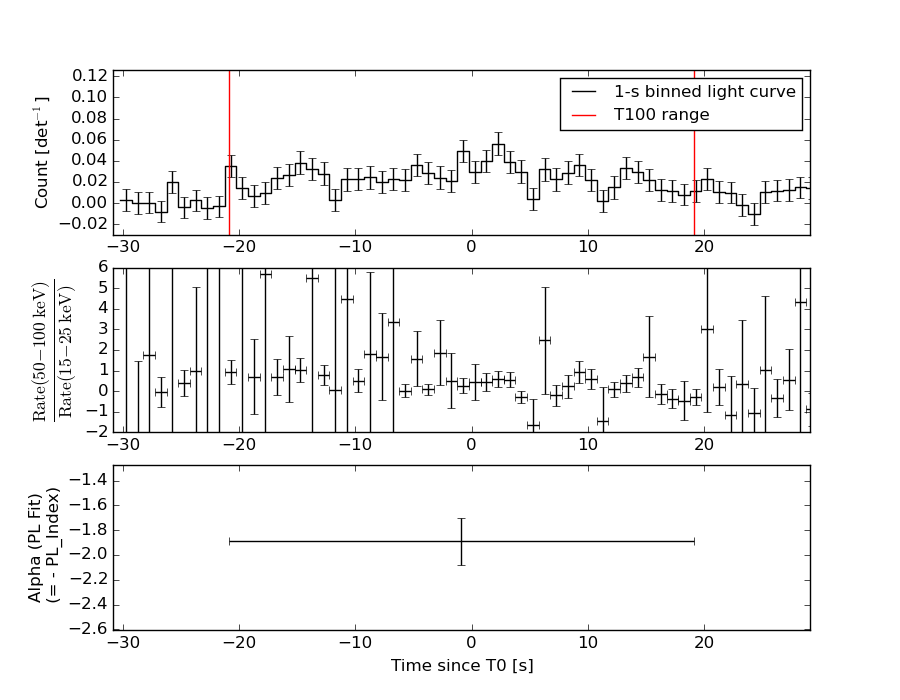
T100 39.984 -20.884 19.100
T90 33.476 -18.136 15.340
T50 16.888 -9.720 7.168
Peak 1.000 1.796 2.796
====== Spectral Analysis Summary =====================================
Model : spectral model: simple power-law (PL) and cutoff power-law (CPL)
Ph_index : photon index: E^{Ph_index}
Ph_90err : 90% error of the photon index
Epeak : Epeak in keV
Epeak_90err: 90% error of Epeak
Norm : normalization at 50 keV in both the PL model and CPL model
Nomr_90err : 90% error of the normalization
chi2 : Chi-Squared
dof : degree of freedo
=== Time-averaged spectral analysis ===
(Best model with acceptable fit: PL)
Model Ph_index Ph_90err_low Ph_90err_hi Epeak Epeak_90err_low Epeak_90err_hi Norm Nomr_90err_low Norm_90err_hi chi2 dof
PL -1.888 -0.196 0.187 - - - 1.46e-03 -1.90e-04 1.86e-04 52.840 57
CPL -1.145 -0.773 0.982 46.794 -13.500 -46.794 3.99e-03 -2.55e-03 1.14e-02 50.160 56
=== 1-s peak spectral analysis ===
(Best model with acceptable fit: PL)
Model Ph_index Ph_90err_low Ph_90err_hi Epeak Epeak_90err_low Epeak_90err_hi Norm Nomr_90err_low Norm_90err_hi chi2 dof
PL -1.659 -0.628 0.593 - - - 3.25e-03 -1.22e-03 1.13e-03 48.980 57
CPL -1.670 -0.618 0.608 9999.300 -9999.290 -9999.300 3.24e-03 -3.24e-03 3.23e-02 48.980 56
=== Fluence/Peak Flux Summary ===
Model Band1 Band2 Band3 Band4 Band5 Total
15-25 25-50 50-100 100-350 15-150 15-350 keV
Fluence PL 1.08e-07 1.56e-07 1.69e-07 3.40e-07 5.37e-07 7.72e-07 erg/cm2
90%_error_low -1.53e-08 -1.61e-08 -2.95e-08 -1.05e-07 -6.80e-08 -1.40e-07 erg/cm2
90%_error_hi 1.56e-08 1.60e-08 3.03e-08 1.33e-07 6.98e-08 1.63e-07 erg/cm2
Peak flux PL 1.56e-01 1.43e-01 9.05e-02 8.78e-02 4.26e-01 4.77e-01 ph/cm2/s
90%_error_low -7.16e-02 -4.38e-02 -4.24e-02 -6.02e-02 -1.30e-01 -1.51e-01 ph/cm2/s
90%_error_hi 7.61e-02 4.36e-02 4.31e-02 1.16e-01 1.30e-01 1.57e-01 ph/cm2/s
Fluence CPL 1.02e-07 1.71e-07 1.60e-07 9.55e-08 4.92e-07 5.28e-07 erg/cm2
90%_error_low -1.70e-08 N/A -3.78e-08 -6.99e-08 -7.67e-08 -1.07e-07 erg/cm2
90%_error_hi 1.70e-08 N/A 3.46e-08 2.62e-07 8.27e-08 2.71e-07 erg/cm2
Peak flux CPL 1.59e-01 1.39e-01 8.97e-02 4.76e-02 4.27e-01 4.95e-01 ph/cm2/s
90%_error_low -8.30e-02 -3.94e-02 N/A -2.95e-02 -1.31e-01 -1.88e-01 ph/cm2/s
90%_error_hi 8.36e-02 5.18e-02 N/A 2.28e-02 1.29e-01 1.58e-01 ph/cm2/s
======================================================================
Image
Pre-slew 15.0-350.0 keV image (Event data)
#   RAcent    DECcent   POSerr    Theta     Phi              Peak Cts       SNR   Name
   99.4212     5.7527   0.0126    17.2182  -141.8376         1.1024749     15.294 TRIG_00680017

Foreground time interval of the image:
-20.884  19.100 (delta_t =  39.984 [sec])
Background time interval of the image:
-239.232 -20.884 (delta_t = 218.348 [sec])
Light Curves
Note: The mask-weighted lightcurves have units of either count/det or counts/sec/det, where a det is 0.4 x 0.4 = 0.16 sq cm.
Full-time range; 1 s binning
Other quick-look light curves:
- 64 ms binning (zoomed)
- 16 ms binning (zoomed)
- 8 ms binning (zoomed)
- 2 ms binning (zoomed)
- SN=5 or 10 s binning (full-time range)
- Raw light curve
Spectra
- 64 ms binning (zoomed)
- 16 ms binning (zoomed)
- 8 ms binning (zoomed)
- 2 ms binning (zoomed)
- SN=5 or 10 s binning (full-time range)
- Raw light curve
Spectra
Notes:
- 1) The fitting includes the systematic errors.
- 2) When the burst includes telescope slew time periods, the fitting uses an average response file made from multiple 5-s response files through out the slew time plus single time preiod for the non-slew times, and weighted by the total counts in the corresponding time period using addrmf. An average response file is needed becuase a spectral fit using the pre-slew DRM will introduce some errors in both a spectral shape and a normalization if the PHA file contains a lot of the slew/post-slew time interval.
- 3) For fits to more complicated models (e.g. a power-law over a cutoff power-law), the BAT team has decided to require a chi-square improvement of more than 6 for each extra dof.
Time averaged spectrum fit using the average DRM
Power-law model
Time interval is from  -20.884 sec. to   19.100 sec.

Spectral model in power-law:
------------------------------------------------------------
Parameters  : value       lower 90%   higher 90%
Photon index: -1.88831     ( -0.196075   0.186858 )
Norm@50keV  : 1.46141E-03    ( -0.000190173   0.000186354 )
------------------------------------------------------------
#Fit statistic : Chi-Squared =          52.84 using 59 PHA bins.
# Reduced chi-squared =         0.9269 for     57 degrees of freedom
# Null hypothesis probability =   6.319662e-01

Photon flux (15-150 keV)    in 39.98 sec: 0.208707 ( -0.021286  0.021287 ) ph/cm2/s
Energy fluence (15-150 keV)             : 5.37207e-07 ( -6.80128e-08  6.97983e-08 ) ergs/cm2
Cutoff power-law model
Time interval is from  -20.884 sec. to   19.100 sec.
Spectral model in the cutoff power-law:
------------------------------------------------------------
Parameters  : value       lower 90%   higher 90%
Photon index: -1.14517     ( -0.772679   0.982405 )
Epeak [keV] : 46.7941      ( -13.5 -46.7941 )
Norm@50keV  : 3.99099E-03    ( -0.00255057   0.0113853 )
------------------------------------------------------------
#Fit statistic : Chi-Squared =          50.16 using 59 PHA bins.
# Reduced chi-squared =         0.8957 for     56 degrees of freedom
# Null hypothesis probability =   6.944532e-01

Photon flux (15-150 keV)    in 39.98 sec: 0.202712 ( -0.022049  0.022111 ) ph/cm2/s
Energy fluence (15-150 keV)             : 4.91886e-07 ( -7.67092e-08  8.27102e-08 ) ergs/cm2
1-s peak spectrum fit
Power-law model
Time interval is from    1.796 sec. to    2.796 sec.

Spectral model in power-law:
------------------------------------------------------------
Parameters  : value       lower 90%   higher 90%
Photon index: -1.65862     ( -0.628491   0.592658 )
Norm@50keV  : 3.25115E-03    ( -0.00121527   0.00112766 )
------------------------------------------------------------
#Fit statistic : Chi-Squared =          48.98 using 59 PHA bins.
# Reduced chi-squared =         0.8592 for     57 degrees of freedom
# Null hypothesis probability =   7.663193e-01

Photon flux (15-150 keV)    in 1 sec: 0.425751 ( -0.12955  0.129556 ) ph/cm2/s
Energy fluence (15-150 keV)             : 3.02155e-08 ( -1.12751e-08  1.20504e-08 ) ergs/cm2
Cutoff power-law model
Time interval is from    1.796 sec. to    2.796 sec.
Spectral model in the cutoff power-law:
------------------------------------------------------------
Parameters  : value       lower 90%   higher 90%
Photon index: -2.47593     ( -0.618761   0.607131 )
Epeak [keV] : 161.504      ( -9999.35 -9999.36 )
Norm@50keV  : 1.20977E-03    ( -0.00121349   0.0343154 )
------------------------------------------------------------
#Fit statistic : Chi-Squared =          48.79 using 59 PHA bins.
# Reduced chi-squared =         0.8712 for     56 degrees of freedom
# Null hypothesis probability =   7.419215e-01

Photon flux (15-150 keV)    in 1 sec: 0.426517 ( -0.130771  0.128842 ) ph/cm2/s
Energy fluence (15-150 keV)             : 2.1746e-08 ( -1.33601e-08  7.09432e-09 ) ergs/cm2
Time-resolved spectra
Distribution
T90 vs. Hardness ratio plot
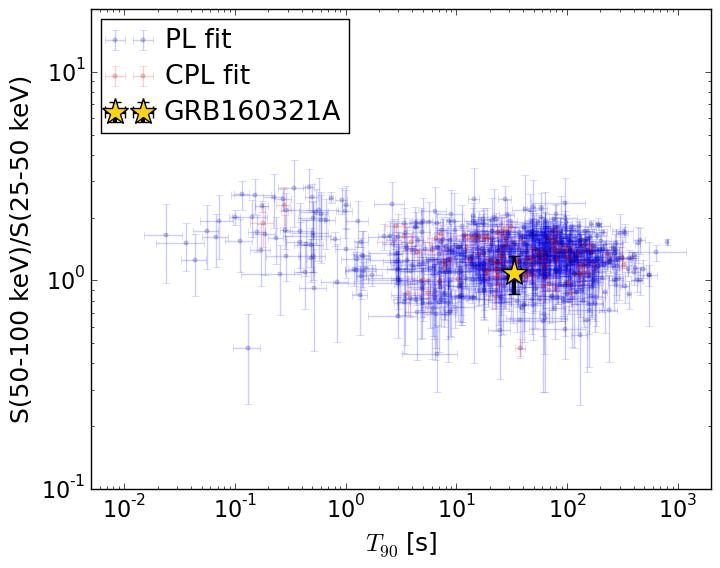
T90                                   = 33.476 sec.
Hardness ratio (energy fluence ratio) = 1.08053747598
S(15-50 keV) vs. S(50-150 keV) plot
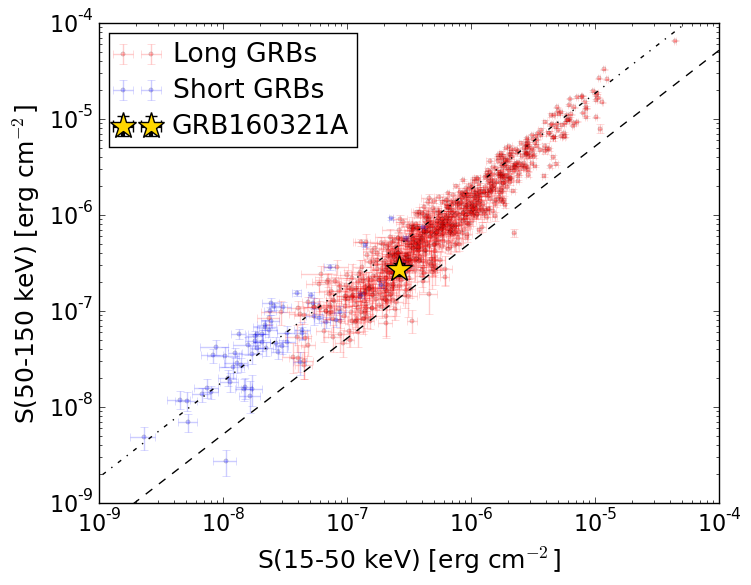
S(15-50 keV)  = 2.636556e-07
S(50-150 keV) = 2.735616e-07
The dash-dotted line and the dashed line traces the fluences calculated from the Band function with Epeak = 15 and 150 keV, respectively. Both lines assume a canonical values of alpha = -1 and beta = -2.5.
Mask shadow pattern
IMX = -2.436630703935760E-01, IMY = 1.914851246551121E-01
Spacecraft aspect plot
Bright source in the pre-burst/pre-slew/post-slew images
Pre-burst image of 15-350 keV band
Time interval of the image:
-239.232000 -20.884000

# RAcent  DECcent POSerr Theta    Phi  PeakCts   SNR AngSep     Name
#  [deg]    [deg]    ['] [deg]  [deg]                   [']
 83.6377  22.0138    0.4  27.8  -87.5   8.9247  30.4    0.3	Crab
124.6432 -33.4501    2.8  51.7  154.8   4.2085   4.2 ------	UNKNOWN
102.9741 -36.2761    3.3  54.1  177.1   2.6883   3.5 ------	UNKNOWN
143.2494  68.9934    3.0  55.4    0.2   3.0874   3.8 ------	UNKNOWN
100.7812 -29.5439    2.4  48.0 -178.5   2.0560   4.9 ------	UNKNOWN
 97.8382  22.3378    2.3  15.0  -79.4   0.9872   4.9 ------	UNKNOWN
 71.2333  40.2776    2.1  42.7  -60.8   3.7750   5.5 ------	UNKNOWN
 70.3234  12.7402    2.2  41.1 -102.6   4.3506   5.2 ------	UNKNOWN
Pre-slew background subtracted image of 15-350 keV band
Time interval of the image:
-20.884000 19.100000

# RAcent  DECcent POSerr Theta    Phi  PeakCts   SNR AngSep     Name
#  [deg]    [deg]    ['] [deg]  [deg]                   [']
 83.7262  21.8781    6.7  27.7  -87.8   0.1829   1.7    9.7	Crab
150.7317  33.2709    2.2  37.8   44.6   0.7775   5.2 ------	UNKNOWN
 99.4212   5.7527    0.8  17.2 -141.8   1.1027  15.3 ------	UNKNOWN
 81.4213  65.8749    2.1  53.1  -28.0   1.3701   5.5 ------	UNKNOWN
Post-slew image of 15-350 keV band
Time interval of the image:
94.468600 962.827700

# RAcent  DECcent POSerr Theta    Phi  PeakCts   SNR AngSep     Name
#  [deg]    [deg]    ['] [deg]  [deg]                   [']
 83.6350  22.0253    0.2  22.3  -42.8  35.5011  59.0    0.7	Crab
121.5777 -37.2727    3.0  47.7  154.9   7.1830   3.9 ------	UNKNOWN
112.4243  44.1202    3.4  40.0   13.3   3.1407   3.4 ------	UNKNOWN
108.9840  54.4456    2.5  49.3    6.1   5.6196   4.6 ------	UNKNOWN
101.6289 -48.3707    3.8  54.1  177.0   7.1693   3.1 ------	UNKNOWN
101.6124 -41.5692    3.9  47.3  176.6   3.6030   3.0 ------	UNKNOWN
 96.7306  40.6732    3.6  35.0   -4.8   2.4914   3.2 ------	UNKNOWN
 64.7433 -12.4020    2.8  39.0 -119.1   5.5745   4.1 ------	UNKNOWN
 61.6653  44.7315    3.9  51.0  -35.2   5.9417   3.0 ------	UNKNOWN