Analysis Summary
Notes:
- 1) No attempt has been made to eliminate the non-significant decimal places.
- 2) This batgrbproduct analysis is done using the HEASARC data.
- 3) This batgrbproduct analysis is using the flight position for the mask-weighting calculation.
======================================================================
BAT GRB EVENT DATA PROCESSING REPORT
Process Script Ver: batgrbproduct v2.46
Process Start Time: Thu Apr 14 18:20:30 EDT 2016
Host Name: bat1
Current Working Dir: /local/data/bat1/alien/Swift_3rdBATcatalog/event/batevent_reproc/trigger680436
======================================================================
Trigger: 00680436 Segment: 000
BAT Trigger Time: 480582019.648 [s; MET]
Trigger Stop: 480582020.16 [s; MET]
UTC: 2016-03-25T07:00:03.619340 [includes UTCF correction]
Where From?: TDRSS position message
BAT
RA: 15.5965562068455 Dec: -72.7063681344509 [deg; J2000]
Catalogged Source?: NO
Point Source?: YES
GRB Indicated?: YES [ by BAT flight software ]
Image S/N Ratio: 10.49
Image Trigger?: NO
Rate S/N Ratio: 25.2784493195291 [ if not an image trigger ]
Image S/N Ratio: 10.49
Analysis Position: [ source = BAT ]
RA: 15.5965562068455 Dec: -72.7063681344509 [deg; J2000]
Refined Position: [ source = BAT pre-slew burst ]
RA: 15.6955921764478 Dec: -72.7017317557842 [deg; J2000]
{ 01h 02m 46.9s , -72d 42' 06.2" }
+/- 0.544890620605329 [arcmin] (estimated 90% radius based on SNR)
+/- 0.155575275615021 [arcmin] (formal 1-sigma fit error)
SNR: 72.4134657961675
Angular difference between the analysis and refined position is 1.788415 arcmin
Partial Coding Fraction: 0.9609375 [ including projection effects ]
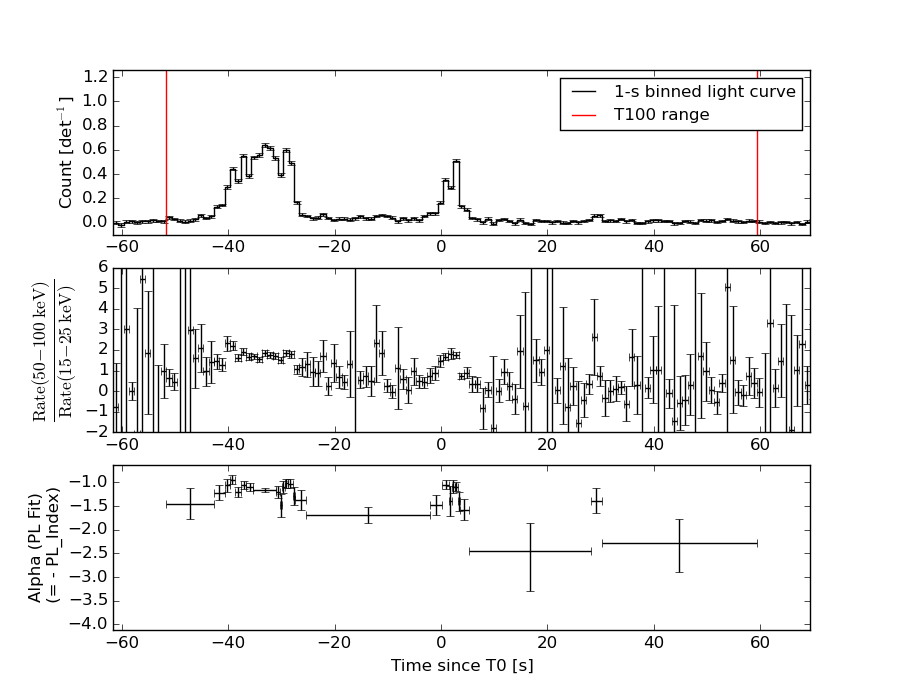
Duration
T90: 61.7239999771118 +/- 12.0532560498552
Measured from: -40.9240000247955
to: 20.7999999523163 [s; relative to TRIGTIME]
T50: 26.5359998941422 +/- 4.86102046732467
Measured from: -35.5759999752045
to: -9.04000008106232 [s; relative to TRIGTIME]
Fluence
Peak Flux (peak 1 second)
Measured from: -33.4679999947548
to: -32.4679999947548 [s; relative to TRIGTIME]
Total Fluence
Measured from: -51.7480000257492
to: 59.3799999952316 [s; relative to TRIGTIME]
Band 1 Band 2 Band 3 Band 4
15-25 25-50 50-100 100-350 keV
Total 2.414276 3.780245 3.385529 0.939801
0.061473 0.065641 0.059625 0.051459 [error]
Peak 0.134600 0.234638 0.227754 0.074036
0.007672 0.009037 0.008956 0.006875 [error]
[ fluence units of on-axis counts / fully illuminated detector ]
======================================================================
====== Table of the duration information =============================
Value tstart tstop
T100 111.128 -51.748 59.380
T90 61.724 -40.924 20.800
T50 26.536 -35.576 -9.040
Peak 1.000 -33.468 -32.468
====== Spectral Analysis Summary =====================================
Model : spectral model: simple power-law (PL) and cutoff power-law (CPL)
Ph_index : photon index: E^{Ph_index}
Ph_90err : 90% error of the photon index
Epeak : Epeak in keV
Epeak_90err: 90% error of Epeak
Norm : normalization at 50 keV in both the PL model and CPL model
Nomr_90err : 90% error of the normalization
chi2 : Chi-Squared
dof : degree of freedo
=== Time-averaged spectral analysis ===
(Best model with acceptable fit: PL)
Model Ph_index Ph_90err_low Ph_90err_hi Epeak Epeak_90err_low Epeak_90err_hi Norm Nomr_90err_low Norm_90err_hi chi2 dof
PL -1.270 -0.042 0.042 - - - 6.42e-03 -1.40e-04 1.40e-04 37.260 57
CPL -1.119 -0.073 0.170 340.686 -148.388 -340.686 7.46e-03 -8.44e-04 1.33e-03 34.810 56
=== 1-s peak spectral analysis ===
(Best model with acceptable fit: PL)
Model Ph_index Ph_90err_low Ph_90err_hi Epeak Epeak_90err_low Epeak_90err_hi Norm Nomr_90err_low Norm_90err_hi chi2 dof
PL -1.109 -0.075 0.075 - - - 4.52e-02 -1.89e-03 1.89e-03 44.020 57
CPL -0.917 -0.224 0.293 316.808 -316.808 -316.808 5.53e-02 -1.16e-02 1.92e-02 42.610 56
=== Fluence/Peak Flux Summary ===
Model Band1 Band2 Band3 Band4 Band5 Total
15-25 25-50 50-100 100-350 15-150 15-350 keV
Fluence PL 7.35e-07 1.55e-06 2.58e-06 9.71e-06 7.10e-06 1.46e-05 erg/cm2
90%_error_low -3.46e-08 -4.25e-08 -6.36e-08 -5.63e-07 -1.61e-07 -5.89e-07 erg/cm2
90%_error_hi 3.53e-08 4.24e-08 6.35e-08 5.88e-07 1.61e-07 6.09e-07 erg/cm2
Peak flux PL 1.28e+00 1.63e+00 1.51e+00 2.46e+00 5.25e+00 6.88e+00 ph/cm2/s
90%_error_low -1.06e-01 -8.23e-02 -7.23e-02 -2.47e-01 -2.25e-01 -3.13e-01 ph/cm2/s
90%_error_hi 1.09e-01 8.18e-02 7.20e-02 2.64e-01 2.25e-01 3.16e-01 ph/cm2/s
Fluence CPL 7.04e-07 1.56e-06 2.62e-06 8.01e-06 7.04e-06 1.29e-05 erg/cm2
90%_error_low -4.66e-08 -4.40e-08 -7.51e-08 -1.47e-06 -1.75e-07 -1.47e-06 erg/cm2
90%_error_hi 4.76e-08 4.41e-08 7.56e-08 1.82e-06 1.74e-07 1.83e-06 erg/cm2
Peak flux CPL 1.22e+00 1.65e+00 1.54e+00 2.00e+00 5.21e+00 6.41e+00 ph/cm2/s
90%_error_low -1.34e-01 -8.74e-02 -8.61e-02 -5.04e-01 -2.33e-01 -5.61e-01 ph/cm2/s
90%_error_hi 1.31e-01 8.82e-02 8.71e-02 5.40e-01 2.33e-01 6.25e-01 ph/cm2/s
======================================================================
Image
Pre-slew 15.0-350.0 keV image (Event data)
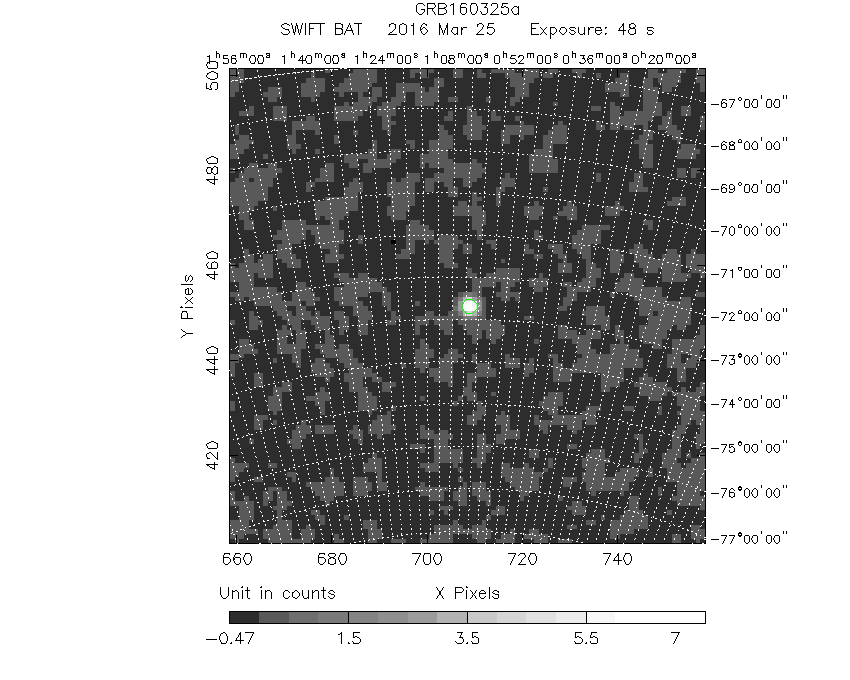
#   RAcent    DECcent   POSerr    Theta     Phi              Peak Cts       SNR   Name
   15.6956   -72.7017   0.0026    19.9236     8.4173         8.1938033     72.413 TRIG_00680436

Foreground time interval of the image:
-37.547  10.253 (delta_t =  47.800 [sec])
Background time interval of the image:
Light Curves
Note: The mask-weighted lightcurves have units of either count/det or counts/sec/det, where a det is 0.4 x 0.4 = 0.16 sq cm.
Full-time range; 1 s binning
Other quick-look light curves:
- 64 ms binning (zoomed)
- 16 ms binning (zoomed)
- 8 ms binning (zoomed)
- 2 ms binning (zoomed)
- SN=5 or 10 s binning (full-time range)
- Raw light curve
Spectra
- 64 ms binning (zoomed)
- 16 ms binning (zoomed)
- 8 ms binning (zoomed)
- 2 ms binning (zoomed)
- SN=5 or 10 s binning (full-time range)
- Raw light curve
Spectra
Notes:
- 1) The fitting includes the systematic errors.
- 2) When the burst includes telescope slew time periods, the fitting uses an average response file made from multiple 5-s response files through out the slew time plus single time preiod for the non-slew times, and weighted by the total counts in the corresponding time period using addrmf. An average response file is needed becuase a spectral fit using the pre-slew DRM will introduce some errors in both a spectral shape and a normalization if the PHA file contains a lot of the slew/post-slew time interval.
- 3) For fits to more complicated models (e.g. a power-law over a cutoff power-law), the BAT team has decided to require a chi-square improvement of more than 6 for each extra dof.
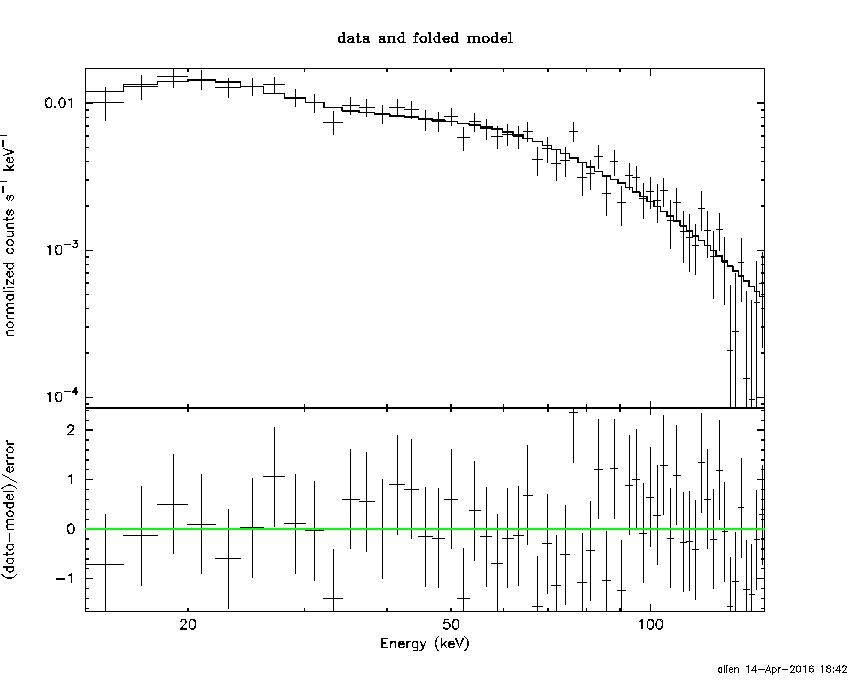
Time averaged spectrum fit using the average DRM
Power-law model
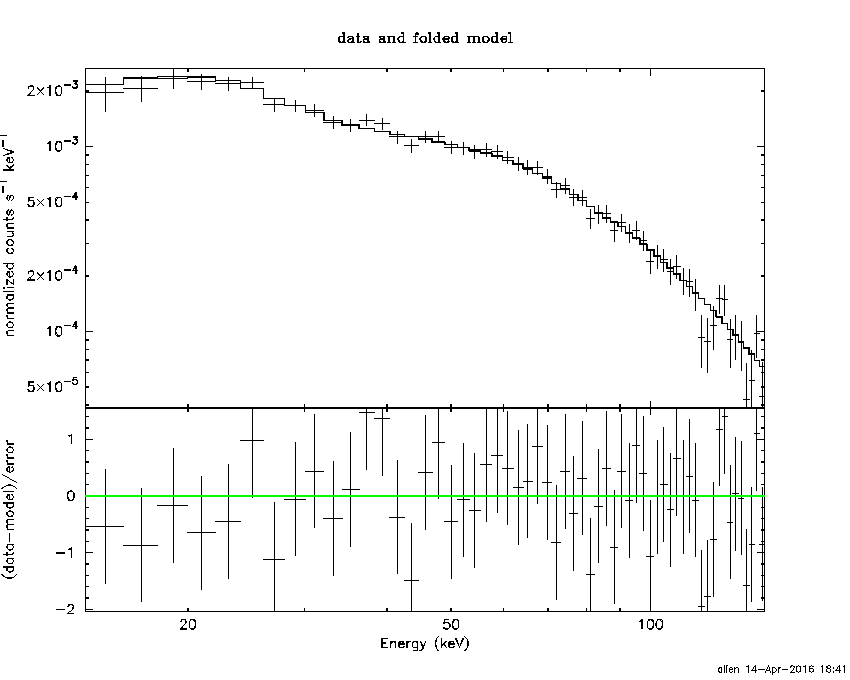
Time interval is from  -51.748 sec. to   59.380 sec.

Spectral model in power-law:
------------------------------------------------------------
Parameters  : value       lower 90%   higher 90%
Photon index: -1.27033     ( -0.0415707   0.0416918 )
Norm@50keV  : 6.42151E-03    ( -0.00014019   0.000140054 )
------------------------------------------------------------
#Fit statistic : Chi-Squared =          37.26 using 59 PHA bins.
# Reduced chi-squared =         0.6537 for     57 degrees of freedom
# Null hypothesis probability =   9.800420e-01

Photon flux (15-150 keV)    in 111.1 sec: 0.762081 ( -0.018298  0.018347 ) ph/cm2/s
Energy fluence (15-150 keV)             : 7.1032e-06 ( -1.60729e-07  1.60937e-07 ) ergs/cm2
Cutoff power-law model
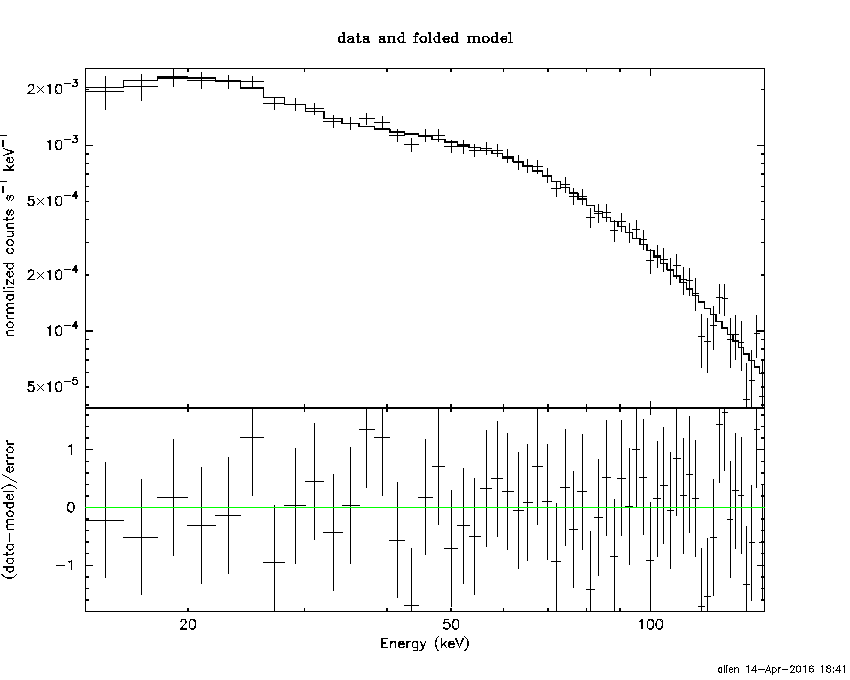
Time interval is from  -51.748 sec. to   59.380 sec.
Spectral model in the cutoff power-law:
------------------------------------------------------------
Parameters  : value       lower 90%   higher 90%
Photon index: -1.11926     ( -0.0734339   0.170199 )
Epeak [keV] : 340.686      ( -148.392 -340.689 )
Norm@50keV  : 7.45783E-03    ( -0.000844095   0.00132833 )
------------------------------------------------------------
#Fit statistic : Chi-Squared =          34.81 using 59 PHA bins.
# Reduced chi-squared =         0.6216 for     56 degrees of freedom
# Null hypothesis probability =   9.882856e-01

Photon flux (15-150 keV)    in 111.1 sec: 0.753525 ( -0.020324  0.020436 ) ph/cm2/s
Energy fluence (15-150 keV)             : 7.04132e-06 ( -1.74839e-07  1.74143e-07 ) ergs/cm2
1-s peak spectrum fit
Power-law model
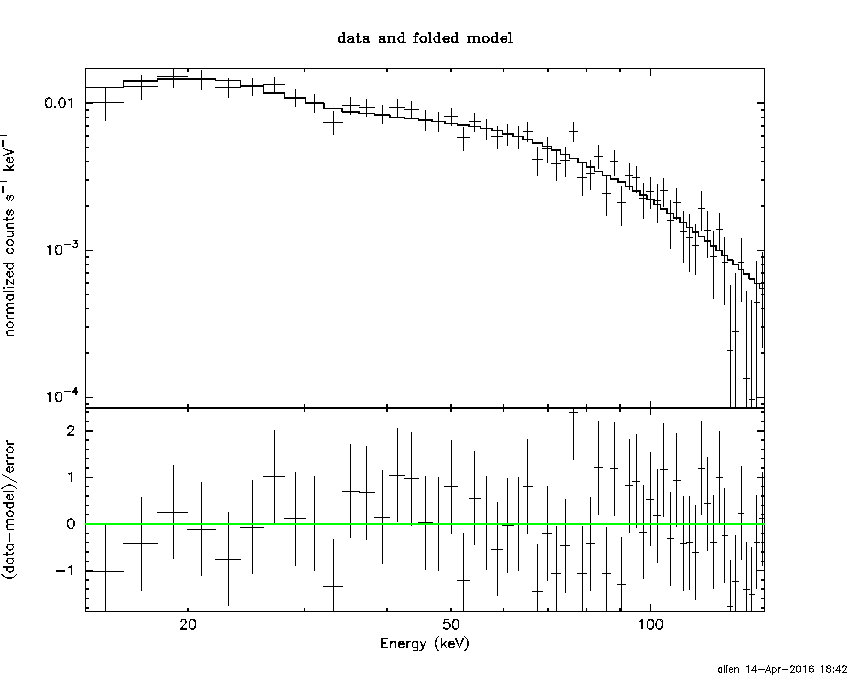
Time interval is from  -33.468 sec. to  -32.468 sec.

Spectral model in power-law:
------------------------------------------------------------
Parameters  : value       lower 90%   higher 90%
Photon index: -1.10914     ( -0.0745419   0.0748868 )
Norm@50keV  : 4.52392E-02    ( -0.00188758   0.0018872 )
------------------------------------------------------------
#Fit statistic : Chi-Squared =          44.02 using 59 PHA bins.
# Reduced chi-squared =         0.7723 for     57 degrees of freedom
# Null hypothesis probability =   8.959240e-01

Photon flux (15-150 keV)    in 1 sec: 5.25219 ( -0.22456  0.22473 ) ph/cm2/s
Energy fluence (15-150 keV)             : 4.71672e-07 ( -2.20578e-08  2.21268e-08 ) ergs/cm2
Cutoff power-law model
Time interval is from  -33.468 sec. to  -32.468 sec.
Spectral model in the cutoff power-law:
------------------------------------------------------------
Parameters  : value       lower 90%   higher 90%
Photon index: -0.917082     ( -0.223566   0.292646 )
Epeak [keV] : 316.808      ( -316.808 -316.808 )
Norm@50keV  : 5.53485E-02    ( -0.0115679   0.0191703 )
------------------------------------------------------------
#Fit statistic : Chi-Squared =          42.61 using 59 PHA bins.
# Reduced chi-squared =         0.7609 for     56 degrees of freedom
# Null hypothesis probability =   9.063593e-01

Photon flux (15-150 keV)    in 1 sec: 5.20682 ( -0.23346  0.23346 ) ph/cm2/s
Energy fluence (15-150 keV)             : 4.66692e-07 ( -2.34203e-08  2.33011e-08 ) ergs/cm2
Time-resolved spectra
Distribution
T90 vs. Hardness ratio plot
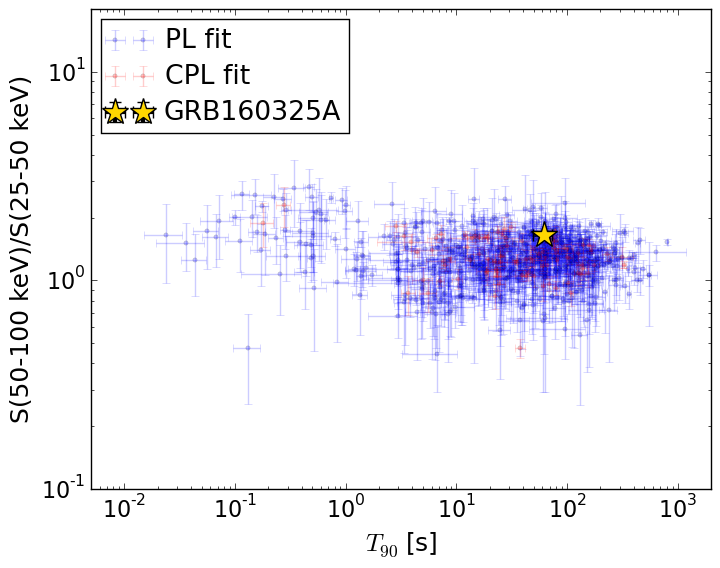
T90                                   = 61.724 sec.
Hardness ratio (energy fluence ratio) = 1.65828907173
S(15-50 keV) vs. S(50-150 keV) plot
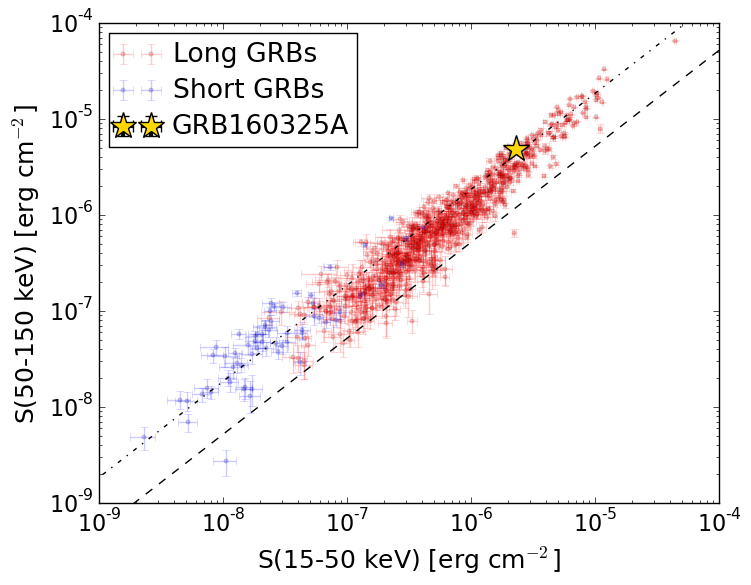
S(15-50 keV)  = 2.2894759e-06
S(50-150 keV) = 4.813702e-06
The dash-dotted line and the dashed line traces the fluences calculated from the Band function with Epeak = 15 and 150 keV, respectively. Both lines assume a canonical values of alpha = -1 and beta = -2.5.
Mask shadow pattern
IMX = 3.585564300898409E-01, IMY = -5.305764088187091E-02
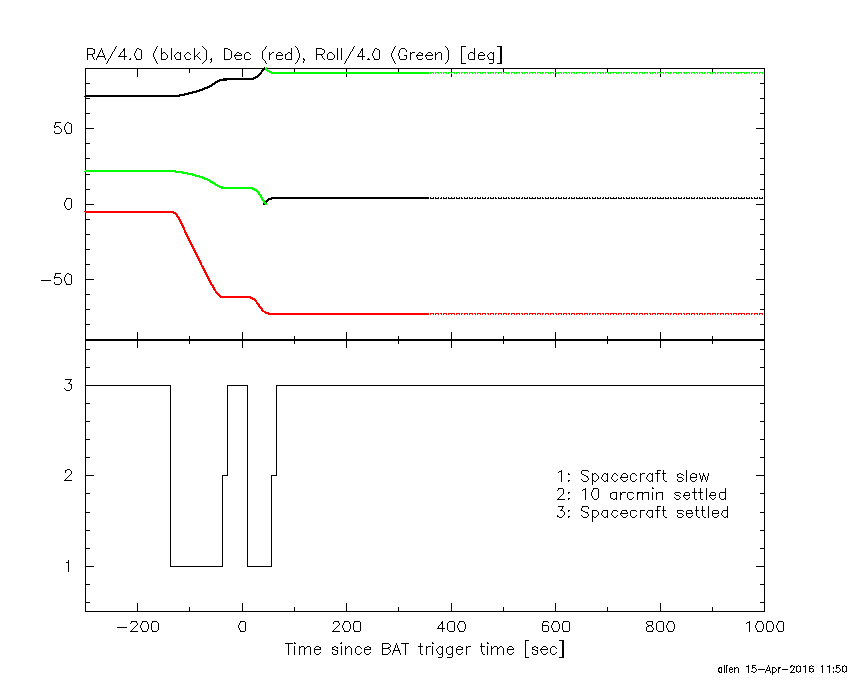
Spacecraft aspect plot
Bright source in the pre-burst/pre-slew/post-slew images
Pre-burst image of 15-350 keV band
Time interval of the image:
Pre-slew background subtracted image of 15-350 keV band
Time interval of the image:
-37.547400 10.252640

# RAcent  DECcent POSerr Theta    Phi  PeakCts   SNR AngSep     Name
#  [deg]    [deg]    ['] [deg]  [deg]                   [']
264.6237 -44.3193   11.3  41.2  129.9   0.3432   1.0    9.4	4U 1735-44
276.0682 -30.2768    6.2  47.1  152.4  -0.6545  -1.9    9.2	H1820-303
285.1301 -24.7392    0.0  47.9  165.6   0.2498   0.8   12.0	HT1900.1-2455
122.0331 -65.4158    3.0  51.2   31.7   2.1894   3.8 ------	UNKNOWN
176.4752 -83.8875    3.0  33.9   51.3   0.7153   3.8 ------	UNKNOWN
 15.6956 -72.7017    0.2  19.9    8.4   8.1926  72.4 ------	UNKNOWN
330.8671 -11.9719    2.9  49.7 -133.3   2.1688   4.0 ------	UNKNOWN
Post-slew image of 15-350 keV band
Time interval of the image:
55.252600 962.377000

# RAcent  DECcent POSerr Theta    Phi  PeakCts   SNR AngSep     Name
#  [deg]    [deg]    ['] [deg]  [deg]                   [']
264.6485 -44.6010    5.2  53.5  157.3   6.7691   2.2    9.9	4U 1735-44
 63.4289 -73.4413    2.8  13.6   37.4   2.0784   4.1 ------	UNKNOWN
284.2304 -38.3343    3.4  54.1  177.0   7.0620   3.3 ------	UNKNOWN
 16.6505 -36.5788    4.1  36.1  -77.1   4.4449   2.8 ------	UNKNOWN