Analysis Summary
Notes:
- 1) No attempt has been made to eliminate the non-significant decimal places.
- 2) This batgrbproduct analysis is done using the HEASARC data.
- 3) This batgrbproduct analysis is using the flight position for the mask-weighting calculation.
======================================================================
                  BAT GRB EVENT DATA PROCESSING REPORT
    Process Script Ver: batgrbproduct v2.46
    Process Start Time: Wed Jun  1 16:06:53 EDT 2016
             Host Name: bat1
   Current Working Dir: /local/data/bat1/alien/Swift_3rdBATcatalog/event/batevent_reproc/trigger682059
======================================================================

  Trigger: 00682059      Segment: 000

  BAT Trigger Time: 481789559.872   [s; MET]
      Trigger Stop: 481789560.256   [s; MET]
               UTC: 2016-04-08T06:25:43.777280    [includes UTCF correction]
       Where From?: TDRSS position message

  BAT
    RA: 122.557289379001   Dec: 71.1402129989282  [deg; J2000]

     Catalogged Source?: NO
     Point Source?:      YES
     GRB Indicated?:     YES    [ by BAT flight software ]
     Image S/N Ratio:    11.3
     Image Trigger?:     NO
     Rate S/N Ratio:     38.9615194775563  [ if not an image trigger ]
     Image S/N Ratio:    11.3

  Analysis Position:   [ source = BAT ]
    RA: 122.557289379001   Dec: 71.1402129989282  [deg; J2000]

  Refined Position:   [ source = BAT pre-slew burst ]
    RA: 122.562580624257   Dec: 71.1277445349553  [deg; J2000]
        { 08h 10m 15.0s , +71d 07' 39.9" }
         +/- 1.82274777644503 [arcmin] (estimated 90% radius based on SNR)
         +/- 1.02525558331457 [arcmin] (formal 1-sigma fit error)
    SNR: 12.9018456292583

  Angular difference between the analysis and refined position is 0.755118 arcmin

  Partial Coding Fraction: 0.3320312    [ including projection effects ]

  Duration
     T90: 0.319999933242798 +/- 0.0368781685195268
        Measured from: 0.0360000133514404
                   to: 0.355999946594238     [s; relative to TRIGTIME]
     T50: 0.179999947547913 +/- 0.0432666203311027
        Measured from: 0.100000023841858
                   to: 0.279999971389771     [s; relative to TRIGTIME]


  Fluence
     Peak Flux  (peak 1 second)
        Measured from: -0.303999960422516
                   to: 0.696000039577484     [s; relative to TRIGTIME]
     Total Fluence
        Measured from: 0.0160000324249268
                   to: 0.37200003862381     [s; relative to TRIGTIME]

             Band 1     Band 2     Band 3     Band 4
              15-25      25-50     50-100    100-350     keV
 Total     0.025989   0.056460   0.089163   0.054177
           0.007015   0.009561   0.010118   0.009378 [error]
 Peak      0.026241   0.076582   0.121650   0.051133
           0.011147   0.013469   0.013328   0.011762 [error]

     [ fluence units of on-axis counts / fully illuminated detector ]

======================================================================


====== Table of the duration information =============================

        Value   tstart    tstop
T100    0.356    0.016    0.372
T90     0.320    0.036    0.356
T50     0.180    0.100    0.280
Peak    1.000   -0.304    0.696


====== Spectral Analysis Summary =====================================

Model      : spectral model: simple power-law (PL) and cutoff power-law (CPL)
Ph_index   : photon index: E^{Ph_index}
Ph_90err   : 90% error of the photon index
Epeak      : Epeak in keV
Epeak_90err: 90% error of Epeak
Norm       : normalization at 50 keV in both the PL model and CPL model
Nomr_90err : 90% error of the normalization
chi2       : Chi-Squared
dof        : degree of freedo

=== Time-averaged spectral analysis ===
(Best model with acceptable fit: N/A)

Model Ph_index Ph_90err_low Ph_90err_hi  Epeak  Epeak_90err_low  Epeak_90err_hi  Norm       Nomr_90err_low    Norm_90err_hi    chi2    dof
PL      -0.868    -0.245      0.256       -           -               -         3.96e-02     -5.95e-03          5.87e-03      56.230   57
CPL     -0.487    -0.501      1.280      246.351    -246.351      -246.351      5.70e-02        N/A               N/A         55.840   56


=== 1-s peak spectral analysis ===
(Best model with acceptable fit: PL)

Model Ph_index Ph_90err_low Ph_90err_hi  Epeak  Epeak_90err_low  Epeak_90err_hi  Norm       Nomr_90err_low    Norm_90err_hi    chi2    dof
PL      -0.905     -0.244     0.258       -           -               -         1.84e-02     -2.97e-03          2.93e-03      53.870   57
CPL      0.550     -1.232     1.752      107.364     -27.916       221.663      7.32e-02     -7.32e-02          2.54e-01      49.640   56


=== Fluence/Peak Flux Summary ===

              Model    Band1     Band2     Band3     Band4     Band5     Total
                       15-25     25-50    50-100    100-350    15-150    15-350    keV
Fluence         PL   1.00e-08  2.71e-08  5.95e-08  3.42e-07  1.60e-07  4.39e-07   erg/cm2
      90%_error_low -2.90e-09 -5.08e-09 -9.14e-09 -1.06e-07 -2.45e-08 -1.12e-07   erg/cm2
      90%_error_hi   3.22e-09  4.95e-09  9.02e-09  1.36e-07  2.46e-08  1.38e-07   erg/cm2
Peak flux       PL   4.30e-01  6.18e-01  6.60e-01  1.31e+00  2.11e+00  3.02e+00   ph/cm2/s
      90%_error_low -1.31e-01 -1.27e-01 -1.02e-01 -3.73e-01 -3.38e-01 -4.79e-01   ph/cm2/s
      90%_error_hi   1.48e-01  1.26e-01  1.01e-01  4.58e-01  3.41e-01  4.94e-01   ph/cm2/s

Fluence        CPL   8.95e-09  2.76e-08  6.25e-08  2.22e-07  1.59e-07  3.21e-07   erg/cm2
      90%_error_low -3.88e-09 -5.36e-09 -1.14e-08 -1.43e-07 -2.51e-08 -1.43e-07   erg/cm2
      90%_error_hi   4.00e-09  5.46e-09  1.26e-08  1.43e-07  2.49e-08  1.52e-07   erg/cm2
Peak flux      CPL   2.73e-01  6.35e-01  7.83e-01  5.02e-01  2.01e+00  2.19e+00   ph/cm2/s
      90%_error_low -1.51e-01 -1.53e-01 -1.44e-01 -2.61e-01 -3.49e-01 -4.52e-01   ph/cm2/s
      90%_error_hi   1.87e-01  1.48e-01  1.49e-01  6.05e-01  3.53e-01  6.64e-01   ph/cm2/s

======================================================================
Image
Pre-slew 15.0-350.0 keV image (Event data)
#   RAcent    DECcent   POSerr    Theta     Phi              Peak Cts       SNR   Name
  122.5626    71.1277   0.0149    45.8567   -25.3478         0.2427134     12.902 TRIG_00682059

Foreground time interval of the image:
  0.016   0.372 (delta_t =   0.356 [sec])
Background time interval of the image:
-40.571   0.016 (delta_t =  40.587 [sec])
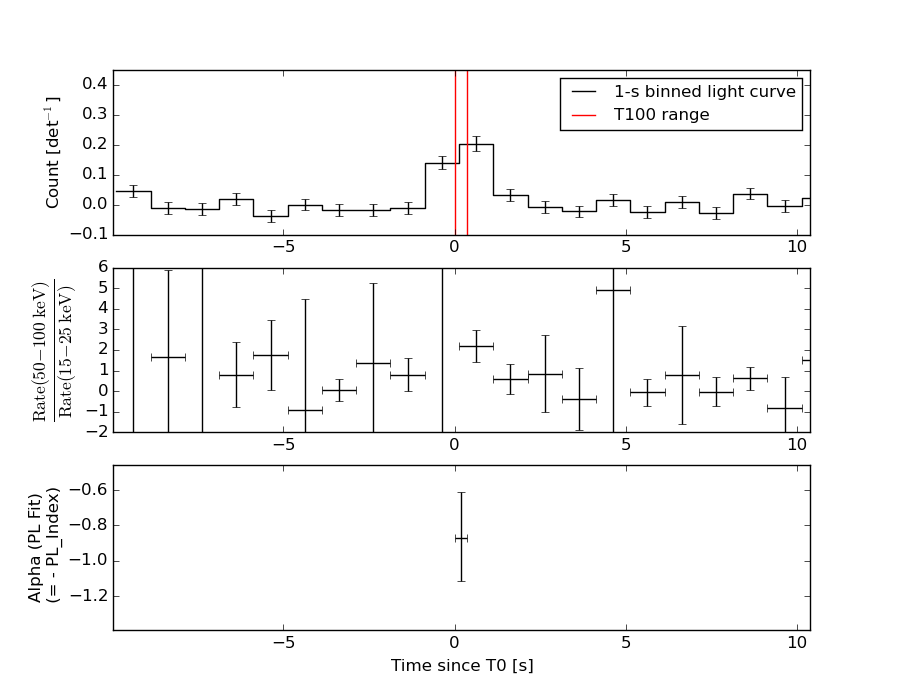
Light Curves
Note: The mask-weighted lightcurves have units of either count/det or counts/sec/det, where a det is 0.4 x 0.4 = 0.16 sq cm.
Full-time range; 1 s binning
Other quick-look light curves:
- 64 ms binning (zoomed)
- 16 ms binning (zoomed)
- 8 ms binning (zoomed)
- 2 ms binning (zoomed)
- SN=5 or 10 s binning (full-time range)
- Raw light curve
Spectra
- 64 ms binning (zoomed)
- 16 ms binning (zoomed)
- 8 ms binning (zoomed)
- 2 ms binning (zoomed)
- SN=5 or 10 s binning (full-time range)
- Raw light curve
Spectra
Notes:
- 1) The fitting includes the systematic errors.
- 2) When the burst includes telescope slew time periods, the fitting uses an average response file made from multiple 5-s response files through out the slew time plus single time preiod for the non-slew times, and weighted by the total counts in the corresponding time period using addrmf. An average response file is needed becuase a spectral fit using the pre-slew DRM will introduce some errors in both a spectral shape and a normalization if the PHA file contains a lot of the slew/post-slew time interval.
- 3) For fits to more complicated models (e.g. a power-law over a cutoff power-law), the BAT team has decided to require a chi-square improvement of more than 6 for each extra dof.
Time averaged spectrum fit using the average DRM
Power-law model
Time interval is from    0.016 sec. to    0.372 sec.

Spectral model in power-law:
------------------------------------------------------------
Parameters  : value       lower 90%   higher 90%
Photon index: -0.868494     ( -0.244942   0.25627 )
Norm@50keV  : 3.96136E-02    ( -0.00594644   0.00587144 )
------------------------------------------------------------
#Fit statistic : Chi-Squared =          56.23 using 59 PHA bins.
# Reduced chi-squared =         0.9865 for     57 degrees of freedom
# Null hypothesis probability =   5.038664e-01

Photon flux (15-150 keV)    in 0.356 sec: 0.171835 0.193786 0.191382 0.188935 0.186678 0.184342 0.114949 7.50212E-02 5.37835E-02 4.27296E-02 3.67811E-02 3.13924E-02 2.65794E-02 (    ) ph/cm2/s
Energy fluence (15-150 keV)             : 1.60258e-07 ( -2.45111e-08  2.45837e-08 ) ergs/cm2
Cutoff power-law model
Time interval is from    0.016 sec. to    0.372 sec.
Spectral model in the cutoff power-law:
------------------------------------------------------------
Parameters  : value       lower 90%   higher 90%
Photon index: -0.486533     ( -0.501304   1.28011 )
Epeak [keV] : 246.351      ( -246.321 -246.321 )
Norm@50keV  : 5.70015E-02    (     )
------------------------------------------------------------
#Fit statistic : Chi-Squared =          55.84 using 59 PHA bins.
# Reduced chi-squared =         0.9971 for     56 degrees of freedom
# Null hypothesis probability =   4.809578e-01

Photon flux (15-150 keV)    in 0.356 sec: 4.49549 ( -0.67663  0.68994 ) ph/cm2/s
Energy fluence (15-150 keV)             : 1.59269e-07 ( -2.51189e-08  2.49272e-08 ) ergs/cm2
1-s peak spectrum fit
Power-law model
Time interval is from   -0.304 sec. to    0.696 sec.

Spectral model in power-law:
------------------------------------------------------------
Parameters  : value       lower 90%   higher 90%
Photon index: -0.904721     ( -0.243922   0.258378 )
Norm@50keV  : 1.84231E-02    ( -0.00296828   0.00292739 )
------------------------------------------------------------
#Fit statistic : Chi-Squared =          53.87 using 59 PHA bins.
# Reduced chi-squared =         0.9450 for     57 degrees of freedom
# Null hypothesis probability =   5.934008e-01

Photon flux (15-150 keV)    in 1 sec: 2.11464 ( -0.33841  0.34083 ) ph/cm2/s
Energy fluence (15-150 keV)             : 2.064e-07 ( -3.21632e-08  3.22437e-08 ) ergs/cm2
Cutoff power-law model
Time interval is from   -0.304 sec. to    0.696 sec.
Spectral model in the cutoff power-law:
------------------------------------------------------------
Parameters  : value       lower 90%   higher 90%
Photon index: 0.550265     ( -1.23199   1.75178 )
Epeak [keV] : 107.364      ( -27.9155 221.663 )
Norm@50keV  : 7.31570E-02    ( -0.0731571   0.253614 )
------------------------------------------------------------
#Fit statistic : Chi-Squared =          49.64 using 59 PHA bins.
# Reduced chi-squared =         0.8864 for     56 degrees of freedom
# Null hypothesis probability =   7.128785e-01

Photon flux (15-150 keV)    in 1 sec: 2.01297 ( -0.34915  0.35259 ) ph/cm2/s
Energy fluence (15-150 keV)             : 1.98793e-07 ( -3.43028e-08  3.39464e-08 ) ergs/cm2
Time-resolved spectra
Distribution
T90 vs. Hardness ratio plot
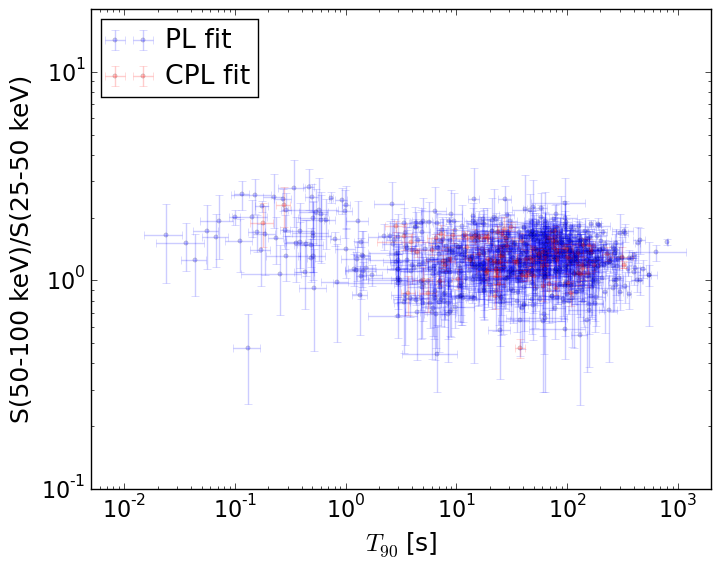
T90                                   = N/A sec.
Hardness ratio (energy fluence ratio) = N/A
S(15-50 keV) vs. S(50-150 keV) plot
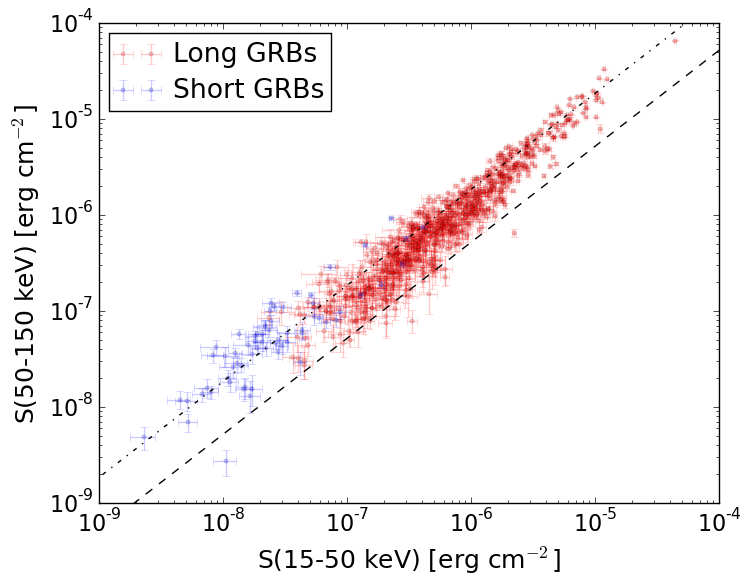
S(15-50 keV)  = N/A
S(50-150 keV) = N/A
The dash-dotted line and the dashed line traces the fluences calculated from the Band function with Epeak = 15 and 150 keV, respectively. Both lines assume a canonical values of alpha = -1 and beta = -2.5.
Mask shadow pattern
IMX = 9.311642255971224E-01, IMY = 4.411101652933436E-01
Spacecraft aspect plot
Bright source in the pre-burst/pre-slew/post-slew images
Pre-burst image of 15-350 keV band
Time interval of the image:
-40.571410 0.016000

# RAcent  DECcent POSerr Theta    Phi  PeakCts   SNR AngSep     Name
#  [deg]    [deg]    ['] [deg]  [deg]                   [']
131.1709 -26.7536    1.8  52.2  156.1   2.1750   6.4 ------	UNKNOWN
184.4816  51.2775    2.7  48.7   20.8   0.8202   4.3 ------	UNKNOWN
Pre-slew background subtracted image of 15-350 keV band
Time interval of the image:
0.016000 0.372000

# RAcent  DECcent POSerr Theta    Phi  PeakCts   SNR AngSep     Name
#  [deg]    [deg]    ['] [deg]  [deg]                   [']
125.3071 -21.0625    2.6  46.7  163.4   0.0846   4.5 ------	UNKNOWN
 99.1154 -23.9707    2.4  57.6 -168.8   0.1729   4.8 ------	UNKNOWN
184.8144  79.3265    2.5  58.8  -11.9   0.2611   4.5 ------	UNKNOWN
122.5626  71.1278    0.9  45.9  -25.3   0.2427  12.9 ------	UNKNOWN
 95.3854  26.3688    2.2  30.7 -102.8   0.0723   5.2 ------	UNKNOWN
Post-slew image of 15-350 keV band
Time interval of the image:
78.828600 962.192200

# RAcent  DECcent POSerr Theta    Phi  PeakCts   SNR AngSep     Name
#  [deg]    [deg]    ['] [deg]  [deg]                   [']
 83.6177  22.0179    0.8  54.0 -150.4  31.4507  13.9    0.9	Crab
170.0291  75.1479    4.3  13.9   35.3   1.3179   2.7 ------	UNKNOWN
321.6205  58.8672    4.0  49.3  -29.4   3.5871   2.9 ------	UNKNOWN