Analysis Summary
Notes:
- 1) No attempt has been made to eliminate the non-significant decimal places.
- 2) This batgrbproduct analysis is done using the HEASARC data.
- 3) This batgrbproduct analysis is using the flight position for the mask-weighting calculation.
======================================================================
BAT GRB EVENT DATA PROCESSING REPORT
Process Script Ver: batgrbproduct v2.46
Process Start Time: Fri Jun 3 17:05:03 EDT 2016
Host Name: bat1
Current Working Dir: /local/data/bat1/alien/Swift_3rdBATcatalog/event/scripts
======================================================================
Trigger: 00682269 Segment: 000
BAT Trigger Time: 481957804.16 [s; MET]
Trigger Stop: 481957804.416 [s; MET]
UTC: 2016-04-10T05:09:48.056060 [includes UTCF correction]
Where From?: TDRSS position message
BAT
RA: 150.68072928178 Dec: 3.44358286327285 [deg; J2000]
Catalogged Source?: NO
Point Source?: YES
GRB Indicated?: YES [ by BAT flight software ]
Image S/N Ratio: 9.07
Image Trigger?: NO
Rate S/N Ratio: 55.0726792520575 [ if not an image trigger ]
Image S/N Ratio: 9.07
Analysis Position: [ source = BAT ]
RA: 150.68072928178 Dec: 3.44358286327285 [deg; J2000]
Refined Position: [ source = BAT pre-slew burst ]
RA: 150.709641740265 Dec: 3.44551357729276 [deg; J2000]
{ 10h 02m 50.3s , +03d 26' 43.8" }
+/- 2.1684313082 [arcmin] (estimated 90% radius based on SNR)
+/- 1.10189740841201 [arcmin] (formal 1-sigma fit error)
SNR: 10.0672367343468
Angular difference between the analysis and refined position is 1.735484 arcmin
Partial Coding Fraction: 0.3789062 [ including projection effects ]
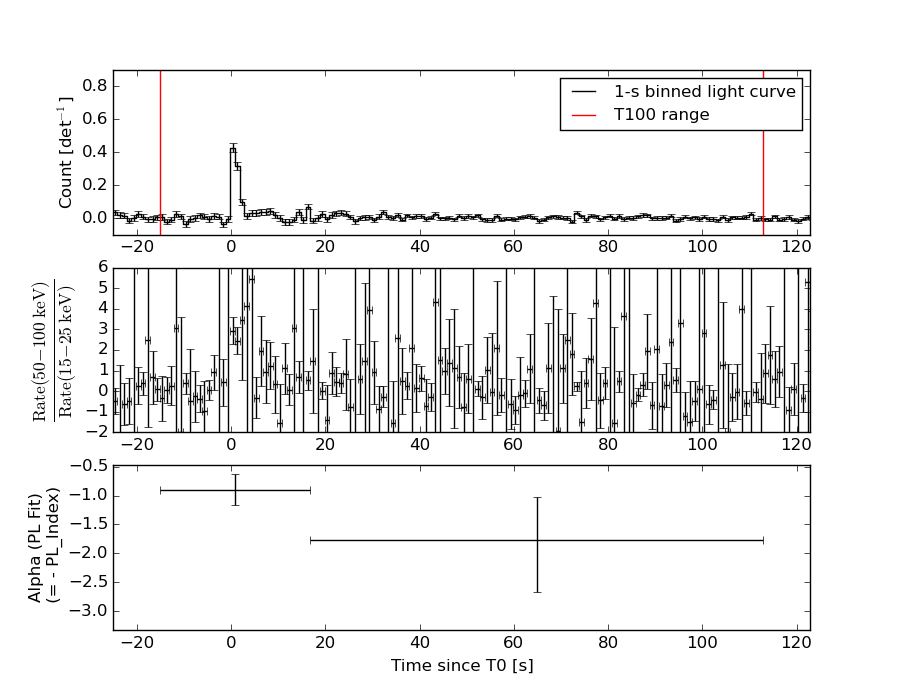
Duration
T90: 96 +/- 50.5964425626941
Measured from: -15.160000026226
to: 80.839999973774 [s; relative to TRIGTIME]
T50: 32 +/- 16
Measured from: -15.160000026226
to: 16.839999973774 [s; relative to TRIGTIME]
Fluence
Peak Flux (peak 1 second)
Measured from: 8.33999997377396
to: 9.33999997377396 [s; relative to TRIGTIME]
Total Fluence
Measured from: -15.160000026226
to: 112.839999973774 [s; relative to TRIGTIME]
Band 1 Band 2 Band 3 Band 4
15-25 25-50 50-100 100-350 keV
Total 0.349837 0.477759 0.587998 0.130462
0.077945 0.081874 0.073368 0.066829 [error]
Peak 0.009618 0.010493 0.017626 0.007900
0.009014 0.009686 0.008696 0.007686 [error]
[ fluence units of on-axis counts / fully illuminated detector ]
======================================================================
====== Table of the duration information =============================
Value tstart tstop
T100 128.000 -15.160 112.840
T90 96.000 -15.160 80.840
T50 32.000 -15.160 16.840
Peak 1.000 8.340 9.340
====== Spectral Analysis Summary =====================================
Model : spectral model: simple power-law (PL) and cutoff power-law (CPL)
Ph_index : photon index: E^{Ph_index}
Ph_90err : 90% error of the photon index
Epeak : Epeak in keV
Epeak_90err: 90% error of Epeak
Norm : normalization at 50 keV in both the PL model and CPL model
Nomr_90err : 90% error of the normalization
chi2 : Chi-Squared
dof : degree of freedo
=== Time-averaged spectral analysis ===
(Best model with acceptable fit: PL)
Model Ph_index Ph_90err_low Ph_90err_hi Epeak Epeak_90err_low Epeak_90err_hi Norm Nomr_90err_low Norm_90err_hi chi2 dof
PL -1.106 -0.278 0.288 - - - 8.62e-04 -1.29e-04 1.28e-04 64.890 57
CPL -1.106 -1.532 0.755 9999.360 N/A N/A 8.67e-04 N/A N/A 64.890 56
=== 1-s peak spectral analysis ===
(Best model with acceptable fit: N/A)
Model Ph_index Ph_90err_low Ph_90err_hi Epeak Epeak_90err_low Epeak_90err_hi Norm Nomr_90err_low Norm_90err_hi chi2 dof
PL -1.062 -0.937 1.373 - - - 3.02e-03 -3.02e-03 1.83e-03 53.350 57
CPL -0.004 -7.589 0.004 108.227 -108.227 -108.227 9.09e-03 -9.09e-03 7.11e+02 53.140 56
=== Fluence/Peak Flux Summary ===
Model Band1 Band2 Band3 Band4 Band5 Total
15-25 25-50 50-100 100-350 15-150 15-350 keV
Fluence PL 9.76e-08 2.28e-07 4.24e-07 1.90e-06 1.15e-06 2.65e-06 erg/cm2
90%_error_low -2.95e-08 -4.32e-08 -7.17e-08 -6.60e-07 -1.83e-07 -7.03e-07 erg/cm2
90%_error_hi 3.31e-08 4.18e-08 7.01e-08 8.84e-07 1.84e-07 8.97e-07 erg/cm2
Peak flux PL 8.17e-02 1.07e-01 1.02e-01 1.74e-01 3.49e-01 4.65e-01 ph/cm2/s
90%_error_low -8.17e-02 -8.37e-02 -1.02e-01 -1.74e-01 -2.18e-01 -2.67e-01 ph/cm2/s
90%_error_hi 1.18e-01 8.28e-02 5.92e-02 3.31e-01 2.29e-01 5.17e-01 ph/cm2/s
Fluence CPL 9.75e-08 2.28e-07 4.20e-07 1.98e-06 1.15e-06 2.64e-06 erg/cm2
90%_error_low N/A N/A -7.23e-08 N/A -1.96e-07 -1.42e-06 erg/cm2
90%_error_hi N/A N/A 9.15e-08 N/A 1.91e-07 4.13e-07 erg/cm2
Peak flux CPL 6.32e-02 1.15e-01 1.18e-01 7.69e-02 3.43e-01 3.73e-01 ph/cm2/s
90%_error_low -6.32e-02 -9.57e-02 -1.18e-01 -7.69e-02 -2.09e-01 -2.38e-01 ph/cm2/s
90%_error_hi 1.25e-01 1.07e-01 8.93e-02 1.62e-01 2.29e-01 2.76e-01 ph/cm2/s
======================================================================
Image
Pre-slew 15.0-350.0 keV image (Event data)
#   RAcent    DECcent   POSerr    Theta     Phi              Peak Cts       SNR   Name
  150.7096     3.4455   0.0191    36.7529   148.8867         1.0276269     10.067 TRIG_00682269

Foreground time interval of the image:
-15.160   9.741 (delta_t =  24.901 [sec])
Background time interval of the image:
-239.160 -15.160 (delta_t = 224.000 [sec])
Light Curves
Note: The mask-weighted lightcurves have units of either count/det or counts/sec/det, where a det is 0.4 x 0.4 = 0.16 sq cm.
Full-time range; 1 s binning
Other quick-look light curves:
- 64 ms binning (zoomed)
- 16 ms binning (zoomed)
- 8 ms binning (zoomed)
- 2 ms binning (zoomed)
- SN=5 or 10 s binning (full-time range)
- Raw light curve
Spectra
- 64 ms binning (zoomed)
- 16 ms binning (zoomed)
- 8 ms binning (zoomed)
- 2 ms binning (zoomed)
- SN=5 or 10 s binning (full-time range)
- Raw light curve
Spectra
Notes:
- 1) The fitting includes the systematic errors.
- 2) When the burst includes telescope slew time periods, the fitting uses an average response file made from multiple 5-s response files through out the slew time plus single time preiod for the non-slew times, and weighted by the total counts in the corresponding time period using addrmf. An average response file is needed becuase a spectral fit using the pre-slew DRM will introduce some errors in both a spectral shape and a normalization if the PHA file contains a lot of the slew/post-slew time interval.
- 3) For fits to more complicated models (e.g. a power-law over a cutoff power-law), the BAT team has decided to require a chi-square improvement of more than 6 for each extra dof.
Time averaged spectrum fit using the average DRM
Power-law model
Time interval is from  -15.160 sec. to  112.840 sec.

Spectral model in power-law:
------------------------------------------------------------
Parameters  : value       lower 90%   higher 90%
Photon index: -1.10617     ( -0.277808   0.287645 )
Norm@50keV  : 8.62391E-04    ( -0.000129296   0.000128435 )
------------------------------------------------------------
#Fit statistic : Chi-Squared =          64.89 using 59 PHA bins.
# Reduced chi-squared =          1.138 for     57 degrees of freedom
# Null hypothesis probability =   2.209705e-01

Photon flux (15-150 keV)    in 128 sec: 0.100092 ( -0.0156364  0.015735 ) ph/cm2/s
Energy fluence (15-150 keV)             : 1.15197e-06 ( -1.82529e-07  1.83583e-07 ) ergs/cm2
Cutoff power-law model
Time interval is from  -15.160 sec. to  112.840 sec.
Spectral model in the cutoff power-law:
------------------------------------------------------------
Parameters  : value       lower 90%   higher 90%
Photon index: -2.09635     ( -0.541901   1.74566 )
Epeak [keV] : 34.7861      (   )
Norm@50keV  : 1.89117E-04    (     )
------------------------------------------------------------
#Fit statistic : Chi-Squared =          63.86 using 59 PHA bins.
# Reduced chi-squared =          1.140 for     56 degrees of freedom
# Null hypothesis probability =   2.198788e-01

Photon flux (15-150 keV)    in 128 sec: 0.100609 (    ) ph/cm2/s
Energy fluence (15-150 keV)             : 1.15486e-06 ( -1.96146e-07  1.91277e-07 ) ergs/cm2
1-s peak spectrum fit
Power-law model
Time interval is from    8.340 sec. to    9.340 sec.

Spectral model in power-law:
------------------------------------------------------------
Parameters  : value       lower 90%   higher 90%
Photon index: -1.06187     ( -0.936971   1.37306 )
Norm@50keV  : 3.01668E-03    ( -0.00301679   0.00183132 )
------------------------------------------------------------
#Fit statistic : Chi-Squared =          53.35 using 59 PHA bins.
# Reduced chi-squared =         0.9360 for     57 degrees of freedom
# Null hypothesis probability =   6.126143e-01

Photon flux (15-150 keV)    in 1 sec: 0.348753 ( -0.217917  0.228926 ) ph/cm2/s
Energy fluence (15-150 keV)             : 3.19374e-08 ( -1.84132e-08  1.84974e-08 ) ergs/cm2
Cutoff power-law model
Time interval is from    8.340 sec. to    9.340 sec.
Spectral model in the cutoff power-law:
------------------------------------------------------------
Parameters  : value       lower 90%   higher 90%
Photon index: -0.00427357     ( -7.5886   0.00494824 )
Epeak [keV] : 108.227      ( -108.225 -108.225 )
Norm@50keV  : 9.09143E-03    ( -0.00908978   711.039 )
------------------------------------------------------------
#Fit statistic : Chi-Squared =          53.14 using 59 PHA bins.
# Reduced chi-squared =         0.9489 for     56 degrees of freedom
# Null hypothesis probability =   5.839199e-01

Photon flux (15-150 keV)    in 1 sec: 0.342949 ( -0.209239  0.229127 ) ph/cm2/s
Energy fluence (15-150 keV)             : 3.12795e-08 ( -2.05769e-08  1.81459e-08 ) ergs/cm2
Time-resolved spectra
Distribution
T90 vs. Hardness ratio plot
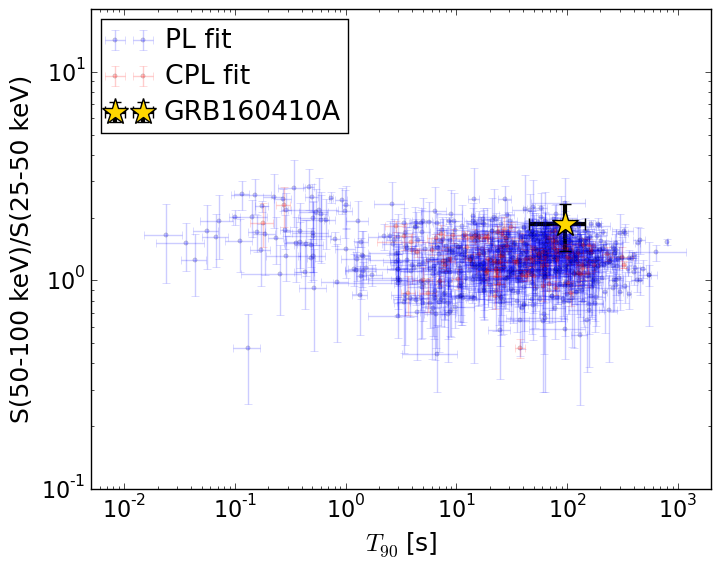
T90                                   = 96.0 sec.
Hardness ratio (energy fluence ratio) = 1.85810364194
S(15-50 keV) vs. S(50-150 keV) plot
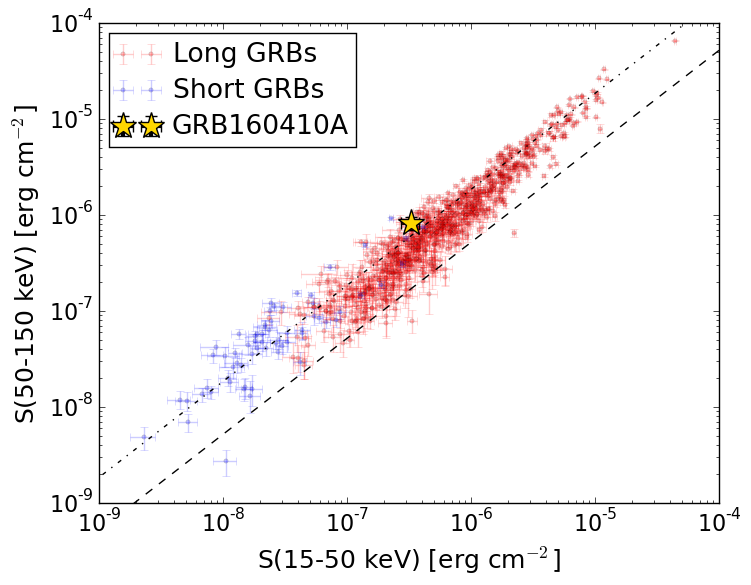
S(15-50 keV)  = 3.26033e-07
S(50-150 keV) = 8.259401e-07
The dash-dotted line and the dashed line traces the fluences calculated from the Band function with Epeak = 15 and 150 keV, respectively. Both lines assume a canonical values of alpha = -1 and beta = -2.5.
Mask shadow pattern
IMX = -6.393836340852224E-01, IMY = -3.859028865711088E-01
Spacecraft aspect plot
Bright source in the pre-burst/pre-slew/post-slew images
Pre-burst image of 15-350 keV band
Time interval of the image:
-239.160000 -15.160000

# RAcent  DECcent POSerr Theta    Phi  PeakCts   SNR AngSep     Name
#  [deg]    [deg]    ['] [deg]  [deg]                   [']
147.3434  -8.4946    2.6  49.0  151.4   3.2683   4.5 ------	UNKNOWN
222.0955  41.3170    2.6  49.0   25.8   2.6156   4.5 ------	UNKNOWN
165.9325  65.8878    2.6  26.6  -30.7   0.8565   4.5 ------	UNKNOWN
Pre-slew background subtracted image of 15-350 keV band
Time interval of the image:
-15.160000 9.740600

# RAcent  DECcent POSerr Theta    Phi  PeakCts   SNR AngSep     Name
#  [deg]    [deg]    ['] [deg]  [deg]                   [']
150.7096   3.4455    1.1  36.8  148.9   1.0275  10.1 ------	UNKNOWN
250.3594  70.1454    2.2  54.3  -15.2   0.8618   5.3 ------	UNKNOWN
Post-slew image of 15-350 keV band
Time interval of the image:
71.740600 483.120000

# RAcent  DECcent POSerr Theta    Phi  PeakCts   SNR AngSep     Name
#  [deg]    [deg]    ['] [deg]  [deg]                   [']
135.5390 -40.5682    1.2  46.2 -177.5   3.8382   9.5    0.9	Vela X-1
179.4635  26.3619    2.2  35.8   34.0   1.6089   5.2 ------	UNKNOWN
131.7887 -21.6108    2.8  31.2 -157.9   0.9995   4.1 ------	UNKNOWN
132.5817  28.4324    2.1  30.3  -46.2   1.4230   5.5 ------	UNKNOWN
109.0034 -40.2077    3.7  58.0 -156.7   4.1751   3.2 ------	UNKNOWN
116.9801  18.0305    3.4  36.1  -77.1   1.7662   3.4 ------	UNKNOWN