Analysis Summary
Notes:
- 1) No attempt has been made to eliminate the non-significant decimal places.
- 2) This batgrbproduct analysis is done using the HEASARC data.
- 3) This batgrbproduct analysis is using the flight position for the mask-weighting calculation.
======================================================================
                  BAT GRB EVENT DATA PROCESSING REPORT
    Process Script Ver: batgrbproduct v2.46
    Process Start Time: Wed Jun  1 15:37:22 EDT 2016
             Host Name: bat1
   Current Working Dir: /local/data/bat1/alien/Swift_3rdBATcatalog/event/batevent_reproc/trigger683906
======================================================================

  Trigger: 00683906      Segment: 000

  BAT Trigger Time: 483191363.52   [s; MET]
      Trigger Stop: 483191364.544   [s; MET]
               UTC: 2016-04-24T11:49:07.348300    [includes UTCF correction]
       Where From?: TDRSS position message

  BAT
    RA: 319.480565124725   Dec: -60.4052836164155  [deg; J2000]

     Catalogged Source?: NO
     Point Source?:      YES
     GRB Indicated?:     YES    [ by BAT flight software ]
     Image S/N Ratio:    15.78
     Image Trigger?:     NO
     Rate S/N Ratio:     43.5086198356142  [ if not an image trigger ]
     Image S/N Ratio:    15.78

  Analysis Position:   [ source = BAT ]
    RA: 319.480565124725   Dec: -60.4052836164155  [deg; J2000]

  Refined Position:   [ source = BAT pre-slew burst ]
    RA: 319.48462934057   Dec: -60.4081088330894  [deg; J2000]
        { 21h 17m 56.3s , -60d 24' 29.2" }
         +/- 1.13082706229561 [arcmin] (estimated 90% radius based on SNR)
         +/- 0.419566901776941 [arcmin] (formal 1-sigma fit error)
    SNR: 25.5174988547371

  Angular difference between the analysis and refined position is 0.207934 arcmin

  Partial Coding Fraction: 0.3359375    [ including projection effects ]

  Duration
     T90: 6.4640000462532 +/- 0.951697413545641
        Measured from: -0.879999995231628
                   to: 5.58400005102158     [s; relative to TRIGTIME]
     T50: 1.98400002717972 +/- 0.354175118295394
        Measured from: 0.0960000157356262
                   to: 2.08000004291534     [s; relative to TRIGTIME]


  Fluence
     Peak Flux  (peak 1 second)
        Measured from: 0.0680000185966492
                   to: 1.06800001859665     [s; relative to TRIGTIME]
     Total Fluence
        Measured from: -1.42399996519089
                   to: 6.73600000143051     [s; relative to TRIGTIME]

             Band 1     Band 2     Band 3     Band 4
              15-25      25-50     50-100    100-350     keV
 Total     0.392838   0.687849   0.568343   0.183438
           0.034348   0.037512   0.034184   0.027809 [error]
 Peak      0.116218   0.200956   0.232535   0.085746
           0.013395   0.015500   0.015920   0.012445 [error]

     [ fluence units of on-axis counts / fully illuminated detector ]

======================================================================


====== Table of the duration information =============================

        Value   tstart    tstop
T100    8.160   -1.424    6.736
T90     6.464   -0.880    5.584
T50     1.984    0.096    2.080
Peak    1.000    0.068    1.068


====== Spectral Analysis Summary =====================================

Model      : spectral model: simple power-law (PL) and cutoff power-law (CPL)
Ph_index   : photon index: E^{Ph_index}
Ph_90err   : 90% error of the photon index
Epeak      : Epeak in keV
Epeak_90err: 90% error of Epeak
Norm       : normalization at 50 keV in both the PL model and CPL model
Nomr_90err : 90% error of the normalization
chi2       : Chi-Squared
dof        : degree of freedo

=== Time-averaged spectral analysis ===
(Best model with acceptable fit: PL)

Model Ph_index Ph_90err_low Ph_90err_hi  Epeak  Epeak_90err_low  Epeak_90err_hi  Norm       Nomr_90err_low    Norm_90err_hi    chi2    dof
PL      -1.400    -0.104      0.104       -           -               -         1.58e-02     -9.53e-04          9.53e-04      50.790   57
CPL     -1.105    -0.342      0.440      163.538     -67.656      -163.538      2.18e-02     -6.58e-03          1.30e-02      49.220   56


=== 1-s peak spectral analysis ===
(Best model with acceptable fit: PL)

Model Ph_index Ph_90err_low Ph_90err_hi  Epeak  Epeak_90err_low  Epeak_90err_hi  Norm       Nomr_90err_low    Norm_90err_hi    chi2    dof
PL      -1.143     -0.129     0.130       -           -               -         4.37e-02     -3.31e-03          3.31e-03      62.750   57
CPL     -0.879     -0.327     0.551      248.160    -248.160      -248.160      5.72e-02     -1.60e-02          4.09e-02      61.940   56


=== Fluence/Peak Flux Summary ===

              Model    Band1     Band2     Band3     Band4     Band5     Total
                       15-25     25-50    50-100    100-350    15-150    15-350    keV
Fluence         PL   1.50e-07  2.93e-07  4.44e-07  1.46e-06  1.25e-06  2.35e-06   erg/cm2
      90%_error_low -1.65e-08 -1.99e-08 -3.24e-08 -2.21e-07 -8.05e-08 -2.44e-07   erg/cm2
      90%_error_hi   1.71e-08  1.98e-08  3.22e-08  2.45e-07  8.07e-08  2.63e-07   erg/cm2
Peak flux       PL   1.28e+00  1.59e+00  1.44e+00  2.27e+00  5.09e+00  6.58e+00   ph/cm2/s
      90%_error_low -1.88e-01 -1.48e-01 -1.21e-01 -3.80e-01 -4.00e-01 -5.18e-01   ph/cm2/s
      90%_error_hi   1.98e-01  1.46e-01  1.20e-01  4.23e-01  4.01e-01  5.23e-01   ph/cm2/s

Fluence        CPL   1.41e-07  3.01e-07  4.57e-07  9.81e-07  1.23e-06  1.88e-06   erg/cm2
      90%_error_low -2.02e-08 -2.26e-08 -3.70e-08 -3.93e-07 -8.53e-08 -3.95e-07   erg/cm2
      90%_error_hi   2.06e-08  2.31e-08  3.77e-08  5.59e-07  8.48e-08  5.65e-07   erg/cm2
Peak flux      CPL   6.17e-01  4.81e-01  2.63e-01  2.51e-01  1.46e+00  1.68e+00   ph/cm2/s
      90%_error_low -3.24e-01 -2.38e-01 -9.30e-02 -2.84e-02 -7.00e-01 -7.22e-01   ph/cm2/s
      90%_error_hi   2.48e-01  1.51e-01  5.45e-02  2.38e-02  4.26e-01  3.15e-01   ph/cm2/s

======================================================================
Image
Pre-slew 15.0-350.0 keV image (Event data)
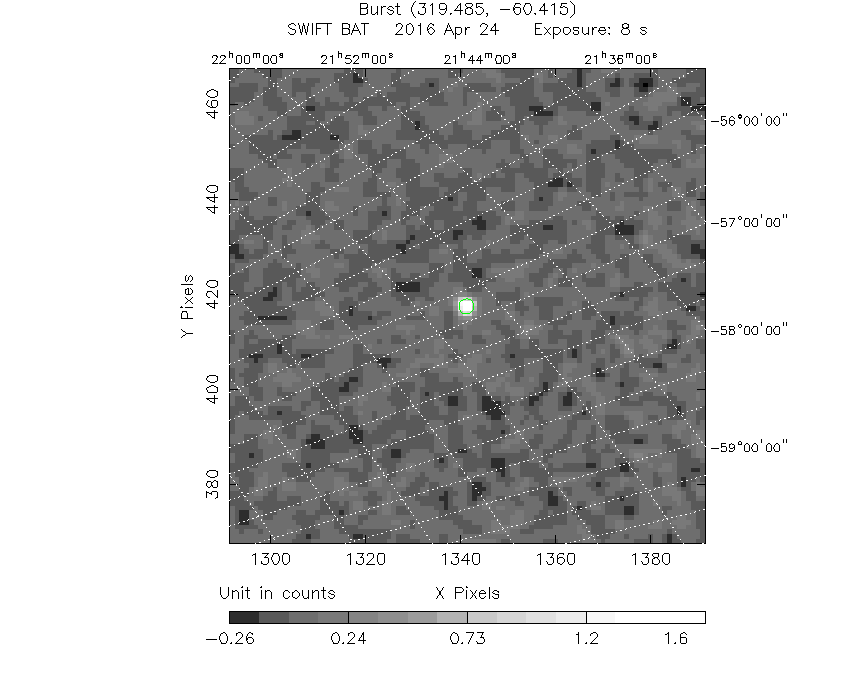
#   RAcent    DECcent   POSerr    Theta     Phi              Peak Cts       SNR   Name
  319.4846   -60.4081   0.0076    44.3598   172.6921         1.8508401     25.517 TRIG_00683906

Foreground time interval of the image:
 -1.424   6.736 (delta_t =   8.160 [sec])
Background time interval of the image:
-239.520  -1.424 (delta_t = 238.096 [sec])
Light Curves
Note: The mask-weighted lightcurves have units of either count/det or counts/sec/det, where a det is 0.4 x 0.4 = 0.16 sq cm.
Full-time range; 1 s binning
Other quick-look light curves:
- 64 ms binning (zoomed)
- 16 ms binning (zoomed)
- 8 ms binning (zoomed)
- 2 ms binning (zoomed)
- SN=5 or 10 s binning (full-time range)
- Raw light curve
Spectra
- 64 ms binning (zoomed)
- 16 ms binning (zoomed)
- 8 ms binning (zoomed)
- 2 ms binning (zoomed)
- SN=5 or 10 s binning (full-time range)
- Raw light curve
Spectra
Notes:
- 1) The fitting includes the systematic errors.
- 2) When the burst includes telescope slew time periods, the fitting uses an average response file made from multiple 5-s response files through out the slew time plus single time preiod for the non-slew times, and weighted by the total counts in the corresponding time period using addrmf. An average response file is needed becuase a spectral fit using the pre-slew DRM will introduce some errors in both a spectral shape and a normalization if the PHA file contains a lot of the slew/post-slew time interval.
- 3) For fits to more complicated models (e.g. a power-law over a cutoff power-law), the BAT team has decided to require a chi-square improvement of more than 6 for each extra dof.
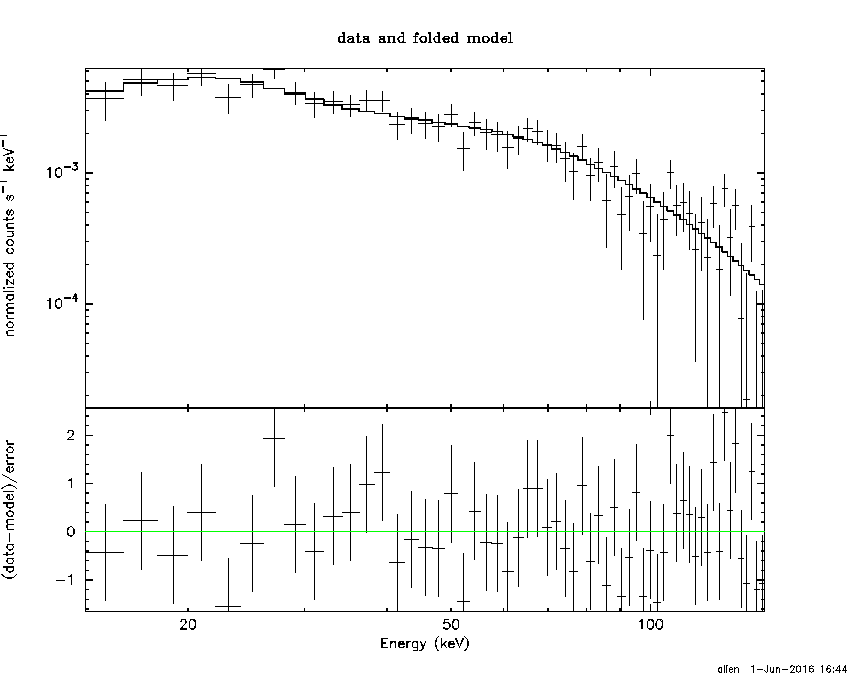
Time averaged spectrum fit using the average DRM
Power-law model

Time interval is from   -1.424 sec. to    6.736 sec.

Spectral model in power-law:
------------------------------------------------------------
Parameters  : value       lower 90%   higher 90%
Photon index: -1.40043     ( -0.103983   0.104163 )
Norm@50keV  : 1.57901E-02    ( -0.000952744   0.00095257 )
------------------------------------------------------------
#Fit statistic : Chi-Squared =          50.79 using 59 PHA bins.
# Reduced chi-squared =         0.8911 for     57 degrees of freedom
# Null hypothesis probability =   7.057564e-01

Photon flux (15-150 keV)    in 8.16 sec: 1.92316 ( -0.12274  0.12301 ) ph/cm2/s
Energy fluence (15-150 keV)             : 1.24506e-06 ( -8.04519e-08  8.06845e-08 ) ergs/cm2
Cutoff power-law model
Time interval is from   -1.424 sec. to    6.736 sec.
Spectral model in the cutoff power-law:
------------------------------------------------------------
Parameters  : value       lower 90%   higher 90%
Photon index: -1.10461     ( -0.341897   0.439562 )
Epeak [keV] : 163.538      ( -67.6566 -163.538 )
Norm@50keV  : 2.18320E-02    ( -0.0065832   0.0130122 )
------------------------------------------------------------
#Fit statistic : Chi-Squared =          49.22 using 59 PHA bins.
# Reduced chi-squared =         0.8789 for     56 degrees of freedom
# Null hypothesis probability =   7.273753e-01

Photon flux (15-150 keV)    in 8.16 sec: 1.89858 ( -0.12706  0.12726 ) ph/cm2/s
Energy fluence (15-150 keV)             : 1.22693e-06 ( -8.53128e-08  8.47571e-08 ) ergs/cm2
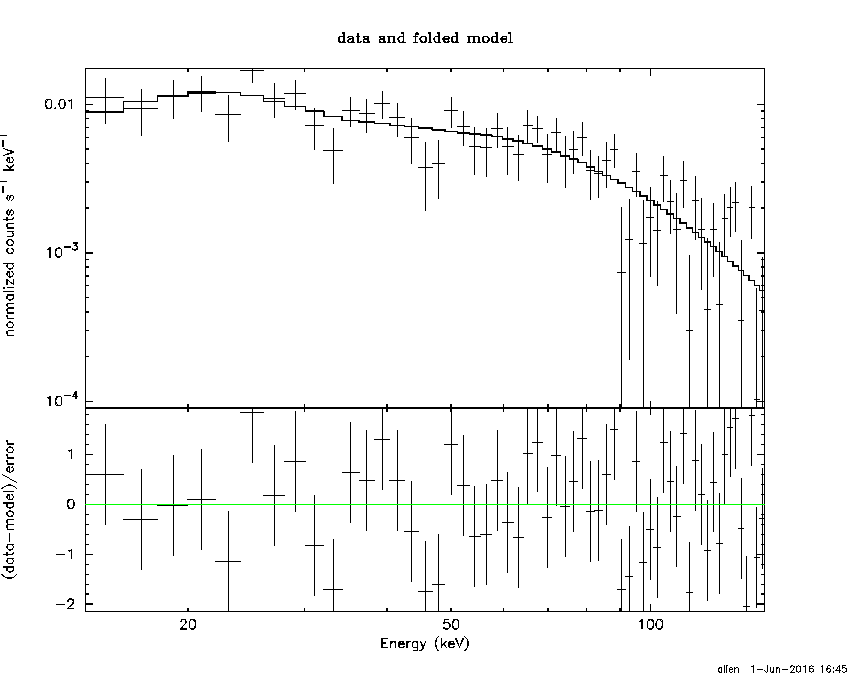
1-s peak spectrum fit
Power-law model

Time interval is from    0.068 sec. to    1.068 sec.

Spectral model in power-law:
------------------------------------------------------------
Parameters  : value       lower 90%   higher 90%
Photon index: -1.14321     ( -0.129078   0.130175 )
Norm@50keV  : 4.36651E-02    ( -0.00331107   0.0033054 )
------------------------------------------------------------
#Fit statistic : Chi-Squared =          62.75 using 59 PHA bins.
# Reduced chi-squared =          1.101 for     57 degrees of freedom
# Null hypothesis probability =   2.797050e-01

Photon flux (15-150 keV)    in 1 sec: 5.08819 ( -0.40038  0.40112 ) ph/cm2/s
Energy fluence (15-150 keV)             : 4.50474e-07 ( -3.65792e-08  3.67291e-08 ) ergs/cm2
Cutoff power-law model
Time interval is from    0.068 sec. to    1.068 sec.
Spectral model in the cutoff power-law:
------------------------------------------------------------
Parameters  : value       lower 90%   higher 90%
Photon index: -0.87885     ( -0.327243   0.551403 )
Epeak [keV] : 248.160      ( -248.16 -248.16 )
Norm@50keV  : 5.71722E-02    ( -0.0160036   0.0409074 )
------------------------------------------------------------
#Fit statistic : Chi-Squared =          61.94 using 59 PHA bins.
# Reduced chi-squared =          1.106 for     56 degrees of freedom
# Null hypothesis probability =   2.724556e-01

Photon flux (15-150 keV)    in 1 sec: 1.46068 ( -0.700342  0.42559 ) ph/cm2/s
Energy fluence (15-150 keV)             : 4.47208e-07 ( -3.75891e-08  3.74551e-08 ) ergs/cm2
Time-resolved spectra
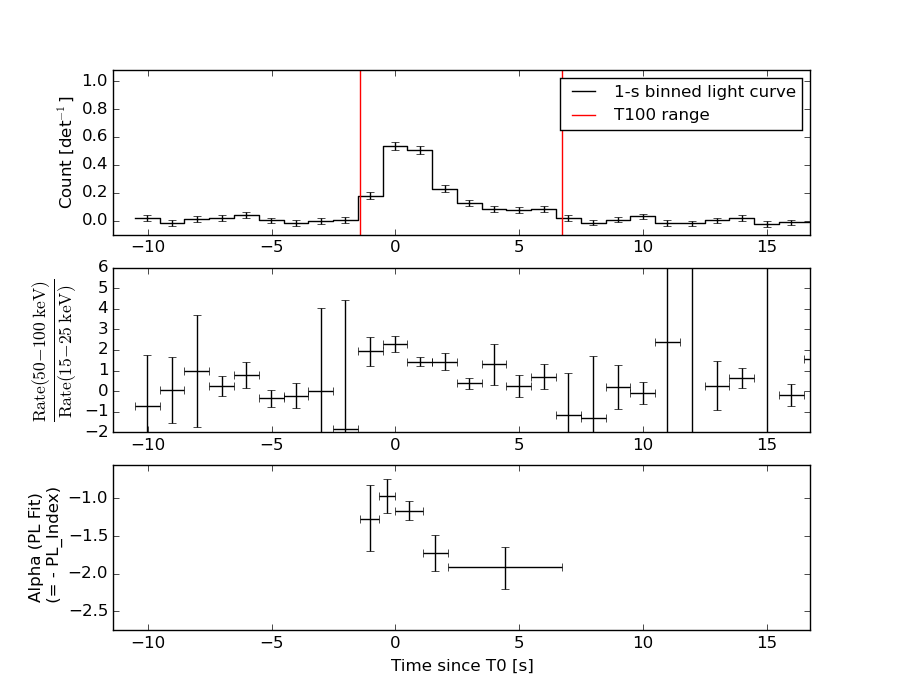
Distribution
T90 vs. Hardness ratio plot
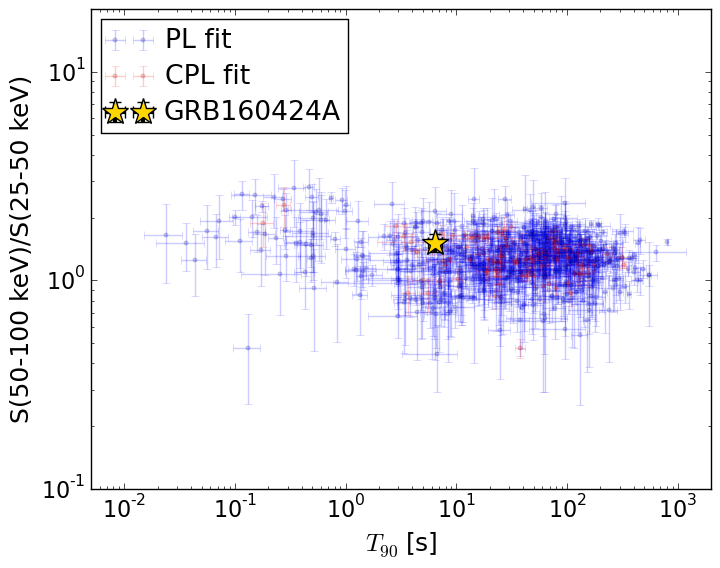
T90                                   = 6.464 sec.
Hardness ratio (energy fluence ratio) = 1.51530482909
S(15-50 keV) vs. S(50-150 keV) plot
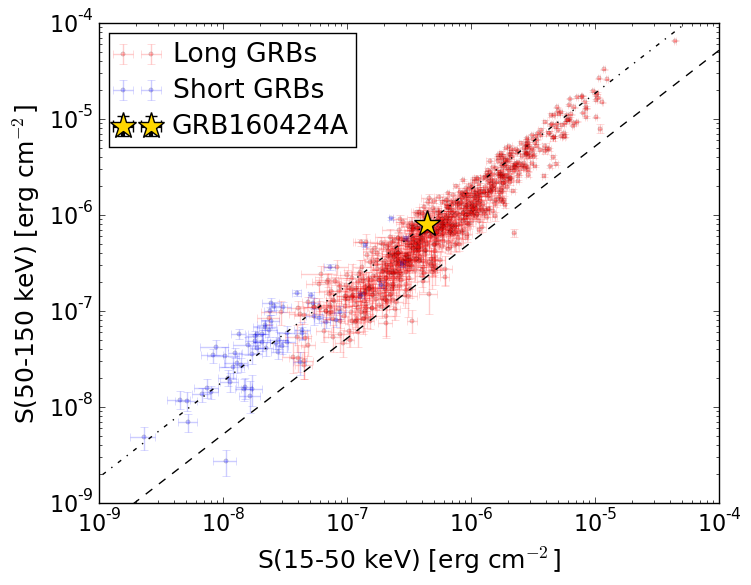
S(15-50 keV)  = 4.425804e-07
S(50-150 keV) = 8.024759e-07
The dash-dotted line and the dashed line traces the fluences calculated from the Band function with Epeak = 15 and 150 keV, respectively. Both lines assume a canonical values of alpha = -1 and beta = -2.5.
Mask shadow pattern
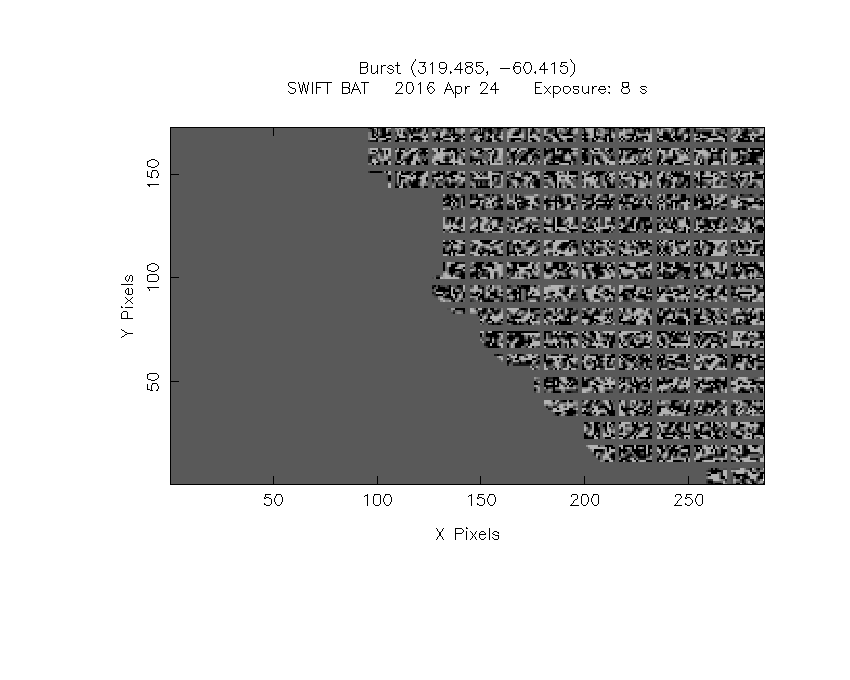
IMX = -9.699563817779852E-01, IMY = -1.243905168047467E-01
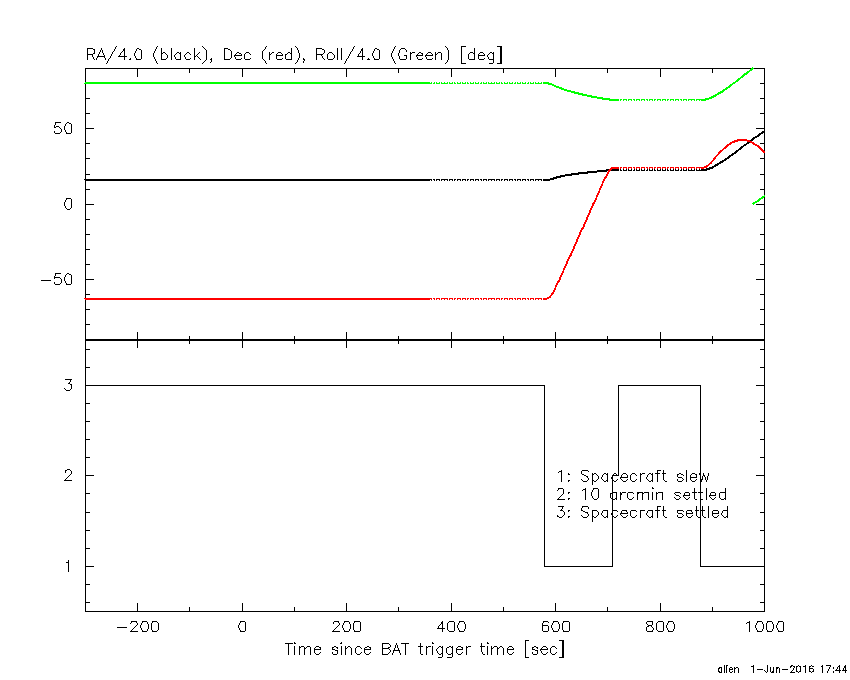
Spacecraft aspect plot
Bright source in the pre-burst/pre-slew/post-slew images
Pre-burst image of 15-350 keV band
Time interval of the image:
-239.520000 -1.424000

# RAcent  DECcent POSerr Theta    Phi  PeakCts   SNR AngSep     Name
#  [deg]    [deg]    ['] [deg]  [deg]                   [']
135.6687 -40.6234    6.0  46.4   46.1   1.6008   1.9    7.6	Vela X-1
104.6806 -52.9156    2.4  23.1   33.3   1.1585   4.8 ------	UNKNOWN
 99.8563 -41.7114    2.3  29.6   11.1   1.2329   5.1 ------	UNKNOWN
320.3496 -56.2678    3.0  47.3  176.8   1.8980   3.8 ------	UNKNOWN
 93.7130 -10.5784    3.0  56.2  -14.9   3.0955   3.8 ------	UNKNOWN
  5.0720 -32.0317    3.3  48.0 -129.3   3.8927   3.5 ------	UNKNOWN
 54.2818 -19.5420    2.8  43.8  -64.2   4.5285   4.0 ------	UNKNOWN
Pre-slew background subtracted image of 15-350 keV band
Time interval of the image:
-1.424000 6.736000

# RAcent  DECcent POSerr Theta    Phi  PeakCts   SNR AngSep     Name
#  [deg]    [deg]    ['] [deg]  [deg]                   [']
135.3633 -40.4235   13.2  46.4   45.7  -0.1302  -0.9   10.9	Vela X-1
319.4846 -60.4081    0.5  44.4  172.7   1.8509  25.5 ------	UNKNOWN
Post-slew image of 15-350 keV band
Time interval of the image:
709.680610 876.780600

# RAcent  DECcent POSerr Theta    Phi  PeakCts   SNR AngSep     Name
#  [deg]    [deg]    ['] [deg]  [deg]                   [']
 83.6379  22.0151    0.3   6.7 -114.7   6.9352  44.2    0.3	Crab
 78.3784  77.4458    2.6  53.5  -10.1   2.1659   4.5 ------	UNKNOWN
 50.3976  79.1184    2.3  57.7  -15.1   3.7129   5.0 ------	UNKNOWN
 30.2752  70.9636    3.4  57.6  -26.4   3.3169   3.4 ------	UNKNOWN