Analysis Summary
Notes:
- 1) No attempt has been made to eliminate the non-significant decimal places.
- 2) This batgrbproduct analysis is done using the HEASARC data.
- 3) This batgrbproduct analysis is using the flight position for the mask-weighting calculation.
======================================================================
                  BAT GRB EVENT DATA PROCESSING REPORT
    Process Script Ver: batgrbproduct v2.46
    Process Start Time: Wed Jun  1 15:33:33 EDT 2016
             Host Name: bat1
   Current Working Dir: /local/data/bat1/alien/Swift_3rdBATcatalog/event/batevent_reproc/trigger684098
======================================================================

  Trigger: 00684098      Segment: 000

  BAT Trigger Time: 483319587.52   [s; MET]
      Trigger Stop: 483319587.776   [s; MET]
               UTC: 2016-04-25T23:26:11.341240    [includes UTCF correction]
       Where From?: TDRSS position message

  BAT
    RA: 280.313549845198   Dec: -54.3595799473253  [deg; J2000]

     Catalogged Source?: NO
     Point Source?:      YES
     GRB Indicated?:     YES    [ by BAT flight software ]
     Image S/N Ratio:    11.8
     Image Trigger?:     NO
     Rate S/N Ratio:     32.9545141065682  [ if not an image trigger ]
     Image S/N Ratio:    11.8

  Analysis Position:   [ source = BAT ]
    RA: 280.313549845198   Dec: -54.3595799473253  [deg; J2000]

  Refined Position:   [ source = BAT pre-slew burst ]
    RA: 280.339542485094   Dec: -54.3430780907743  [deg; J2000]
        { 18h 41m 21.5s , -54d 20' 35.1" }
         +/- 3.4657821618324 [arcmin] (estimated 90% radius based on SNR)
         +/- 2.20061728779268 [arcmin] (formal 1-sigma fit error)
    SNR: 5.15197467851014

  Angular difference between the analysis and refined position is 1.344053 arcmin

  Partial Coding Fraction: 0.71875    [ including projection effects ]

  Duration
     T90: 304.595999896526 +/- 15.0280336609888
        Measured from: 0.200000047683716
                   to: 304.79599994421     [s; relative to TRIGTIME]
     T50: 117.583999931812 +/- 104.658093173912
        Measured from: 164.168000042439
                   to: 281.751999974251     [s; relative to TRIGTIME]


  Fluence
     Peak Flux  (peak 1 second)
        Measured from: -0.271999955177307
                   to: 0.728000044822693     [s; relative to TRIGTIME]
     Total Fluence
        Measured from: -0.532000005245209
                   to: 319.800000011921     [s; relative to TRIGTIME]

             Band 1     Band 2     Band 3     Band 4
              15-25      25-50     50-100    100-350     keV
 Total     1.739598   1.574377   0.748659   0.172580
           0.115527   0.113035   0.096214   0.085781 [error]
 Peak      0.098932   0.123245   0.099734   0.018190
           0.008858   0.009167   0.008112   0.005850 [error]

     [ fluence units of on-axis counts / fully illuminated detector ]

======================================================================


====== Table of the duration information =============================

        Value   tstart    tstop
T100  320.332   -0.532  319.800
T90   304.596    0.200  304.796
T50   117.584  164.168  281.752
Peak    1.000   -0.272    0.728


====== Spectral Analysis Summary =====================================

Model      : spectral model: simple power-law (PL) and cutoff power-law (CPL)
Ph_index   : photon index: E^{Ph_index}
Ph_90err   : 90% error of the photon index
Epeak      : Epeak in keV
Epeak_90err: 90% error of Epeak
Norm       : normalization at 50 keV in both the PL model and CPL model
Nomr_90err : 90% error of the normalization
chi2       : Chi-Squared
dof        : degree of freedo

=== Time-averaged spectral analysis ===
(Best model with acceptable fit: PL)

Model Ph_index Ph_90err_low Ph_90err_hi  Epeak  Epeak_90err_low  Epeak_90err_hi  Norm       Nomr_90err_low    Norm_90err_hi    chi2    dof
PL      -2.177    -0.181      0.172       -           -               -         6.70e-04     -7.79e-05          7.62e-05      53.250   57
CPL     -1.975     1.975      0.558        5.251      N/A           N/A         8.70e-04        N/A               N/A         53.380   56


=== 1-s peak spectral analysis ===
(Best model with acceptable fit: PL)

Model Ph_index Ph_90err_low Ph_90err_hi  Epeak  Epeak_90err_low  Epeak_90err_hi  Norm       Nomr_90err_low    Norm_90err_hi    chi2    dof
PL      -1.544     -0.136     0.134       -           -               -         2.24e-02     -1.84e-03          1.83e-03      58.800   57
CPL     -1.258     -0.356     0.523      129.068      N/A           N/A         3.14e-02        N/A               N/A         57.740   56


=== Fluence/Peak Flux Summary ===

              Model    Band1     Band2     Band3     Band4     Band5     Total
                       15-25     25-50    50-100    100-350    15-150    15-350    keV
Fluence         PL   5.20e-07  6.34e-07  5.61e-07  8.55e-07  2.01e-06  2.57e-06   erg/cm2
      90%_error_low -6.13e-08 -5.34e-08 -8.97e-08 -2.44e-07 -1.99e-07 -3.52e-07   erg/cm2
      90%_error_hi   6.28e-08  5.33e-08  9.22e-08  3.04e-07  2.04e-07  3.97e-07   erg/cm2
Peak flux       PL   9.62e-01  9.44e-01  6.47e-01  6.98e-01  2.83e+00  3.25e+00   ph/cm2/s
      90%_error_low -1.25e-01 -7.83e-02 -6.69e-02 -1.35e-01 -2.26e-01 -2.59e-01   ph/cm2/s
      90%_error_hi   1.29e-01  7.79e-02  6.64e-02  1.54e-01  2.26e-01  2.60e-01   ph/cm2/s

Fluence        CPL   5.18e-07  6.38e-07  5.61e-07  8.59e-07  2.01e-06  2.56e-06   erg/cm2
      90%_error_low -6.23e-08 -1.48e-07 -8.99e-08 -1.68e-07 -1.97e-07 -1.99e-07   erg/cm2
      90%_error_hi   7.07e-08  5.15e-08  9.31e-08  4.47e-07  2.22e-07  5.57e-07   erg/cm2
Peak flux      CPL   9.18e-01  9.72e-01  6.64e-01  4.99e-01  2.80e+00  3.05e+00   ph/cm2/s
      90%_error_low -1.45e-01 -9.09e-02 -7.28e-02 -2.12e-01 -2.30e-01 -3.23e-01   ph/cm2/s
      90%_error_hi   1.48e-01  9.33e-02  7.44e-02  2.51e-01  2.31e-01  3.70e-01   ph/cm2/s

======================================================================
Image
Pre-slew 15.0-350.0 keV image (Event data)
#   RAcent    DECcent   POSerr    Theta     Phi              Peak Cts       SNR   Name
  280.3395   -54.3431   0.0373    24.6767  -127.0068         0.9256070      5.152 TRIG_00684098

Foreground time interval of the image:
 -0.532 140.781 (delta_t = 141.313 [sec])
Background time interval of the image:
-239.520  -0.532 (delta_t = 238.988 [sec])
Light Curves
Note: The mask-weighted lightcurves have units of either count/det or counts/sec/det, where a det is 0.4 x 0.4 = 0.16 sq cm.
Full-time range; 1 s binning
Other quick-look light curves:
- 64 ms binning (zoomed)
- 16 ms binning (zoomed)
- 8 ms binning (zoomed)
- 2 ms binning (zoomed)
- SN=5 or 10 s binning (full-time range)
- Raw light curve
Spectra
- 64 ms binning (zoomed)
- 16 ms binning (zoomed)
- 8 ms binning (zoomed)
- 2 ms binning (zoomed)
- SN=5 or 10 s binning (full-time range)
- Raw light curve
Spectra
Notes:
- 1) The fitting includes the systematic errors.
- 2) When the burst includes telescope slew time periods, the fitting uses an average response file made from multiple 5-s response files through out the slew time plus single time preiod for the non-slew times, and weighted by the total counts in the corresponding time period using addrmf. An average response file is needed becuase a spectral fit using the pre-slew DRM will introduce some errors in both a spectral shape and a normalization if the PHA file contains a lot of the slew/post-slew time interval.
- 3) For fits to more complicated models (e.g. a power-law over a cutoff power-law), the BAT team has decided to require a chi-square improvement of more than 6 for each extra dof.
Time averaged spectrum fit using the average DRM
Power-law model
Time interval is from   -0.532 sec. to  319.800 sec.

Spectral model in power-law:
------------------------------------------------------------
Parameters  : value       lower 90%   higher 90%
Photon index: -2.17677     ( -0.180775   0.171632 )
Norm@50keV  : 6.70337E-04    ( -7.79085e-05   7.62261e-05 )
------------------------------------------------------------
#Fit statistic : Chi-Squared =          53.25 using 59 PHA bins.
# Reduced chi-squared =         0.9342 for     57 degrees of freedom
# Null hypothesis probability =   6.165036e-01

Photon flux (15-150 keV)    in 320.3 sec: 0.109649 ( -0.009081  0.009089 ) ph/cm2/s
Energy fluence (15-150 keV)             : 2.01278e-06 ( -1.9937e-07  2.03763e-07 ) ergs/cm2
Cutoff power-law model
Time interval is from   -0.532 sec. to  319.800 sec.
Spectral model in the cutoff power-law:
------------------------------------------------------------
Parameters  : value       lower 90%   higher 90%
Photon index: -2.21123     ( 1.99383   0.576839 )
Epeak [keV] : 258.943      (   )
Norm@50keV  : 6.40787E-04    (     )
------------------------------------------------------------
#Fit statistic : Chi-Squared =          53.29 using 59 PHA bins.
# Reduced chi-squared =         0.9516 for     56 degrees of freedom
# Null hypothesis probability =   5.782096e-01

Photon flux (15-150 keV)    in 320.3 sec: 0.109364 ( -0.009064  0.009866 ) ph/cm2/s
Energy fluence (15-150 keV)             : 2.00871e-06 ( -1.97004e-07  2.22125e-07 ) ergs/cm2
1-s peak spectrum fit
Power-law model
Time interval is from   -0.272 sec. to    0.728 sec.

Spectral model in power-law:
------------------------------------------------------------
Parameters  : value       lower 90%   higher 90%
Photon index: -1.54388     ( -0.135831   0.134137 )
Norm@50keV  : 2.24149E-02    ( -0.00183708   0.0018264 )
------------------------------------------------------------
#Fit statistic : Chi-Squared =          58.80 using 59 PHA bins.
# Reduced chi-squared =          1.032 for     57 degrees of freedom
# Null hypothesis probability =   4.092957e-01

Photon flux (15-150 keV)    in 1 sec: 2.83267 ( -0.2263  0.22649 ) ph/cm2/s
Energy fluence (15-150 keV)             : 2.11232e-07 ( -1.87412e-08  1.88963e-08 ) ergs/cm2
Cutoff power-law model
Time interval is from   -0.272 sec. to    0.728 sec.
Spectral model in the cutoff power-law:
------------------------------------------------------------
Parameters  : value       lower 90%   higher 90%
Photon index: -1.2582     ( -0.356223   0.523176 )
Epeak [keV] : 129.068      (   )
Norm@50keV  : 3.14208E-02    (     )
------------------------------------------------------------
#Fit statistic : Chi-Squared =          57.74 using 59 PHA bins.
# Reduced chi-squared =          1.031 for     56 degrees of freedom
# Null hypothesis probability =   4.106203e-01

Photon flux (15-150 keV)    in 1 sec: 2.80362 ( -0.23  0.23138 ) ph/cm2/s
Energy fluence (15-150 keV)             : 2.07195e-07 ( -2.01225e-08  2.00582e-08 ) ergs/cm2
Time-resolved spectra

Distribution
T90 vs. Hardness ratio plot
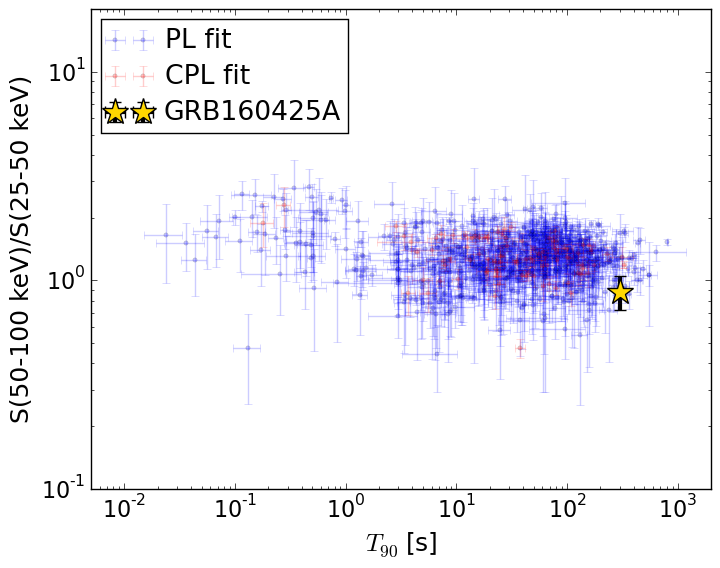
T90                                   = 304.596 sec.
Hardness ratio (energy fluence ratio) = 0.88472865858
S(15-50 keV) vs. S(50-150 keV) plot
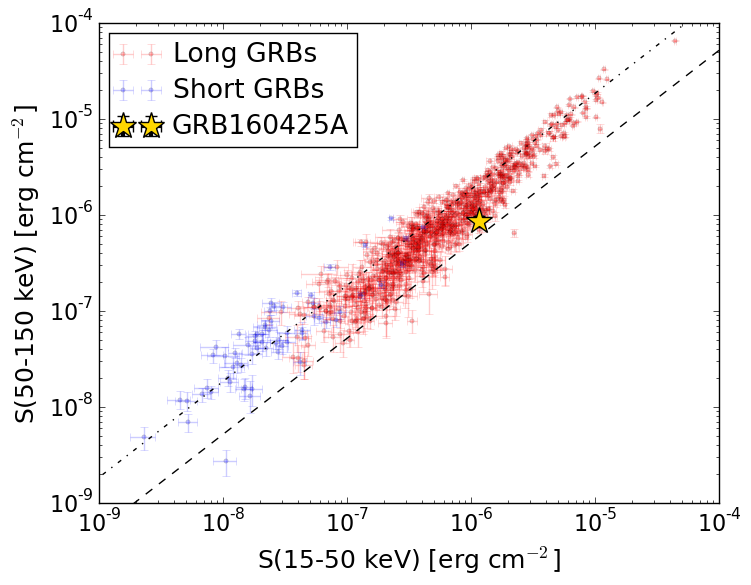
S(15-50 keV)  = 1.1539659e-06
S(50-150 keV) = 8.588082e-07
The dash-dotted line and the dashed line traces the fluences calculated from the Band function with Epeak = 15 and 150 keV, respectively. Both lines assume a canonical values of alpha = -1 and beta = -2.5.
Mask shadow pattern
IMX = -2.765502225343917E-01, IMY = 3.669045055672575E-01
Spacecraft aspect plot
Bright source in the pre-burst/pre-slew/post-slew images
Pre-burst image of 15-350 keV band
Time interval of the image:
-239.520000 -0.532000

# RAcent  DECcent POSerr Theta    Phi  PeakCts   SNR AngSep     Name
#  [deg]    [deg]    ['] [deg]  [deg]                   [']
170.2268 -60.6217    3.7  35.0   -2.8   1.0638   3.1    2.6	Cen X-3
186.6876 -62.7620    2.7  26.9   -3.4   1.1736   4.2    1.0	GX 301-2
245.0110 -15.6431    0.6  39.1  136.9  11.9425  18.8    1.8	Sco X-1
256.0123 -37.8485    1.6  20.8  170.5   1.7431   7.2    1.2	4U 1700-377
256.4063 -36.3391    3.2  22.3  169.2   0.9285   3.6    5.2	GX 349+2
262.9635 -24.7398    6.0  35.2  168.2   0.6507   1.9    2.5	GX 1+4
264.8177 -44.5039    4.2  20.2 -162.5   0.6815   2.7    4.6	4U 1735-44
270.3021 -25.1283    3.6  38.0  178.3   1.1496   3.2    3.1	GX 5-1
270.4101 -25.7797    3.3  37.5  179.0   1.1785   3.5    6.2	GRS 1758-258
274.1345 -14.0292    4.8  49.5  175.1   1.6192   2.4    7.5	GX 17+2
275.7275 -30.4418    0.0  36.3 -170.1   0.2783   0.9   11.2	H1820-303
284.9048 -25.0259    8.9  45.6 -165.3  -0.6543  -1.3    9.5	HT1900.1-2455
263.0084 -34.0321  153.0  27.1  177.2  -0.0202  -0.1   11.9	GX 354-0
218.5750 -17.6154    2.9  39.5   96.3   3.7469   3.9 ------	UNKNOWN
145.7294 -45.3628    2.8  55.5    3.7   4.2354   4.1 ------	UNKNOWN
141.2178 -48.6605    2.7  55.3   -1.8   3.4889   4.3 ------	UNKNOWN
132.6466 -60.2148    3.2  50.8  -16.5   1.7877   3.6 ------	UNKNOWN
313.0835 -50.5329    4.5  44.1 -117.1   2.9640   2.6 ------	UNKNOWN
Pre-slew background subtracted image of 15-350 keV band
Time interval of the image:
-0.532000 140.780600

# RAcent  DECcent POSerr Theta    Phi  PeakCts   SNR AngSep     Name
#  [deg]    [deg]    ['] [deg]  [deg]                   [']
170.1663 -60.6305    3.1  35.0   -2.8  -0.7530  -3.8    4.4	Cen X-3
186.8140 -62.7401    7.5  26.9   -3.4  -0.2907  -1.5    4.7	GX 301-2
245.0964 -15.5601    2.5  39.2  137.1  -1.8886  -4.7    8.3	Sco X-1
255.9554 -37.9211    4.5  20.7  170.5  -0.4384  -2.6    4.8	4U 1700-377
256.4437 -36.6247    0.0  22.0  169.6   0.2995   1.8   12.1	GX 349+2
263.0662 -24.6599    3.0  35.3  168.3  -0.8927  -3.9    6.0	GX 1+4
264.9390 -44.4925    7.0  20.3 -162.4  -0.2643  -1.6    8.8	4U 1735-44
270.4151 -25.0255    7.3  38.1  178.4   0.3994   1.6    7.8	GX 5-1
270.3913 -25.7566    5.1  37.5  179.0  -0.5499  -2.2    4.9	GRS 1758-258
273.9649 -14.0296    5.5  49.4  174.9  -0.8732  -2.1    2.4	GX 17+2
276.0804 -30.2716   56.5  36.6 -169.9   0.0430   0.2    9.9	H1820-303
285.0927 -24.7930    7.9  45.8 -165.3   0.4447   1.5    8.3	HT1900.1-2455
262.9410 -33.7693    8.3  27.3  176.8   0.2417   1.4    4.6	GX 354-0
285.9583 -52.5712    2.4  28.4 -128.1   0.8736   4.8 ------	UNKNOWN
112.4513 -58.1000    2.3  59.1  -24.5   5.0101   5.1 ------	UNKNOWN
Post-slew image of 15-350 keV band
Time interval of the image:
187.580590 962.511800

# RAcent  DECcent POSerr Theta    Phi  PeakCts   SNR AngSep     Name
#  [deg]    [deg]    ['] [deg]  [deg]                   [']
170.1714 -60.7145  461.8  52.3   24.3   0.0563   0.0    6.9	Cen X-3
186.3954 -62.8586    6.4  45.2   28.8   2.1514   1.8    8.9	GX 301-2
255.9752 -37.8480    2.0  23.4  113.8   4.5291   5.8    0.6	4U 1700-377
256.3159 -36.4003    3.7  24.4  116.5   2.5326   3.1    5.9	GX 349+2
262.8863 -24.7563    8.2  32.3  138.3  -1.3842  -1.4    6.7	GX 1+4
264.7924 -44.6227   12.3  13.9  116.8   0.5481   0.9   10.6	4U 1735-44
270.2304 -25.0581    2.6  30.2  150.6   3.5642   4.4    3.2	GX 5-1
270.3322 -25.7967    2.1  29.5  150.4   4.1572   5.4    3.6	GRS 1758-258
274.1395 -14.0290    5.0  40.6  159.7   2.7109   2.3    7.8	GX 17+2
276.0218 -30.3607    3.2  24.2  159.9   2.3015   3.6    5.0	H1820-303
285.1870 -24.8849   98.2  29.7  177.9   0.0824   0.1    8.5	HT1900.1-2455
262.9955 -33.9680   36.2  23.7  131.1   0.2336   0.3    8.0	GX 354-0
222.3120 -65.6766    2.2  29.8   33.5   3.8025   5.3 ------	UNKNOWN
277.5196 -31.5385    3.3  22.9  162.8   1.9957   3.5 ------	UNKNOWN
283.0435 -13.7761    2.8  40.6  173.0   3.6952   4.2 ------	UNKNOWN
203.1845 -86.1804    3.1  35.0   -4.6   2.9133   3.7 ------	UNKNOWN
 78.7568 -68.1977    4.7  56.4  -20.6   7.6380   2.5 ------	UNKNOWN
308.8756  -1.3654    6.0  57.9 -156.8   8.5675   1.9 ------	UNKNOWN
325.4204 -21.4316    3.2  47.2 -127.1  13.3433   3.6 ------	UNKNOWN