Analysis Summary
Notes:
- 1) No attempt has been made to eliminate the non-significant decimal places.
- 2) This batgrbproduct analysis is done using the HEASARC data.
- 3) This batgrbproduct analysis is using the flight position for the mask-weighting calculation.
======================================================================
                  BAT GRB EVENT DATA PROCESSING REPORT
    Process Script Ver: batgrbproduct v2.46
    Process Start Time: Wed Jun  1 15:28:04 EDT 2016
             Host Name: bat1
   Current Working Dir: /local/data/bat1/alien/Swift_3rdBATcatalog/event/batevent_reproc/trigger684679
======================================================================

  Trigger: 00684679      Segment: 000

  BAT Trigger Time: 483756048   [s; MET]
      Trigger Stop: 483756112   [s; MET]
               UTC: 2016-05-01T00:40:31.797220    [includes UTCF correction]
       Where From?: TDRSS position message

  BAT
    RA: 286.376860952753   Dec: -17.2398515642378  [deg; J2000]

     Catalogged Source?: NO
     Point Source?:      YES
     GRB Indicated?:     YES    [ by BAT flight software ]
     Image S/N Ratio:    11.34
     Image Trigger?:     YES
     Rate S/N Ratio:     0  [ if not an image trigger ]
     Image S/N Ratio:    11.34

  Analysis Position:   [ source = BAT ]
    RA: 286.376860952753   Dec: -17.2398515642378  [deg; J2000]

  Refined Position:   [ source = BAT pre-slew burst ]
    RA: 286.37981860683   Dec: -17.2400939882568  [deg; J2000]
        { 19h 05m 31.2s , -17d 14' 24.3" }
         +/- 2.05957974755527 [arcmin] (estimated 90% radius based on SNR)
         +/- 0.884931399361301 [arcmin] (formal 1-sigma fit error)
    SNR: 10.8358558531747

  Angular difference between the analysis and refined position is 0.170109 arcmin

  Partial Coding Fraction: 0.8125    [ including projection effects ]

  Duration
     T90: N/A +/- N/A
        Measured from: N/A
                   to: N/A     [s; relative to TRIGTIME]
     T50: N/A +/-  N/A
        Measured from: N/A
                   to: N/A     [s; relative to TRIGTIME]

    WARNING: battblocks failed.  Used TDRSS fore/background intervals

======================================================================


====== Table of the duration information =============================

        Value   tstart    tstop
T100     N/A      N/A      N/A
T90      N/A      N/A      N/A
T50      N/A      N/A      N/A
Peak     N/A      N/A      N/A


====== Spectral Analysis Summary =====================================

Model      : spectral model: simple power-law (PL) and cutoff power-law (CPL)
Ph_index   : photon index: E^{Ph_index}
Ph_90err   : 90% error of the photon index
Epeak      : Epeak in keV
Epeak_90err: 90% error of Epeak
Norm       : normalization at 50 keV in both the PL model and CPL model
Nomr_90err : 90% error of the normalization
chi2       : Chi-Squared
dof        : degree of freedo

=== Time-averaged spectral analysis ===
(Best model with acceptable fit: PL)

Model Ph_index Ph_90err_low Ph_90err_hi  Epeak  Epeak_90err_low  Epeak_90err_hi  Norm       Nomr_90err_low    Norm_90err_hi    chi2    dof
PL      -2.278    -0.252      0.233       -           -               -         1.00e-03     -1.78e-04          1.75e-04      44.250   57
CPL     -0.638    -1.213      1.588       31.317      N/A           N/A         1.01e-02        N/A               N/A         38.570   56


=== 1-s peak spectral analysis ===
(Best model with acceptable fit: N/A)

Model Ph_index Ph_90err_low Ph_90err_hi  Epeak  Epeak_90err_low  Epeak_90err_hi  Norm       Nomr_90err_low    Norm_90err_hi    chi2    dof
PL      N/A         N/A       N/A          -           -               -           N/A           N/A               N/A         N/A        N/A
CPL     N/A         N/A       N/A          N/A         N/A           N/A           N/A           N/A               N/A         N/A        N/A


=== Fluence/Peak Flux Summary ===

              Model    Band1     Band2     Band3     Band4     Band5     Total
                       15-25     25-50    50-100    100-350    15-150    15-350    keV
Fluence         PL   1.71e-07  1.97e-07  1.62e-07  2.24e-07  6.12e-07  7.55e-07   erg/cm2
      90%_error_low -2.75e-08 -2.56e-08 -3.78e-08 -8.66e-08 -8.96e-08 -1.42e-07   erg/cm2
      90%_error_hi   2.81e-08  2.54e-08  3.97e-08  1.18e-07  9.21e-08  1.64e-07   erg/cm2
Peak flux       PL     N/A      N/A      N/A      N/A      N/A      N/A     ph/cm2/s
Image
Pre-slew 15.0-350.0 keV image (Event data)
#   RAcent    DECcent   POSerr    Theta     Phi              Peak Cts       SNR   Name
  286.3798   -17.2401   0.0178    19.5454  -118.4072         1.2420216     10.836 TRIG_00684679

Foreground time interval of the image:
  0.000  64.000 (delta_t =  64.000 [sec])
Background time interval of the image:
Light Curves
Note: The mask-weighted lightcurves have units of either count/det or counts/sec/det, where a det is 0.4 x 0.4 = 0.16 sq cm.
Full-time range; 1 s binning
Other quick-look light curves:
- 64 ms binning (zoomed)
- 16 ms binning (zoomed)
- 8 ms binning (zoomed)
- 2 ms binning (zoomed)
- SN=5 or 10 s binning (full-time range)
- Raw light curve
Spectra
- 64 ms binning (zoomed)
- 16 ms binning (zoomed)
- 8 ms binning (zoomed)
- 2 ms binning (zoomed)
- SN=5 or 10 s binning (full-time range)
- Raw light curve
Spectra
Notes:
- 1) The fitting includes the systematic errors.
- 2) When the burst includes telescope slew time periods, the fitting uses an average response file made from multiple 5-s response files through out the slew time plus single time preiod for the non-slew times, and weighted by the total counts in the corresponding time period using addrmf. An average response file is needed becuase a spectral fit using the pre-slew DRM will introduce some errors in both a spectral shape and a normalization if the PHA file contains a lot of the slew/post-slew time interval.
- 3) For fits to more complicated models (e.g. a power-law over a cutoff power-law), the BAT team has decided to require a chi-square improvement of more than 6 for each extra dof.
Time averaged spectrum fit using the average DRM
Power-law model
Time interval is from    0.000 sec. to   64.000 sec.

Spectral model in power-law:
------------------------------------------------------------
Parameters  : value       lower 90%   higher 90%
Photon index: -2.27825     ( -0.252467   0.233464 )
Norm@50keV  : 1.00372E-03    ( -0.00017773   0.00017462 )
------------------------------------------------------------
#Fit statistic : Chi-Squared =          44.25 using 59 PHA bins.
# Reduced chi-squared =         0.7763 for     57 degrees of freedom
# Null hypothesis probability =   8.912930e-01

Photon flux (15-150 keV)    in 64 sec: 0.173330 ( -0.021481  0.021487 ) ph/cm2/s
Energy fluence (15-150 keV)             : 6.11603e-07 ( -8.96038e-08  9.21331e-08 ) ergs/cm2
Cutoff power-law model
Time interval is from    0.000 sec. to   64.000 sec.
Spectral model in the cutoff power-law:
------------------------------------------------------------
Parameters  : value       lower 90%   higher 90%
Photon index: -0.638093     ( -1.21977   1.58083 )
Epeak [keV] : 31.3174      (   )
Norm@50keV  : 1.00556E-02    (     )
------------------------------------------------------------
#Fit statistic : Chi-Squared =          38.57 using 59 PHA bins.
# Reduced chi-squared =         0.6888 for     56 degrees of freedom
# Null hypothesis probability =   9.634552e-01

Photon flux (15-150 keV)    in 64 sec: 0.165160 ( -0.021889  0.022021 ) ph/cm2/s
Energy fluence (15-150 keV)             : 5.37613e-07 ( -8.35149e-08  9.6023e-08 ) ergs/cm2
1-s peak spectrum fit
1-s peak spectrum unavailable, because battblocks failed to determine burst durations.
Time-resolved spectra
Time-resolved spectra unavailable, because battblocks failed to determine burst durations.Distribution
T90 vs. Hardness ratio plot

T90                                   = N/A sec.
Hardness ratio (energy fluence ratio) = N/A
S(15-50 keV) vs. S(50-150 keV) plot
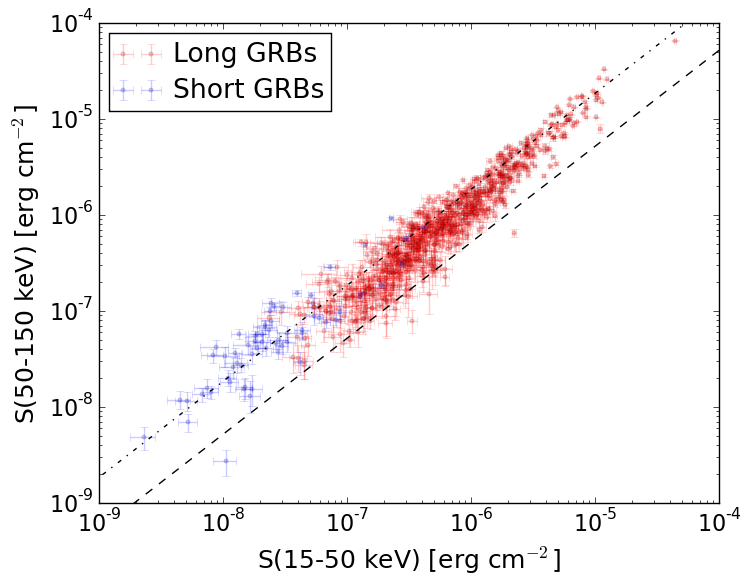
S(15-50 keV)  = N/A
S(50-150 keV) = N/A
The dash-dotted line and the dashed line traces the fluences calculated from the Band function with Epeak = 15 and 150 keV, respectively. Both lines assume a canonical values of alpha = -1 and beta = -2.5.
Mask shadow pattern
IMX = -1.688906794539408E-01, IMY = 3.122635234765540E-01
Spacecraft aspect plot
Bright source in the pre-burst/pre-slew/post-slew images
Pre-burst image of 15-350 keV band
Time interval of the image:
Pre-slew background subtracted image of 15-350 keV band
Time interval of the image:
0.000000 64.000000

# RAcent  DECcent POSerr Theta    Phi  PeakCts   SNR AngSep     Name
#  [deg]    [deg]    ['] [deg]  [deg]                   [']
244.9874 -15.6415    0.5  22.6  100.3   2.9108  21.8    0.5	Sco X-1
255.9718 -37.8727    0.7  16.1   23.7   1.7589  16.0    1.8	4U 1700-377
256.3333 -36.4365    5.1  14.8   26.4   0.2507   2.3    5.0	GX 349+2
262.9110 -24.5755    7.5   3.8   83.2   0.1579   1.5   11.5	GX 1+4
264.7400 -44.4497   15.9  19.7   -4.5   0.0761   0.7    0.1	4U 1735-44
268.2892  -1.5923   10.6  23.2  173.8   0.1176   1.1    9.6	SW J1753.5-0127
270.2365 -24.9218   38.1   2.9  -96.4   0.0315   0.3    9.8	GX 5-1
270.1723 -25.8019    5.5   3.0  -79.3   0.2158   2.1    7.9	GRS 1758-258
274.0578 -14.0833    2.7  12.6 -156.5   0.4637   4.3    4.1	GX 17+2
276.1142 -30.2322    0.0   9.7  -63.4   0.1405   1.3   12.7	H1820-303
285.1688 -24.7990   23.2  16.4  -95.6  -0.0574  -0.5   10.3	HT1900.1-2455
288.7228  10.9041    4.1  41.5 -156.2   0.4594   2.8    5.1	GRS 1915+105
263.1623 -33.8700    6.5   9.7   10.1  -0.1911  -1.8    8.9	GX 354-0
236.5413  -9.2356    2.7  32.9  103.5   0.9075   4.4 ------	UNKNOWN
259.7272  29.3054    2.2  54.6  162.8   3.2771   5.1 ------	UNKNOWN
286.3798 -17.2401    1.1  19.5 -118.4   1.2419  10.8 ------	UNKNOWN
310.6479 -62.1753    2.1  47.3  -35.4   1.3473   5.5 ------	UNKNOWN
316.1488 -41.7583    2.7  43.7  -64.1   2.2481   4.2 ------	UNKNOWN
312.4230 -25.9241    3.4  40.8  -87.8   1.5842   3.4 ------	UNKNOWN
Post-slew image of 15-350 keV band
Time interval of the image:
117.300600 963.070000

# RAcent  DECcent POSerr Theta    Phi  PeakCts   SNR AngSep     Name
#  [deg]    [deg]    ['] [deg]  [deg]                   [']
245.0104 -15.6378    1.2  39.6   95.3  29.0860   9.6    1.8	Sco X-1
255.9932 -37.8510    0.7  33.6   55.3  21.6945  16.8    0.5	4U 1700-377
256.5742 -36.5708    6.0  32.6   56.9   2.4532   1.9   11.1	GX 349+2
262.9992 -24.6068    5.6  23.0   76.6   1.8206   2.1    8.3	GX 1+4
264.6337 -44.4538    4.8  32.8   38.4   2.5926   2.4    4.7	4U 1735-44
268.2278  -1.5005   11.7  23.8  138.7   0.7852   1.0    8.9	SW J1753.5-0127
270.1157 -25.0362   16.1  17.0   69.2   0.5048   0.7    9.5	GX 5-1
270.2003 -25.7492    3.9  17.2   66.9   2.1441   3.0    5.5	GRS 1758-258
274.0115 -14.0440    1.0  12.3  112.5   8.3600  11.7    0.6	GX 17+2
276.0247 -30.4737    5.7  16.2   42.8   1.4146   2.0    8.2	H1820-303
285.2237 -25.0464    0.0   7.9   16.8   0.9604   1.3   12.7	HT1900.1-2455
288.8201  10.9552    1.2  28.3 -165.7   6.7072   9.6    1.4	GRS 1915+105
299.5686  35.2125    1.0  53.9 -157.5  26.8991  12.0    1.2	Cyg X-1
262.8188 -33.9636    0.0  26.9   56.3   1.6368   1.9   11.5	GX 354-0
276.4323   3.4160    3.4  22.9  162.9   2.3703   3.4 ------	UNKNOWN
301.7173  38.8723    5.2  57.9 -156.8  11.5174   2.2 ------	UNKNOWN