Analysis Summary
Notes:
- 1) No attempt has been made to eliminate the non-significant decimal places.
- 2) This batgrbproduct analysis is done using the HEASARC data.
- 3) This batgrbproduct analysis is using the flight position for the mask-weighting calculation.
======================================================================
BAT GRB EVENT DATA PROCESSING REPORT
Process Script Ver: batgrbproduct v2.46
Process Start Time: Fri Jun 3 14:52:41 EDT 2016
Host Name: bat1
Current Working Dir: /local/data/bat1/alien/Swift_3rdBATcatalog/event/scripts
======================================================================
Trigger: 00685124 Segment: 000
BAT Trigger Time: 484083053.568 [s; MET]
Trigger Stop: 484083057.664 [s; MET]
UTC: 2016-05-04T19:30:37.347200 [includes UTCF correction]
Where From?: TDRSS position message
BAT
RA: 170.043522431995 Dec: 55.9967792055369 [deg; J2000]
Catalogged Source?: NO
Point Source?: YES
GRB Indicated?: YES [ by BAT flight software ]
Image S/N Ratio: 6.82
Image Trigger?: NO
Rate S/N Ratio: 13.7840487520902 [ if not an image trigger ]
Image S/N Ratio: 6.82
Analysis Position: [ source = BAT ]
RA: 170.043522431995 Dec: 55.9967792055369 [deg; J2000]
Refined Position: [ source = BAT pre-slew burst ]
RA: 170.075790615603 Dec: 55.9963143650939 [deg; J2000]
{ 11h 20m 18.2s , +55d 59' 46.7" }
+/- 1.67711271801216 [arcmin] (estimated 90% radius based on SNR)
+/- 0.612262546738424 [arcmin] (formal 1-sigma fit error)
SNR: 14.5316578027981
Angular difference between the analysis and refined position is 1.083104 arcmin
Partial Coding Fraction: 0.8828125 [ including projection effects ]
Duration
T90: 53.9599999189377 +/- 5.68137024620488
Measured from: -40.0960000157356
to: 13.8639999032021 [s; relative to TRIGTIME]
T50: 28.0759999155998 +/- 5.86273114821827
Measured from: -24.4959999918938
to: 3.57999992370605 [s; relative to TRIGTIME]
Fluence
Peak Flux (peak 1 second)
Measured from: 0.507999956607819
to: 1.50799995660782 [s; relative to TRIGTIME]
Total Fluence
Measured from: -42.3920000195503
to: 16.1959999799728 [s; relative to TRIGTIME]
Band 1 Band 2 Band 3 Band 4
15-25 25-50 50-100 100-350 keV
Total 0.537958 0.499748 0.335631 0.034336
0.044383 0.046035 0.040050 0.034978 [error]
Peak 0.025246 0.030330 0.025674 0.011933
0.006042 0.006409 0.005614 0.004796 [error]
[ fluence units of on-axis counts / fully illuminated detector ]
======================================================================
====== Table of the duration information =============================
Value tstart tstop
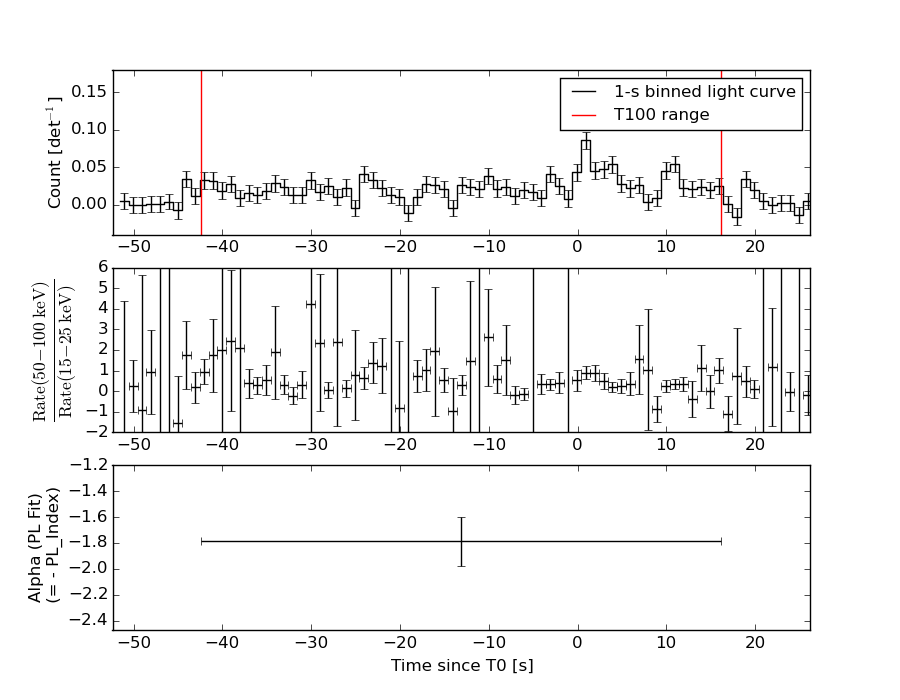
T100 58.588 -42.392 16.196
T90 53.960 -40.096 13.864
T50 28.076 -24.496 3.580
Peak 1.000 0.508 1.508
====== Spectral Analysis Summary =====================================
Model : spectral model: simple power-law (PL) and cutoff power-law (CPL)
Ph_index : photon index: E^{Ph_index}
Ph_90err : 90% error of the photon index
Epeak : Epeak in keV
Epeak_90err: 90% error of Epeak
Norm : normalization at 50 keV in both the PL model and CPL model
Nomr_90err : 90% error of the normalization
chi2 : Chi-Squared
dof : degree of freedo
=== Time-averaged spectral analysis ===
(Best model with acceptable fit: PL)
Model Ph_index Ph_90err_low Ph_90err_hi Epeak Epeak_90err_low Epeak_90err_hi Norm Nomr_90err_low Norm_90err_hi chi2 dof
PL -1.786 -0.191 0.185 - - - 1.44e-03 -1.65e-04 1.61e-04 38.220 57
CPL -1.795 -0.817 0.342 9999.360 N/A N/A 1.43e-03 N/A N/A 38.240 56
=== 1-s peak spectral analysis ===
(Best model with acceptable fit: PL)
Model Ph_index Ph_90err_low Ph_90err_hi Epeak Epeak_90err_low Epeak_90err_hi Norm Nomr_90err_low Norm_90err_hi chi2 dof
PL -1.290 -0.387 0.397 - - - 5.80e-03 -1.19e-03 1.18e-03 44.230 57
CPL -1.300 -2.534 0.735 9999.360 N/A N/A 5.79e-03 N/A N/A 44.240 56
=== Fluence/Peak Flux Summary ===
Model Band1 Band2 Band3 Band4 Band5 Total
15-25 25-50 50-100 100-350 15-150 15-350 keV
Fluence PL 1.41e-07 2.17e-07 2.52e-07 5.62e-07 7.76e-07 1.17e-06 erg/cm2
90%_error_low -2.07e-08 -2.06e-08 -3.99e-08 -1.65e-07 -9.01e-08 -2.06e-07 erg/cm2
90%_error_hi 2.13e-08 2.06e-08 4.03e-08 2.07e-07 9.20e-08 2.40e-07 erg/cm2
Peak flux PL 1.95e-01 2.23e-01 1.82e-01 2.49e-01 6.91e-01 8.49e-01 ph/cm2/s
90%_error_low -7.23e-02 -5.25e-02 -4.72e-02 -1.15e-01 -1.42e-01 -1.81e-01 ph/cm2/s
90%_error_hi 8.01e-02 5.04e-02 4.58e-02 1.69e-01 1.43e-01 1.89e-01 ph/cm2/s
Fluence CPL 1.43e-07 2.17e-07 2.52e-07 5.68e-07 5.82e-07 1.17e-06 erg/cm2
90%_error_low -2.28e-08 -1.99e-08 -5.08e-08 N/A N/A -3.06e-07 erg/cm2
90%_error_hi 1.92e-08 2.19e-08 5.25e-08 N/A N/A 2.03e-07 erg/cm2
Peak flux CPL 1.95e-01 2.23e-01 1.82e-01 2.47e-01 6.91e-01 8.89e-01 ph/cm2/s
90%_error_low N/A N/A N/A N/A -1.42e-01 -2.78e-01 ph/cm2/s
90%_error_hi N/A N/A N/A N/A 1.43e-01 1.97e-01 ph/cm2/s
======================================================================
Image
Pre-slew 15.0-350.0 keV image (Event data)
#   RAcent    DECcent   POSerr    Theta     Phi              Peak Cts       SNR   Name
  170.0758    55.9963   0.0133    17.1560    43.0047         1.3464225     14.532 TRIG_00685124

Foreground time interval of the image:
-42.392  16.196 (delta_t =  58.588 [sec])
Background time interval of the image:
-239.568 -42.392 (delta_t = 197.176 [sec])
Light Curves
Note: The mask-weighted lightcurves have units of either count/det or counts/sec/det, where a det is 0.4 x 0.4 = 0.16 sq cm.
Full-time range; 1 s binning
Other quick-look light curves:
- 64 ms binning (zoomed)
- 16 ms binning (zoomed)
- 8 ms binning (zoomed)
- 2 ms binning (zoomed)
- SN=5 or 10 s binning (full-time range)
- Raw light curve
Spectra
- 64 ms binning (zoomed)
- 16 ms binning (zoomed)
- 8 ms binning (zoomed)
- 2 ms binning (zoomed)
- SN=5 or 10 s binning (full-time range)
- Raw light curve
Spectra
Notes:
- 1) The fitting includes the systematic errors.
- 2) When the burst includes telescope slew time periods, the fitting uses an average response file made from multiple 5-s response files through out the slew time plus single time preiod for the non-slew times, and weighted by the total counts in the corresponding time period using addrmf. An average response file is needed becuase a spectral fit using the pre-slew DRM will introduce some errors in both a spectral shape and a normalization if the PHA file contains a lot of the slew/post-slew time interval.
- 3) For fits to more complicated models (e.g. a power-law over a cutoff power-law), the BAT team has decided to require a chi-square improvement of more than 6 for each extra dof.
Time averaged spectrum fit using the average DRM
Power-law model
Time interval is from  -42.392 sec. to   16.196 sec.

Spectral model in power-law:
------------------------------------------------------------
Parameters  : value       lower 90%   higher 90%
Photon index: -1.78594     ( -0.19139   0.185304 )
Norm@50keV  : 1.43744E-03    ( -0.00016482   0.000160777 )
------------------------------------------------------------
#Fit statistic : Chi-Squared =          38.22 using 59 PHA bins.
# Reduced chi-squared =         0.6706 for     57 degrees of freedom
# Null hypothesis probability =   9.735662e-01

Photon flux (15-150 keV)    in 58.59 sec: 0.197017 ( -0.018808  0.018819 ) ph/cm2/s
Energy fluence (15-150 keV)             : 7.75878e-07 ( -9.01003e-08  9.19898e-08 ) ergs/cm2
Cutoff power-law model
Time interval is from  -42.392 sec. to   16.196 sec.
Spectral model in the cutoff power-law:
------------------------------------------------------------
Parameters  : value       lower 90%   higher 90%
Photon index: -2.43222     ( -0.181426   0.977837 )
Epeak [keV] : 152.371      (   )
Norm@50keV  : 6.94776E-04    (     )
------------------------------------------------------------
#Fit statistic : Chi-Squared =          37.81 using 59 PHA bins.
# Reduced chi-squared =         0.6751 for     56 degrees of freedom
# Null hypothesis probability =   9.703706e-01

Photon flux (15-150 keV)    in 58.59 sec: 0.175179 ( -0.016859  0.016954 ) ph/cm2/s
Energy fluence (15-150 keV)             : 5.82041e-07 ( 0  0 ) ergs/cm2
1-s peak spectrum fit
Power-law model
Time interval is from    0.508 sec. to    1.508 sec.

Spectral model in power-law:
------------------------------------------------------------
Parameters  : value       lower 90%   higher 90%
Photon index: -1.28979     ( -0.3873   0.396747 )
Norm@50keV  : 5.80128E-03    ( -0.00118791   0.00118132 )
------------------------------------------------------------
#Fit statistic : Chi-Squared =          44.23 using 59 PHA bins.
# Reduced chi-squared =         0.7760 for     57 degrees of freedom
# Null hypothesis probability =   8.916362e-01

Photon flux (15-150 keV)    in 1 sec: 0.690829 ( -0.142106  0.142607 ) ph/cm2/s
Energy fluence (15-150 keV)             : 5.74778e-08 ( -1.34172e-08  1.37025e-08 ) ergs/cm2
Cutoff power-law model
Time interval is from    0.508 sec. to    1.508 sec.
Spectral model in the cutoff power-law:
------------------------------------------------------------
Parameters  : value       lower 90%   higher 90%
Photon index: -2.57446     ( -1.26025   2.00919 )
Epeak [keV] : 182.400      (   )
Norm@50keV  : 1.18209E-03    (     )
------------------------------------------------------------
#Fit statistic : Chi-Squared =          43.52 using 59 PHA bins.
# Reduced chi-squared =         0.7772 for     56 degrees of freedom
# Null hypothesis probability =   8.880076e-01

Photon flux (15-150 keV)    in 1 sec: 0.690727 ( -0.142323  0.142516 ) ph/cm2/s
Energy fluence (15-150 keV)             : 5.79109e-08 ( 0  0 ) ergs/cm2
Time-resolved spectra
Distribution
T90 vs. Hardness ratio plot
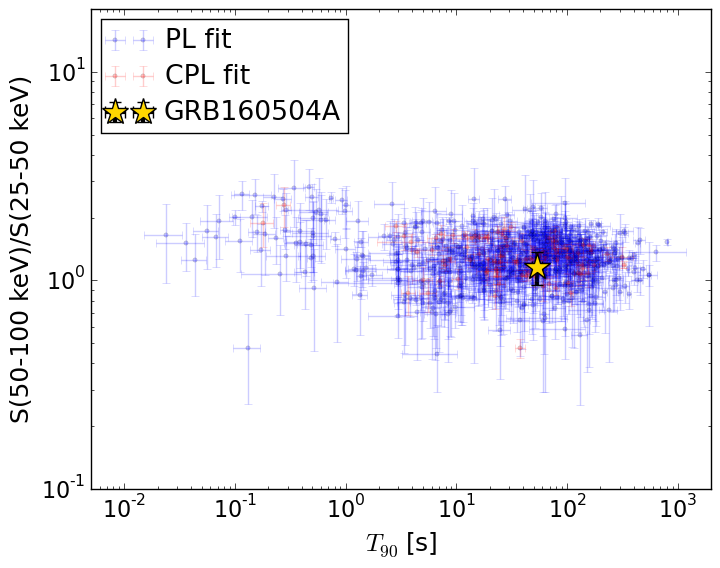
T90                                   = 53.96 sec.
Hardness ratio (energy fluence ratio) = 1.16000504356
S(15-50 keV) vs. S(50-150 keV) plot
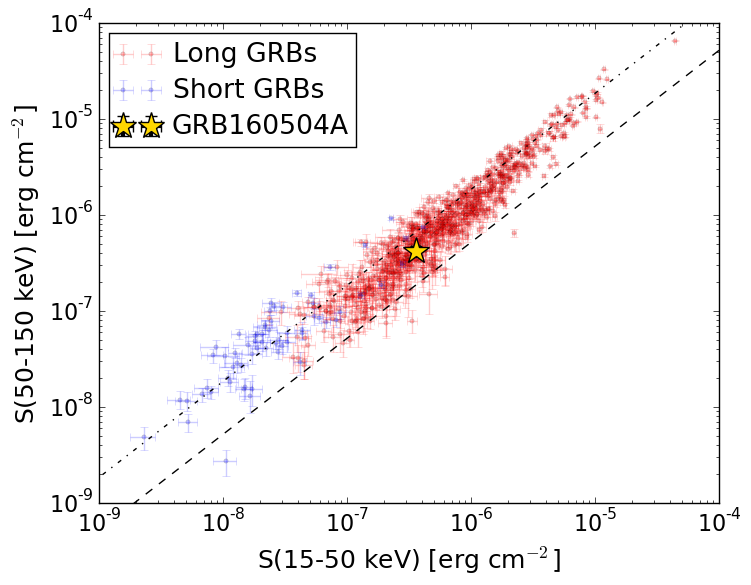
S(15-50 keV)  = 3.580456e-07
S(50-150 keV) = 4.178233e-07
The dash-dotted line and the dashed line traces the fluences calculated from the Band function with Epeak = 15 and 150 keV, respectively. Both lines assume a canonical values of alpha = -1 and beta = -2.5.
Mask shadow pattern
IMX = 2.257593271116630E-01, IMY = -2.105589530163878E-01
Spacecraft aspect plot
Bright source in the pre-burst/pre-slew/post-slew images
Pre-burst image of 15-350 keV band
Time interval of the image:
-239.568000 -42.392000

# RAcent  DECcent POSerr Theta    Phi  PeakCts   SNR AngSep     Name
#  [deg]    [deg]    ['] [deg]  [deg]                   [']
Pre-slew background subtracted image of 15-350 keV band
Time interval of the image:
-42.392000 16.196000

# RAcent  DECcent POSerr Theta    Phi  PeakCts   SNR AngSep     Name
#  [deg]    [deg]    ['] [deg]  [deg]                   [']
170.0758  55.9963    0.8  17.2   43.0   1.3464  14.6 ------	UNKNOWN
298.7423  71.1243    2.4  55.5  -14.5   1.4265   4.8 ------	UNKNOWN
Post-slew image of 15-350 keV band
Time interval of the image:
78.532600 838.492000
840.432000 906.032600

# RAcent  DECcent POSerr Theta    Phi  PeakCts   SNR AngSep     Name
#  [deg]    [deg]    ['] [deg]  [deg]                   [']
184.3113  21.6031    2.2  36.0  116.9   5.8243   5.2 ------	UNKNOWN
264.7569  50.3913    2.5  52.5   13.1   6.9637   4.6 ------	UNKNOWN
143.1047  13.5081    2.9  47.3  176.7   4.6853   4.0 ------	UNKNOWN
265.8777  66.0047    3.3  42.8   -3.5   2.8344   3.5 ------	UNKNOWN
118.9359  13.1377    5.2  58.0 -156.8   8.7707   2.3 ------	UNKNOWN
333.9709  69.1090    3.8  54.3  -33.1   8.7953   3.0 ------	UNKNOWN