Analysis Summary
Notes:
- 1) No attempt has been made to eliminate the non-significant decimal places.
- 2) This batgrbproduct analysis is done using the HEASARC data.
- 3) This batgrbproduct analysis is using the flight position for the mask-weighting calculation.
======================================================================
BAT GRB EVENT DATA PROCESSING REPORT
Process Script Ver: batgrbproduct v2.46
Process Start Time: Wed Jun 1 15:19:58 EDT 2016
Host Name: bat1
Current Working Dir: /local/data/bat1/alien/Swift_3rdBATcatalog/event/batevent_reproc/trigger685245
======================================================================
Trigger: 00685245 Segment: 000
BAT Trigger Time: 484198172.096 [s; MET]
Trigger Stop: 484198175.168 [s; MET]
UTC: 2016-05-06T03:29:15.868860 [includes UTCF correction]
Where From?: TDRSS position message
BAT
RA: 265.773548793878 Dec: -46.1170075164307 [deg; J2000]
Catalogged Source?: NO
Point Source?: YES
GRB Indicated?: YES [ by BAT flight software ]
Image S/N Ratio: 7.19
Image Trigger?: NO
Rate S/N Ratio: 10.0995049383621 [ if not an image trigger ]
Image S/N Ratio: 7.19
Analysis Position: [ source = BAT ]
RA: 265.773548793878 Dec: -46.1170075164307 [deg; J2000]
Refined Position: [ source = BAT pre-slew burst ]
RA: 265.849166644648 Dec: -46.1250911519052 [deg; J2000]
{ 17h 43m 23.8s , -46d 07' 30.3" }
+/- 1.59612585662831 [arcmin] (estimated 90% radius based on SNR)
+/- 0.591766556911414 [arcmin] (formal 1-sigma fit error)
SNR: 15.5963321491565
Angular difference between the analysis and refined position is 3.181994 arcmin
Partial Coding Fraction: 1.015625 [ including projection effects ]
Duration
T90: 260.527999937534 +/- 78.3182114524323
Measured from: -2.55199998617172
to: 257.975999951363 [s; relative to TRIGTIME]
T50: 105.235999941826 +/- 71.0785157584062
Measured from: 13.539999961853
to: 118.775999903679 [s; relative to TRIGTIME]
Fluence
Peak Flux (peak 1 second)
Measured from: 98.783999979496
to: 99.783999979496 [s; relative to TRIGTIME]
Total Fluence
Measured from: -9.09600001573563
to: 336.01599997282 [s; relative to TRIGTIME]
Band 1 Band 2 Band 3 Band 4
15-25 25-50 50-100 100-350 keV
Total 1.362534 1.059857 0.693505 -0.077292
0.120147 0.111238 0.090994 0.076145 [error]
Peak 0.021362 0.010535 0.016911 0.012989
0.006620 0.006142 0.004976 0.004036 [error]
[ fluence units of on-axis counts / fully illuminated detector ]
======================================================================
====== Table of the duration information =============================
Value tstart tstop
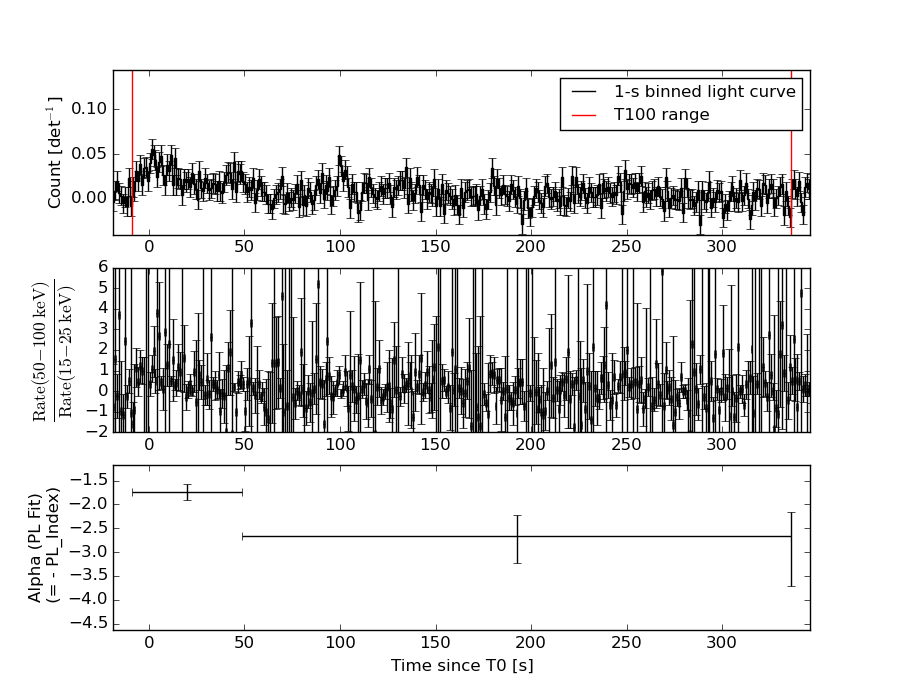
T100 345.112 -9.096 336.016
T90 260.528 -2.552 257.976
T50 105.236 13.540 118.776
Peak 1.000 98.784 99.784
====== Spectral Analysis Summary =====================================
Model : spectral model: simple power-law (PL) and cutoff power-law (CPL)
Ph_index : photon index: E^{Ph_index}
Ph_90err : 90% error of the photon index
Epeak : Epeak in keV
Epeak_90err: 90% error of Epeak
Norm : normalization at 50 keV in both the PL model and CPL model
Nomr_90err : 90% error of the normalization
chi2 : Chi-Squared
dof : degree of freedo
=== Time-averaged spectral analysis ===
(Best model with acceptable fit: PL)
Model Ph_index Ph_90err_low Ph_90err_hi Epeak Epeak_90err_low Epeak_90err_hi Norm Nomr_90err_low Norm_90err_hi chi2 dof
PL -2.122 -0.239 0.223 - - - 4.75e-04 -7.01e-05 6.75e-05 55.920 57
CPL -1.994 -0.021 0.416 2.956 N/A N/A 5.42e-04 N/A N/A 56.310 56
=== 1-s peak spectral analysis ===
(Best model with acceptable fit: N/A)
Model Ph_index Ph_90err_low Ph_90err_hi Epeak Epeak_90err_low Epeak_90err_hi Norm Nomr_90err_low Norm_90err_hi chi2 dof
PL -0.895 -0.783 1.079 - - - 3.24e-03 -1.55e-03 1.15e-03 46.420 57
CPL -0.944 -0.735 1.151 9999.360 -9999.360 -9999.360 3.31e-03 -1.60e-03 3.94e-03 46.460 56
=== Fluence/Peak Flux Summary ===
Model Band1 Band2 Band3 Band4 Band5 Total
15-25 25-50 50-100 100-350 15-150 15-350 keV
Fluence PL 3.77e-07 4.75e-07 4.36e-07 7.01e-07 1.53e-06 1.99e-06 erg/cm2
90%_error_low -5.94e-08 -5.13e-08 -8.86e-08 -2.50e-07 -1.95e-07 -3.54e-07 erg/cm2
90%_error_hi 6.13e-08 5.11e-08 9.07e-08 3.31e-07 2.00e-07 4.14e-07 erg/cm2
Peak flux PL 7.48e-02 1.08e-01 1.17e-01 2.34e-01 3.72e-01 5.33e-01 ph/cm2/s
90%_error_low -6.01e-02 -1.08e-01 -4.00e-02 -1.55e-01 -3.72e-01 -1.76e-01 ph/cm2/s
90%_error_hi 9.14e-02 5.88e-02 3.71e-02 3.78e-01 1.43e-01 2.64e-01 ph/cm2/s
Fluence CPL 3.78e-07 4.27e-07 3.60e-07 6.27e-07 1.36e-06 2.04e-06 erg/cm2
90%_error_low -6.26e-08 -1.53e-07 -2.16e-07 -4.90e-07 -5.28e-07 -1.12e-06 erg/cm2
90%_error_hi 6.27e-08 9.26e-08 1.60e-07 4.92e-07 3.66e-07 4.77e-07 erg/cm2
Peak flux CPL 7.75e-02 4.38e-02 1.57e-02 9.22e-03 1.43e-01 1.48e-01 ph/cm2/s
90%_error_low -7.75e-02 N/A -1.57e-02 -9.22e-03 N/A -1.48e-01 ph/cm2/s
90%_error_hi 1.10e-01 N/A 4.33e-02 3.27e-02 N/A 1.88e-01 ph/cm2/s
======================================================================
Image
Pre-slew 15.0-350.0 keV image (Event data)
#   RAcent    DECcent   POSerr    Theta     Phi              Peak Cts       SNR   Name
  265.8492   -46.1251   0.0123    17.1708   -16.1199         1.3944658     15.596 TRIG_00685245

Foreground time interval of the image:
 -9.096  44.005 (delta_t =  53.101 [sec])
Background time interval of the image:
-218.995  -9.096 (delta_t = 209.899 [sec])
Light Curves
Note: The mask-weighted lightcurves have units of either count/det or counts/sec/det, where a det is 0.4 x 0.4 = 0.16 sq cm.
Full-time range; 1 s binning
Other quick-look light curves:
- 64 ms binning (zoomed)
- 16 ms binning (zoomed)
- 8 ms binning (zoomed)
- 2 ms binning (zoomed)
- SN=5 or 10 s binning (full-time range)
- Raw light curve
Spectra
- 64 ms binning (zoomed)
- 16 ms binning (zoomed)
- 8 ms binning (zoomed)
- 2 ms binning (zoomed)
- SN=5 or 10 s binning (full-time range)
- Raw light curve
Spectra
Notes:
- 1) The fitting includes the systematic errors.
- 2) When the burst includes telescope slew time periods, the fitting uses an average response file made from multiple 5-s response files through out the slew time plus single time preiod for the non-slew times, and weighted by the total counts in the corresponding time period using addrmf. An average response file is needed becuase a spectral fit using the pre-slew DRM will introduce some errors in both a spectral shape and a normalization if the PHA file contains a lot of the slew/post-slew time interval.
- 3) For fits to more complicated models (e.g. a power-law over a cutoff power-law), the BAT team has decided to require a chi-square improvement of more than 6 for each extra dof.
Time averaged spectrum fit using the average DRM
Power-law model
Time interval is from   -9.096 sec. to  336.016 sec.

Spectral model in power-law:
------------------------------------------------------------
Parameters  : value       lower 90%   higher 90%
Photon index: -2.12205     ( -0.239003   0.222873 )
Norm@50keV  : 4.75003E-04    ( -7.00686e-05   6.74977e-05 )
------------------------------------------------------------
#Fit statistic : Chi-Squared =          55.92 using 59 PHA bins.
# Reduced chi-squared =         0.9810 for     57 degrees of freedom
# Null hypothesis probability =   5.157344e-01

Photon flux (15-150 keV)    in 345.1 sec: 7.55604E-02 ( -0.008128  0.008143 ) ph/cm2/s
Energy fluence (15-150 keV)             : 1.52674e-06 ( -1.95198e-07  1.99555e-07 ) ergs/cm2
Cutoff power-law model
Time interval is from   -9.096 sec. to  336.016 sec.
Spectral model in the cutoff power-law:
------------------------------------------------------------
Parameters  : value       lower 90%   higher 90%
Photon index: -2.37555     ( -0.0164401   0.421146 )
Epeak [keV] : 146.443      (   )
Norm@50keV  : 3.55852E-04    (     )
------------------------------------------------------------
#Fit statistic : Chi-Squared =          55.51 using 59 PHA bins.
# Reduced chi-squared =         0.9912 for     56 degrees of freedom
# Null hypothesis probability =   4.934430e-01

Photon flux (15-150 keV)    in 345.1 sec: 7.08647E-02 ( -0.0168517  0.0127907 ) ph/cm2/s
Energy fluence (15-150 keV)             : 1.3635e-06 ( -5.27503e-07  3.66137e-07 ) ergs/cm2
1-s peak spectrum fit
Power-law model
Time interval is from   98.784 sec. to   99.784 sec.

Spectral model in power-law:
------------------------------------------------------------
Parameters  : value       lower 90%   higher 90%
Photon index: -0.895164     ( -0.784762   1.07696 )
Norm@50keV  : 3.24353E-03    ( -0.00155097   0.00115456 )
------------------------------------------------------------
#Fit statistic : Chi-Squared =          46.42 using 59 PHA bins.
# Reduced chi-squared =         0.8144 for     57 degrees of freedom
# Null hypothesis probability =   8.403919e-01

Photon flux (15-150 keV)    in 1 sec: 0.371987 ( -0.371987  0.143175 ) ph/cm2/s
Energy fluence (15-150 keV)             : 3.6488e-08 ( -1.21234e-08  1.20386e-08 ) ergs/cm2
Cutoff power-law model

Time interval is from   98.784 sec. to   99.784 sec.
Spectral model in the cutoff power-law:
------------------------------------------------------------
Parameters  : value       lower 90%   higher 90%
Photon index: -0.943898     ( -0.737217   1.14874 )
Epeak [keV] : 9999.36      ( -9999.36 -9999.36 )
Norm@50keV  : 3.30626E-03    ( -0.00159832   0.00394005 )
------------------------------------------------------------
#Fit statistic : Chi-Squared =          46.46 using 59 PHA bins.
# Reduced chi-squared =         0.8296 for     56 degrees of freedom
# Null hypothesis probability =   8.145607e-01

Photon flux (15-150 keV)    in 1 sec: 0.142537 (    ) ph/cm2/s
Energy fluence (15-150 keV)             : 1.04263e-08 ( 0  0 ) ergs/cm2
Time-resolved spectra
Distribution
T90 vs. Hardness ratio plot
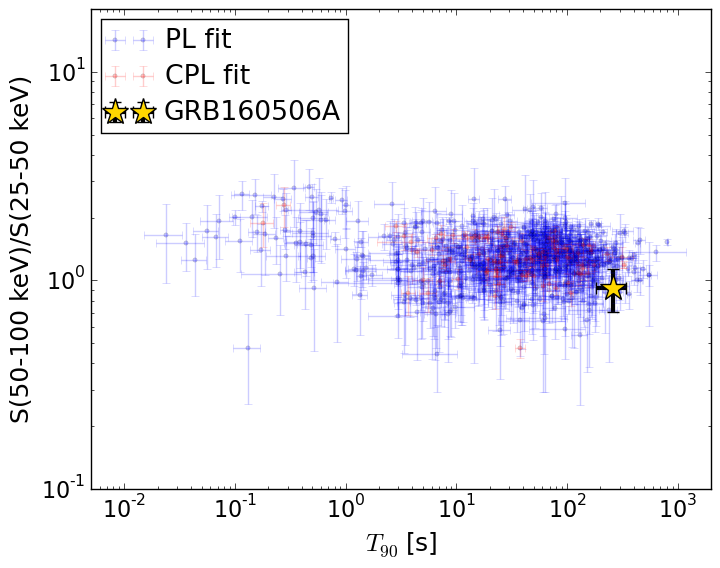
T90                                   = 260.528 sec.
Hardness ratio (energy fluence ratio) = 0.918924848595
S(15-50 keV) vs. S(50-150 keV) plot
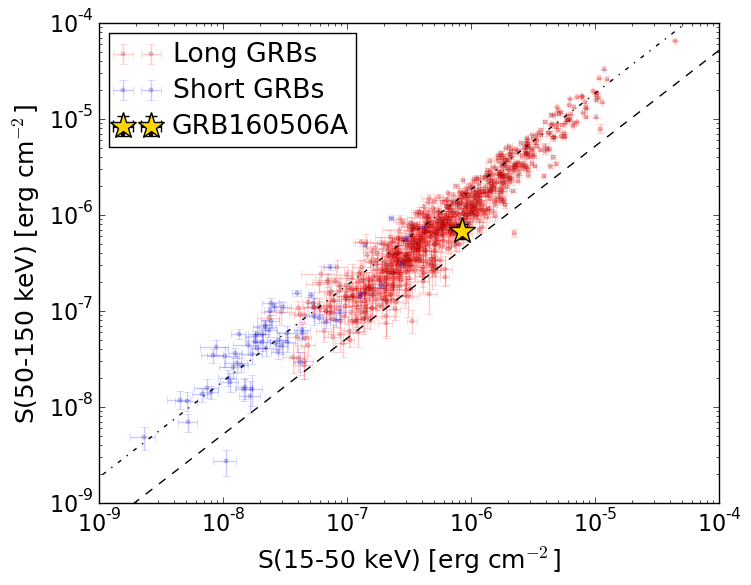
S(15-50 keV)  = 8.516094e-07
S(50-150 keV) = 6.751098e-07
The dash-dotted line and the dashed line traces the fluences calculated from the Band function with Epeak = 15 and 150 keV, respectively. Both lines assume a canonical values of alpha = -1 and beta = -2.5.
Mask shadow pattern
IMX = 2.968448034931285E-01, IMY = 8.579179527188278E-02
Spacecraft aspect plot
Bright source in the pre-burst/pre-slew/post-slew images
Pre-burst image of 15-350 keV band
Time interval of the image:
-218.995400 -9.096000

# RAcent  DECcent POSerr Theta    Phi  PeakCts   SNR AngSep     Name
#  [deg]    [deg]    ['] [deg]  [deg]                   [']
244.9642 -15.6461    0.5  23.8  101.8   7.2571  23.7    0.9	Sco X-1
255.9707 -37.8256    2.2  12.4   24.3   1.1151   5.1    1.3	4U 1700-377
256.2185 -36.4583    5.1  11.4   28.7   0.5077   2.3   10.7	GX 349+2
263.0220 -24.7444    5.3   5.2  125.9   0.4924   2.2    0.7	GX 1+4
264.5652 -44.5661   10.6  15.7  -12.6   0.2423   1.1   10.3	4U 1735-44
268.2169  -1.4813    8.0  27.5  166.4  -0.3897  -1.4    9.2	SW J1753.5-0127
270.3282 -25.1218    2.9   5.2 -154.5   0.9431   4.1    3.5	GX 5-1
270.3003 -25.7156    3.9   4.7 -149.9   0.7888   3.5    1.7	GRS 1758-258
274.0941 -14.1281    5.1  16.4 -170.3   0.5154   2.3    7.5	GX 17+2
275.9788 -30.3926    4.4   8.4  -95.3   0.5682   2.7    3.2	H1820-303
284.8829 -24.9296    7.9  16.9 -116.9  -0.3508  -1.5    8.3	HT1900.1-2455
288.7872  10.9469    5.6  45.4 -165.8   0.9732   2.0    0.7	GRS 1915+105
263.1211 -33.9741    3.5   5.8   11.0   0.7053   3.3   10.6	GX 354-0
244.3122   6.3926    2.2  41.3  128.0   4.0385   5.2 ------	UNKNOWN
210.0151 -42.4121    3.5  46.9   40.0   2.3624   3.3 ------	UNKNOWN
255.3113 -41.6786    1.9  15.6   14.9   1.3344   6.0 ------	UNKNOWN
282.4033  26.1738    2.7  57.2  179.6   5.6398   4.3 ------	UNKNOWN
282.7649 -66.7430    3.7  39.1  -27.6   1.0327   3.1 ------	UNKNOWN
308.6426 -40.8383    4.7  36.2  -76.9   1.5031   2.4 ------	UNKNOWN
Pre-slew background subtracted image of 15-350 keV band
Time interval of the image:
-9.096000 44.004600

# RAcent  DECcent POSerr Theta    Phi  PeakCts   SNR AngSep     Name
#  [deg]    [deg]    ['] [deg]  [deg]                   [']
245.1106 -15.5466    4.7  23.8  102.2   0.3004   2.4    9.4	Sco X-1
255.9957 -38.0106    8.4  12.5   23.6   0.1283   1.4   10.0	4U 1700-377
256.5591 -36.5694    8.3  11.2   27.4   0.1274   1.4   10.6	GX 349+2
263.1536 -24.8243    4.8   5.1  126.5  -0.2137  -2.4    9.2	GX 1+4
264.7618 -44.5245    3.0  15.6  -13.1   0.3399   3.9    4.5	4U 1735-44
268.2407  -1.4109    3.7  27.6  166.4   0.3222   3.1    8.0	SW J1753.5-0127
270.1803 -24.9858   11.9   5.2 -156.6  -0.0848  -1.0    8.0	GX 5-1
270.0977 -25.8465    0.0   4.5 -150.4   0.2253   2.5   12.7	GRS 1758-258
274.1262 -14.1618    3.8  16.4 -170.2  -0.2671  -3.0   10.3	GX 17+2
276.0816 -30.4500   23.8   8.5  -95.0  -0.0432  -0.5    9.5	H1820-303
284.8943 -24.7693   10.7  17.0 -117.4   0.1050   1.1   11.9	HT1900.1-2455
288.6728  10.8511    4.8  45.2 -165.9  -0.3872  -2.4    9.3	GRS 1915+105
262.8541 -33.8369   19.6   5.8   13.6   0.0528   0.6    6.7	GX 354-0
265.8492 -46.1251    0.7  17.2  -16.1   1.3945  15.7 ------	UNKNOWN
Post-slew image of 15-350 keV band
Time interval of the image:
83.804590 962.944700

# RAcent  DECcent POSerr Theta    Phi  PeakCts   SNR AngSep     Name
#  [deg]    [deg]    ['] [deg]  [deg]                   [']
170.4209 -60.6848    5.4  53.4   11.6  -4.7441  -2.1    4.8	Cen X-3
186.6585 -62.7493    1.1  45.5   13.3  14.9662  10.5    1.3	GX 301-2
244.9770 -15.6399    0.5  35.1  117.7  37.0644  21.2    0.1	Sco X-1
255.9732 -37.8497    0.9  11.0  109.5   9.3526  12.4    0.7	4U 1700-377
256.3613 -36.4399    7.0  12.0  114.9   1.2254   1.6    3.7	GX 349+2
263.0159 -24.7551    5.5  21.5  147.4   1.6612   2.1    0.7	GX 1+4
264.4905 -44.4749   73.4   1.9  125.2   0.1359   0.2   10.9	4U 1735-44
268.2291  -1.4593    7.0  44.7  157.7  -3.3393  -1.6    8.3	SW J1753.5-0127
270.3300 -25.1021    3.4  21.3  165.7   2.6227   3.4    2.8	GX 5-1
270.3040 -25.6837    4.6  20.8  165.8   1.9602   2.6    3.6	GRS 1758-258
273.9812 -14.0322    2.7  32.8  169.1   3.8566   4.2    1.5	GX 17+2
275.8726 -30.3636    7.3  17.6 -175.7   1.1032   1.6    2.7	H1820-303
285.0349 -24.9134  119.4  26.2 -163.1   0.0731   0.1    0.4	HT1900.1-2455
263.0100 -33.8224    2.8  12.5  143.6   2.9308   4.2    1.3	GX 354-0
245.0789 -14.3388    3.3  36.2  118.8   5.9802   3.5 ------	UNKNOWN
166.7516 -62.7486    4.0  53.8    8.3   6.6986   2.9 ------	UNKNOWN
305.5039   0.1691    4.7  57.9 -156.8  13.0790   2.5 ------	UNKNOWN