Analysis Summary
Notes:
- 1) No attempt has been made to eliminate the non-significant decimal places.
- 2) This batgrbproduct analysis is done using the HEASARC data.
- 3) This batgrbproduct analysis is using the flight position for the mask-weighting calculation.
======================================================================
                  BAT GRB EVENT DATA PROCESSING REPORT
    Process Script Ver: batgrbproduct v2.46
    Process Start Time: Tue Jun 21 08:57:24 EDT 2016
             Host Name: bat1
   Current Working Dir: /local/data/bat1/alien/Swift_3rdBATcatalog/event/batevent_reproc/trigger687492
======================================================================

  Trigger: 00687492      Segment: 000

  BAT Trigger Time: 485832856   [s; MET]
      Trigger Stop: 485832920   [s; MET]
               UTC: 2016-05-25T01:33:59.682820    [includes UTCF correction]
       Where From?: TDRSS position message

  BAT
    RA: 103.530165020782   Dec: -0.17351014677238  [deg; J2000]

     Catalogged Source?: NO
     Point Source?:      YES
     GRB Indicated?:     YES    [ by BAT flight software ]
     Image S/N Ratio:    7.19
     Image Trigger?:     YES
     Rate S/N Ratio:     0  [ if not an image trigger ]
     Image S/N Ratio:    7.19

  Analysis Position:   [ source = BAT ]
    RA: 103.530165020782   Dec: -0.17351014677238  [deg; J2000]

  Refined Position:   [ source = BAT pre-slew burst ]
    RA: 103.53   Dec: -0.173509  [deg; J2000]
        { 06h 54m 07.2s , 00d -10' -24.6" }
        +/- 2.9214566106 [arcmin] (estimated 90% radius based on SNR)
    SNR: 6.57708023186


  Angular difference between the analysis and refined position is 0.009901 arcmin

  Partial Coding Fraction: 0.984375    [ including projection effects ]

  Duration
     T90: N/A +/- N/A
        Measured from: N/A
                   to: N/A     [s; relative to TRIGTIME]
     T50: N/A +/- N/A
        Measured from: N/A
                   to: N/A     [s; relative to TRIGTIME]

    WARNING: battblocks failed.  Used TDRSS fore/background intervals

======================================================================


====== Table of the duration information =============================

        Value   tstart    tstop
T100    0.000    0.000    0.000
T90     0.000    0.000    0.000
T50     0.000    0.000    0.000
Peak    0.000    0.000    0.000


====== Spectral Analysis Summary =====================================

Model      : spectral model: simple power-law (PL) and cutoff power-law (CPL)
Ph_index   : photon index: E^{Ph_index}
Ph_90err   : 90% error of the photon index
Epeak      : Epeak in keV
Epeak_90err: 90% error of Epeak
Norm       : normalization at 50 keV in both the PL model and CPL model
Nomr_90err : 90% error of the normalization
chi2       : Chi-Squared
dof        : degree of freedo

=== Time-averaged spectral analysis ===
(Best model with acceptable fit: N/A)

Model Ph_index Ph_90err_low Ph_90err_hi  Epeak  Epeak_90err_low  Epeak_90err_hi  Norm       Nomr_90err_low    Norm_90err_hi    chi2    dof
PL      -2.622    -0.607      0.489       -           -               -         2.86e-04     -1.29e-04          1.42e-04      43.520   57
CPL      0.928    -2.579      6.228       25.295      -7.628         7.039      8.18e-02     -8.18e-02          4.30e+03      38.010   56


=== 1-s peak spectral analysis ===
(Best model with acceptable fit: N/A)

Model Ph_index Ph_90err_low Ph_90err_hi  Epeak  Epeak_90err_low  Epeak_90err_hi  Norm       Nomr_90err_low    Norm_90err_hi    chi2    dof
PL      N/A         N/A       N/A          -           -               -           N/A           N/A               N/A         N/A        N/A
CPL     N/A         N/A       N/A          N/A         N/A           N/A           N/A           N/A               N/A         N/A        N/A


=== Fluence/Peak Flux Summary ===

              Model    Band1     Band2     Band3     Band4     Band5     Total
                       15-25     25-50    50-100    100-350    15-150    15-350    keV
Fluence         PL   6.79e-08  6.37e-08  4.15e-08  4.18e-08  1.90e-07  2.14e-07   erg/cm2
      90%_error_low -1.83e-08 -2.12e-08 -2.25e-08 -3.05e-08 -6.21e-08 -7.89e-08   erg/cm2
      90%_error_hi   1.84e-08  2.08e-08  2.92e-08  6.69e-08  7.04e-08  1.11e-07   erg/cm2
Peak flux       PL     N/A      N/A      N/A      N/A      N/A      N/A     ph/cm2/s
Image
Pre-slew 15.0-50.0 keV image (Event data)
#   RAcent    DECcent   POSerr    Theta     Phi     Peak Cts  SNR   Name
    103.530   -0.174    0.000     10.915    -67.355 0.467     6.577 TRIG_00687492

Image time interval: 0.000 to 64.000 [sec]
Light Curves
Note: The mask-weighted lightcurves have units of either count/det or counts/sec/det, where a det is 0.4 x 0.4 = 0.16 sq cm.
Full-time range; 1 s binning
Other quick-look light curves:
- 64 ms binning (zoomed)
- 16 ms binning (zoomed)
- 8 ms binning (zoomed)
- 2 ms binning (zoomed)
- SN=5 or 10 s binning (full-time range)
- Raw light curve
Spectra
- 64 ms binning (zoomed)
- 16 ms binning (zoomed)
- 8 ms binning (zoomed)
- 2 ms binning (zoomed)
- SN=5 or 10 s binning (full-time range)
- Raw light curve
Spectra
Notes:
- 1) The fitting includes the systematic errors.
- 2) When the burst includes telescope slew time periods, the fitting uses an average response file made from multiple 5-s response files through out the slew time plus single time preiod for the non-slew times, and weighted by the total counts in the corresponding time period using addrmf. An average response file is needed becuase a spectral fit using the pre-slew DRM will introduce some errors in both a spectral shape and a normalization if the PHA file contains a lot of the slew/post-slew time interval.
- 3) For fits to more complicated models (e.g. a power-law over a cutoff power-law), the BAT team has decided to require a chi-square improvement of more than 6 for each extra dof.
Time averaged spectrum fit using the average DRM
Power-law model
Time interval is from    0.000 sec. to   64.000 sec.

Spectral model in power-law:
------------------------------------------------------------
Parameters  : value       lower 90%   higher 90%
Photon index: -2.62222     ( -0.611867   0.484026 )
Norm@50keV  : 2.86203E-04    ( -0.000130032   0.000141841 )
------------------------------------------------------------
#Fit statistic : Chi-Squared =          43.52 using 59 PHA bins.
# Reduced chi-squared =         0.7635 for     57 degrees of freedom
# Null hypothesis probability =   9.056671e-01

Photon flux (15-150 keV)    in 64 sec: 6.07461E-02 ( -0.0157518  0.0159294 ) ph/cm2/s
Energy fluence (15-150 keV)             : 1.90187e-07 ( -6.21102e-08  7.03923e-08 ) ergs/cm2
Cutoff power-law model
Time interval is from    0.000 sec. to   64.000 sec.
Spectral model in the cutoff power-law:
------------------------------------------------------------
Parameters  : value       lower 90%   higher 90%
Photon index: 0.928429     ( -2.61613   6.19111 )
Epeak [keV] : 25.2953      ( -7.69657 6.9705 )
Norm@50keV  : 8.17607E-02    ( -0.0967295   4302.33 )
------------------------------------------------------------
#Fit statistic : Chi-Squared =          38.01 using 59 PHA bins.
# Reduced chi-squared =         0.6787 for     56 degrees of freedom
# Null hypothesis probability =   9.686522e-01

Photon flux (15-150 keV)    in 64 sec: 6.16879E-02 ( -0.0147758  0.0149049 ) ph/cm2/s
Energy fluence (15-150 keV)             : 1.66652e-07 ( -4.61784e-08  5.12749e-08 ) ergs/cm2
1-s peak spectrum fit
1-s peak spectrum unavailable, likely because there are no event data in the 1-s peak range.
Time-resolved spectra

Distribution
T90 vs. Hardness ratio plot
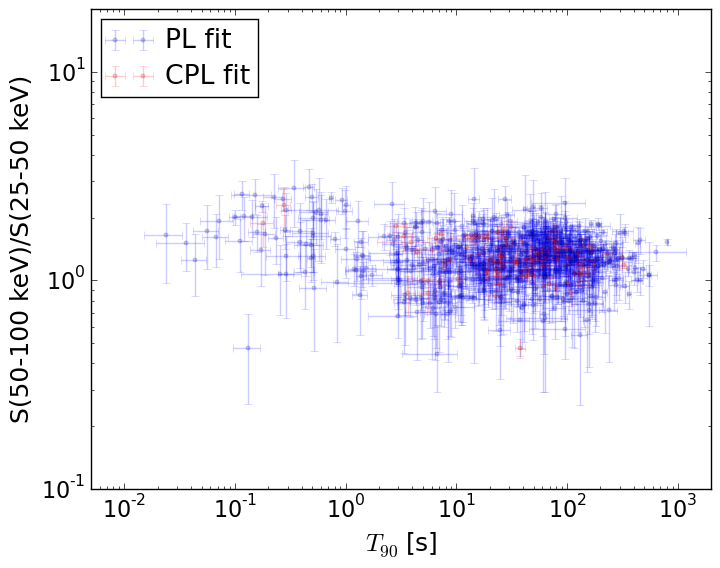
T90                                   = N/A sec.
Hardness ratio (energy fluence ratio) = N/A
S(15-50 keV) vs. S(50-150 keV) plot
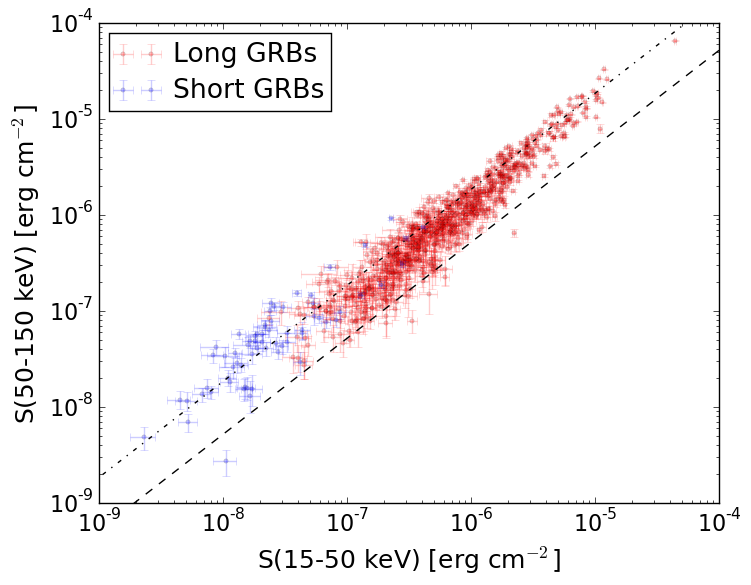
S(15-50 keV)  = N/A
S(50-150 keV) = N/A
The dash-dotted line and the dashed line traces the fluences calculated from the Band function with Epeak = 15 and 150 keV, respectively. Both lines assume a canonical values of alpha = -1 and beta = -2.5.
Mask shadow pattern
IMX = 0.0742453777469, IMY = 0.177968965962
Spacecraft aspect plot
Bright source in the pre-burst/pre-slew/post-slew images
Pre-burst image of 15-350 keV band
Time interval of the image:
Pre-slew background subtracted image of 15-350 keV band
Time interval of the image:
0.000000 64.000000

# RAcent  DECcent POSerr Theta    Phi  PeakCts   SNR AngSep     Name
#  [deg]    [deg]    ['] [deg]  [deg]                   [']
 83.6407  22.0348    1.2  40.3  -62.7   2.4801  10.0    1.3	Crab
135.4750 -40.6705    8.6  39.3  130.0   0.3535   1.3    7.4	Vela X-1
114.0644 -36.2211    2.2  28.6  154.7   0.6242   5.2 ------	UNKNOWN
103.5733  -0.1943    2.1  10.9  -67.3   0.5092   5.5 ------	UNKNOWN
Post-slew image of 15-350 keV band
Time interval of the image:
324.300590 585.300600

# RAcent  DECcent POSerr Theta    Phi  PeakCts   SNR AngSep     Name
#  [deg]    [deg]    ['] [deg]  [deg]                   [']
135.4528 -40.5485    4.6  30.3 -108.8   0.9810   2.5    3.5	Vela X-1
170.3156 -60.5916    3.7  23.0 -175.5   0.7760   3.1    1.9	Cen X-3
186.5701 -62.7820    1.0  26.1  166.7   3.4020  12.1    2.5	GX 301-2