Analysis Summary
Notes:
- 1) No attempt has been made to eliminate the non-significant decimal places.
- 2) This batgrbproduct analysis is done using the HEASARC data.
- 3) This batgrbproduct analysis is using the flight position for the mask-weighting calculation.
======================================================================
                  BAT GRB EVENT DATA PROCESSING REPORT
    Process Script Ver: batgrbproduct v2.46
    Process Start Time: Tue Jun 21 08:53:24 EDT 2016
             Host Name: bat1
   Current Working Dir: /local/data/bat1/alien/Swift_3rdBATcatalog/event/batevent_reproc/trigger687522
======================================================================

  Trigger: 00687522      Segment: 000

  BAT Trigger Time: 485861123.968   [s; MET]
      Trigger Stop: 485861124.48   [s; MET]
               UTC: 2016-05-25T09:25:07.649260    [includes UTCF correction]
       Where From?: TDRSS position message

  BAT
    RA: 149.442925515661   Dec: 51.1802165201058  [deg; J2000]

     Catalogged Source?: NO
     Point Source?:      YES
     GRB Indicated?:     YES    [ by BAT flight software ]
     Image S/N Ratio:    6.55
     Image Trigger?:     NO
     Rate S/N Ratio:     11.3578166916005  [ if not an image trigger ]
     Image S/N Ratio:    6.55

  Analysis Position:   [ source = BAT ]
    RA: 149.442925515661   Dec: 51.1802165201058  [deg; J2000]

  Refined Position:   [ source = BAT pre-slew burst ]
    RA: 149.438236452283   Dec: 51.1967622366146  [deg; J2000]
        { 09h 57m 45.2s , +51d 11' 48.3" }
         +/- 2.18247287001802 [arcmin] (estimated 90% radius based on SNR)
         +/- 1.15642576875452 [arcmin] (formal 1-sigma fit error)
    SNR: 9.97483525889028

  Angular difference between the analysis and refined position is 1.008282 arcmin

  Partial Coding Fraction: 0.8125    [ including projection effects ]

  Duration
     T90: 0.291999936103821 +/- 0.0456069787374054
        Measured from: 0.0279999971389771
                   to: 0.319999933242798     [s; relative to TRIGTIME]
     T50: 0.111999988555908 +/- 0.0636553038431823
        Measured from: 0.139999985694885
                   to: 0.251999974250793     [s; relative to TRIGTIME]


  Fluence
     Peak Flux  (peak 1 second)
        Measured from: -0.324000000953674
                   to: 0.675999999046326     [s; relative to TRIGTIME]
     Total Fluence
        Measured from: 0.0160000324249268
                   to: 0.332000017166138     [s; relative to TRIGTIME]

             Band 1     Band 2     Band 3     Band 4
              15-25      25-50     50-100    100-350     keV
 Total     0.023671   0.022296   0.015857   0.011736
           0.004328   0.004317   0.003729   0.002999 [error]
 Peak      0.033492   0.037291   0.032721   0.014650
           0.006812   0.007421   0.006300   0.005262 [error]

     [ fluence units of on-axis counts / fully illuminated detector ]

======================================================================


====== Table of the duration information =============================

        Value   tstart    tstop
T100    0.316    0.016    0.332
T90     0.292    0.028    0.320
T50     0.112    0.140    0.252
Peak    1.000   -0.324    0.676


====== Spectral Analysis Summary =====================================

Model      : spectral model: simple power-law (PL) and cutoff power-law (CPL)
Ph_index   : photon index: E^{Ph_index}
Ph_90err   : 90% error of the photon index
Epeak      : Epeak in keV
Epeak_90err: 90% error of Epeak
Norm       : normalization at 50 keV in both the PL model and CPL model
Nomr_90err : 90% error of the normalization
chi2       : Chi-Squared
dof        : degree of freedo

=== Time-averaged spectral analysis ===
(Best model with acceptable fit: PL)

Model Ph_index Ph_90err_low Ph_90err_hi  Epeak  Epeak_90err_low  Epeak_90err_hi  Norm       Nomr_90err_low    Norm_90err_hi    chi2    dof
PL      -1.899    -0.365      0.336       -           -               -         1.08e-02     -2.70e-03          2.61e-03      47.540   57
CPL     -0.602    -1.484      2.195       45.001     -45.001       -45.001      6.12e-02     -6.12e-02          1.15e+00      45.410   56


=== 1-s peak spectral analysis ===
(Best model with acceptable fit: PL)

Model Ph_index Ph_90err_low Ph_90err_hi  Epeak  Epeak_90err_low  Epeak_90err_hi  Norm       Nomr_90err_low    Norm_90err_hi    chi2    dof
PL      -1.463     -0.328     0.327       -           -               -         7.22e-03     -1.39e-03          1.37e-03      50.580   57
CPL     -1.407     -1.823     1.214      511.091    -511.091      -511.091      7.72e-03     -1.87e-03          -7.72e-03      50.610   56


=== Fluence/Peak Flux Summary ===

              Model    Band1     Band2     Band3     Band4     Band5     Total
                       15-25     25-50    50-100    100-350    15-150    15-350    keV
Fluence         PL   6.35e-09  9.15e-09  9.82e-09  1.96e-08  3.14e-08  4.49e-08   erg/cm2
      90%_error_low -1.75e-09 -1.90e-09 -3.14e-09 -9.96e-09 -7.52e-09 -1.42e-08   erg/cm2
      90%_error_hi   1.82e-09  1.89e-09  3.23e-09  1.49e-08  7.74e-09  1.79e-08   erg/cm2
Peak flux       PL   2.87e-01  2.95e-01  2.14e-01  2.49e-01  8.93e-01  1.05e+00   ph/cm2/s
      90%_error_low -8.92e-02 -5.99e-02 -5.14e-02 -1.03e-01 -1.69e-01 -1.98e-01   ph/cm2/s
      90%_error_hi   9.60e-02  5.87e-02  5.03e-02  1.40e-01  1.70e-01  2.00e-01   ph/cm2/s

Fluence        CPL   5.76e-09  1.08e-08  9.40e-09  3.26e-09  2.84e-08  2.92e-08   erg/cm2
      90%_error_low -2.03e-09 -2.69e-09 -4.19e-09 -2.98e-09 -7.34e-09 -8.08e-09   erg/cm2
      90%_error_hi   2.01e-09  2.86e-09  3.85e-09  2.04e-08  8.31e-09  2.27e-08   erg/cm2
Peak flux      CPL   2.88e-01  2.94e-01  2.13e-01  2.55e-01  8.95e-01  1.05e+00   ph/cm2/s
      90%_error_low     N/A   -5.93e-02 -5.10e-02     N/A   -1.76e-01 -2.79e-01   ph/cm2/s
      90%_error_hi      N/A    7.12e-02  5.64e-02     N/A    1.72e-01  1.82e-01   ph/cm2/s

======================================================================
Image
Pre-slew 15.0-350.0 keV image (Event data)
#   RAcent    DECcent   POSerr    Theta     Phi              Peak Cts       SNR   Name
  149.4382    51.1968   0.0192    27.8376   172.6543         0.0780268      9.975 TRIG_00687522

Foreground time interval of the image:
  0.016   0.332 (delta_t =   0.316 [sec])
Background time interval of the image:
-495.767 -480.108 (delta_t =  15.659 [sec])
-239.968   0.016 (delta_t = 239.984 [sec])
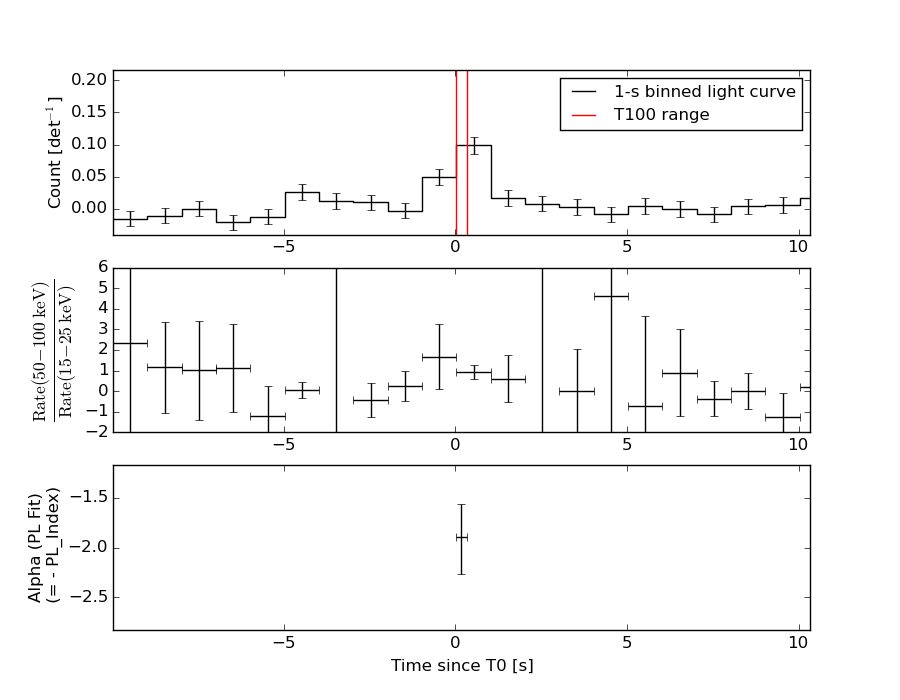
Light Curves
Note: The mask-weighted lightcurves have units of either count/det or counts/sec/det, where a det is 0.4 x 0.4 = 0.16 sq cm.
Full-time range; 1 s binning
Other quick-look light curves:
- 64 ms binning (zoomed)
- 16 ms binning (zoomed)
- 8 ms binning (zoomed)
- 2 ms binning (zoomed)
- SN=5 or 10 s binning (full-time range)
- Raw light curve
Spectra
- 64 ms binning (zoomed)
- 16 ms binning (zoomed)
- 8 ms binning (zoomed)
- 2 ms binning (zoomed)
- SN=5 or 10 s binning (full-time range)
- Raw light curve
Spectra
Notes:
- 1) The fitting includes the systematic errors.
- 2) When the burst includes telescope slew time periods, the fitting uses an average response file made from multiple 5-s response files through out the slew time plus single time preiod for the non-slew times, and weighted by the total counts in the corresponding time period using addrmf. An average response file is needed becuase a spectral fit using the pre-slew DRM will introduce some errors in both a spectral shape and a normalization if the PHA file contains a lot of the slew/post-slew time interval.
- 3) For fits to more complicated models (e.g. a power-law over a cutoff power-law), the BAT team has decided to require a chi-square improvement of more than 6 for each extra dof.
Time averaged spectrum fit using the average DRM
Power-law model
Time interval is from    0.016 sec. to    0.332 sec.

Spectral model in power-law:
------------------------------------------------------------
Parameters  : value       lower 90%   higher 90%
Photon index: -1.89868     ( -0.364993   0.335711 )
Norm@50keV  : 1.08048E-02    ( -0.00269763   0.00261349 )
------------------------------------------------------------
#Fit statistic : Chi-Squared =          47.54 using 59 PHA bins.
# Reduced chi-squared =         0.8341 for     57 degrees of freedom
# Null hypothesis probability =   8.097246e-01

Photon flux (15-150 keV)    in 0.316 sec: 1.54982 ( -0.32097  0.32105 ) ph/cm2/s
Energy fluence (15-150 keV)             : 3.13962e-08 ( -7.52484e-09  7.73625e-09 ) ergs/cm2
Cutoff power-law model
Time interval is from    0.016 sec. to    0.332 sec.
Spectral model in the cutoff power-law:
------------------------------------------------------------
Parameters  : value       lower 90%   higher 90%
Photon index: -0.60159     ( -1.48417   2.19439 )
Epeak [keV] : 45.0010      ( -44.999 -44.999 )
Norm@50keV  : 6.12397E-02    ( -0.0612829   1.14849 )
------------------------------------------------------------
#Fit statistic : Chi-Squared =          45.41 using 59 PHA bins.
# Reduced chi-squared =         0.8109 for     56 degrees of freedom
# Null hypothesis probability =   8.432209e-01

Photon flux (15-150 keV)    in 0.316 sec: 1.51022 ( -0.32336  0.32409 ) ph/cm2/s
Energy fluence (15-150 keV)             : 2.84457e-08 ( -7.3416e-09  8.30511e-09 ) ergs/cm2
1-s peak spectrum fit
Power-law model
Time interval is from   -0.324 sec. to    0.676 sec.

Spectral model in power-law:
------------------------------------------------------------
Parameters  : value       lower 90%   higher 90%
Photon index: -1.4634     ( -0.328343   0.32656 )
Norm@50keV  : 7.22167E-03    ( -0.00138615   0.0013718 )
------------------------------------------------------------
#Fit statistic : Chi-Squared =          50.58 using 59 PHA bins.
# Reduced chi-squared =         0.8874 for     57 degrees of freedom
# Null hypothesis probability =   7.130228e-01

Photon flux (15-150 keV)    in 1 sec: 0.892987 ( -0.169495  0.169813 ) ph/cm2/s
Energy fluence (15-150 keV)             : 6.89477e-08 ( -1.44284e-08  1.46145e-08 ) ergs/cm2
Cutoff power-law model
Time interval is from   -0.324 sec. to    0.676 sec.
Spectral model in the cutoff power-law:
------------------------------------------------------------
Parameters  : value       lower 90%   higher 90%
Photon index: -1.46083     ( -1.75589   1.28125 )
Epeak [keV] : 1.00000E+04      ( -10000 -10000 )
Norm@50keV  : 7.24496E-03    ( -0.00139504   -0.00724506 )
------------------------------------------------------------
#Fit statistic : Chi-Squared =          50.58 using 59 PHA bins.
# Reduced chi-squared =         0.9033 for     56 degrees of freedom
# Null hypothesis probability =   6.793377e-01

Photon flux (15-150 keV)    in 1 sec: 0.894736 ( -0.176433  0.171934 ) ph/cm2/s
Energy fluence (15-150 keV)             : 6.92261e-08 ( -1.60128e-08  1.47973e-08 ) ergs/cm2
Time-resolved spectra
Distribution
T90 vs. Hardness ratio plot
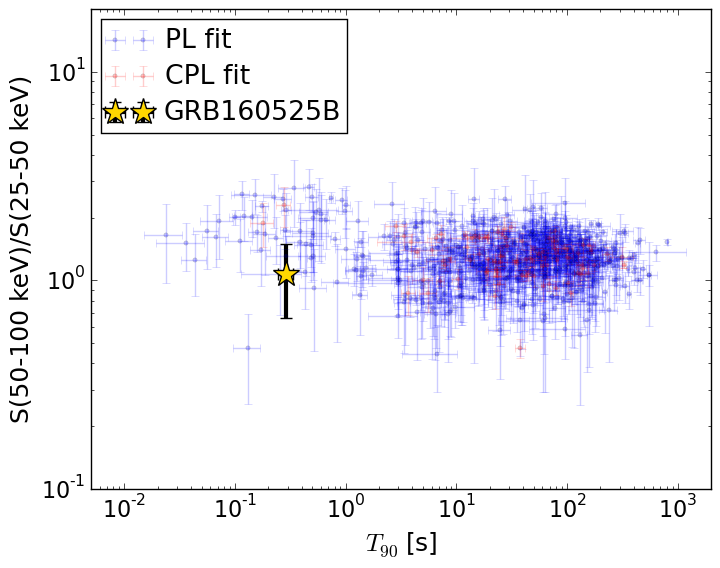
T90                                   = 0.2919999 sec.
Hardness ratio (energy fluence ratio) = 1.07287712713
S(15-50 keV) vs. S(50-150 keV) plot
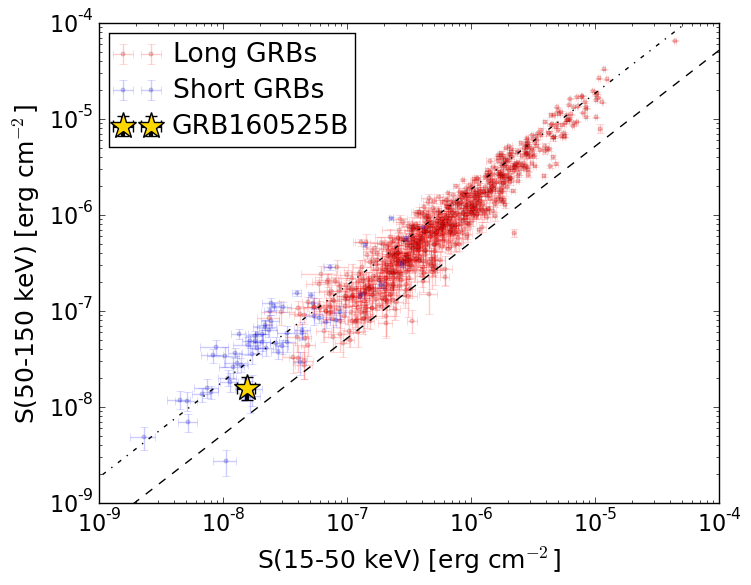
S(15-50 keV)  = 1.550132e-08
S(50-150 keV) = 1.5894816e-08
The dash-dotted line and the dashed line traces the fluences calculated from the Band function with Epeak = 15 and 150 keV, respectively. Both lines assume a canonical values of alpha = -1 and beta = -2.5.
Mask shadow pattern
IMX = -5.237457822660342E-01, IMY = -6.751795674553224E-02
Spacecraft aspect plot
Bright source in the pre-burst/pre-slew/post-slew images
Pre-burst image of 15-350 keV band
Time interval of the image:
-495.767400 -480.108000
-239.968000 0.016000

# RAcent  DECcent POSerr Theta    Phi  PeakCts   SNR AngSep     Name
#  [deg]    [deg]    ['] [deg]  [deg]                   [']
278.3160  47.1942    3.0  50.4   36.7   4.0124   3.8 ------	UNKNOWN
205.8270  80.7764    2.5   9.8   47.0   0.9179   4.5 ------	UNKNOWN
147.1494  23.3067    3.0  55.7  175.5   4.4386   3.9 ------	UNKNOWN
117.4420  62.8873    2.1  18.5 -138.4   1.1217   5.4 ------	UNKNOWN
 69.7350  61.7442    2.7  28.0  -86.5   1.2111   4.3 ------	UNKNOWN
Pre-slew background subtracted image of 15-350 keV band
Time interval of the image:
0.016000 0.332000

# RAcent  DECcent POSerr Theta    Phi  PeakCts   SNR AngSep     Name
#  [deg]    [deg]    ['] [deg]  [deg]                   [']
202.7531  55.1971    2.3  29.7  104.3   0.0543   5.1 ------	UNKNOWN
149.4383  51.1967    1.2  27.8  172.7   0.0780  10.0 ------	UNKNOWN
113.9782  30.9359    2.1  50.2 -146.8   0.1035   5.6 ------	UNKNOWN
Post-slew image of 15-350 keV band
Time interval of the image:
67.532620 962.058500

# RAcent  DECcent POSerr Theta    Phi  PeakCts   SNR AngSep     Name
#  [deg]    [deg]    ['] [deg]  [deg]                   [']
190.8693  25.4207    3.6  40.6  102.4   7.3309   3.3 ------	UNKNOWN
287.9650  69.8051    2.3  55.3    5.1   9.8009   5.0 ------	UNKNOWN
121.0864  -1.4623    5.0  57.9 -156.9   9.2229   2.3 ------	UNKNOWN
 13.0447  67.6314    4.0  56.8  -29.3  10.4589   2.9 ------	UNKNOWN
 77.1301  53.0980    4.4  42.5  -68.9   6.7599   2.7 ------	UNKNOWN