Analysis Summary
Notes:
- 1) No attempt has been made to eliminate the non-significant decimal places.
- 2) This batgrbproduct analysis is done using the HEASARC data.
- 3) This batgrbproduct analysis is using the flight position for the mask-weighting calculation.
======================================================================
                  BAT GRB EVENT DATA PROCESSING REPORT
    Process Script Ver: batgrbproduct v2.46
    Process Start Time: Fri Jul 15 14:21:18 EDT 2016
             Host Name: bat1
   Current Working Dir: /local/data/bat1/alien/Swift_3rdBATcatalog/event/batevent_reproc/trigger701288
======================================================================

  Trigger: 00701288      Segment: 000

  BAT Trigger Time: 488460437.76   [s; MET]
      Trigger Stop: 488460438.016   [s; MET]
               UTC: 2016-06-24T11:27:01.297540    [includes UTCF correction]
       Where From?: TDRSS position message

  BAT
    RA: 330.202984900918   Dec: 29.6339595166124  [deg; J2000]

     Catalogged Source?: NO
     Point Source?:      YES
     GRB Indicated?:     YES    [ by BAT flight software ]
     Image S/N Ratio:    7.25
     Image Trigger?:     NO
     Rate S/N Ratio:     33.734255586866  [ if not an image trigger ]
     Image S/N Ratio:    7.25

  Analysis Position:   [ source = BAT ]
    RA: 330.202984900918   Dec: 29.6339595166124  [deg; J2000]

  Refined Position:   [ source = BAT pre-slew burst ]
    RA: 330.214472800476   Dec: 29.660699040235  [deg; J2000]
        { 22h 00m 51.5s , +29d 39' 38.5" }
         +/- 2.54128132283097 [arcmin] (estimated 90% radius based on SNR)
         +/- 1.33722199224074 [arcmin] (formal 1-sigma fit error)
    SNR: 8.02549081344798

  Angular difference between the analysis and refined position is 1.712558 arcmin

  Partial Coding Fraction: 1    [ including projection effects ]

  Duration
     T90: 0.191999971866608 +/- 0.143108374017273
        Measured from: 0.0480000376701355
                   to: 0.240000009536743     [s; relative to TRIGTIME]
     T50: 0.12799996137619 +/- 0.0640000104904175
        Measured from: 0.0480000376701355
                   to: 0.175999999046326     [s; relative to TRIGTIME]


  Fluence
     Peak Flux  (peak 1 second)
        Measured from: -0.291999995708466
                   to: 0.708000004291534     [s; relative to TRIGTIME]
     Total Fluence
        Measured from: 0.0480000376701355
                   to: 0.304000020027161     [s; relative to TRIGTIME]

             Band 1     Band 2     Band 3     Band 4
              15-25      25-50     50-100    100-350     keV
 Total     0.011192   0.009114   0.018688   0.013426
           0.002779   0.003323   0.003514   0.003091 [error]
 Peak      0.014954   0.017261   0.027953   0.014006
           0.005403   0.005862   0.005496   0.004869 [error]

     [ fluence units of on-axis counts / fully illuminated detector ]

======================================================================


====== Table of the duration information =============================

        Value   tstart    tstop
T100    0.256    0.048    0.304
T90     0.192    0.048    0.240
T50     0.128    0.048    0.176
Peak    1.000   -0.292    0.708


====== Spectral Analysis Summary =====================================

Model      : spectral model: simple power-law (PL) and cutoff power-law (CPL)
Ph_index   : photon index: E^{Ph_index}
Ph_90err   : 90% error of the photon index
Epeak      : Epeak in keV
Epeak_90err: 90% error of Epeak
Norm       : normalization at 50 keV in both the PL model and CPL model
Nomr_90err : 90% error of the normalization
chi2       : Chi-Squared
dof        : degree of freedo

=== Time-averaged spectral analysis ===
(Best model with acceptable fit: PL)

Model Ph_index Ph_90err_low Ph_90err_hi  Epeak  Epeak_90err_low  Epeak_90err_hi  Norm       Nomr_90err_low    Norm_90err_hi    chi2    dof
PL      -0.333    -0.439      0.533       -           -               -         1.14e-02     -3.34e-03          2.95e-03      60.870   57
CPL     -0.359    -0.408      0.671     9999.360    -9999.360      -9999.360      1.16e-02     -3.44e-03          -1.16e-02      60.930   56


=== 1-s peak spectral analysis ===
(Best model with acceptable fit: PL)

Model Ph_index Ph_90err_low Ph_90err_hi  Epeak  Epeak_90err_low  Epeak_90err_hi  Norm       Nomr_90err_low    Norm_90err_hi    chi2    dof
PL      -0.526     -0.512     0.636       -           -               -         4.31e-03     -1.43e-03          1.24e-03      53.690   57
CPL     -0.545     -0.490     0.671     9999.360    -9999.360      -9999.360      4.38e-03     -1.48e-03          6.16e-03      53.720   56


=== Fluence/Peak Flux Summary ===

              Model    Band1     Band2     Band3     Band4     Band5     Total
                       15-25     25-50    50-100    100-350    15-150    15-350    keV
Fluence         PL   1.27e-09  4.82e-09  1.53e-08  1.58e-07  4.29e-08  1.79e-07   erg/cm2
      90%_error_low -6.98e-10 -1.82e-09 -3.04e-09 -7.07e-08 -9.08e-09 -7.16e-08   erg/cm2
      90%_error_hi   9.18e-10  1.75e-09  3.03e-09  1.20e-07  9.07e-09  1.18e-07   erg/cm2
Peak flux       PL   7.04e-02  1.27e-01  1.77e-01  5.12e-01  5.08e-01  8.86e-01   ph/cm2/s
      90%_error_low -4.33e-02 -5.62e-02 -4.16e-02 -2.47e-01 -1.31e-01 -2.52e-01   ph/cm2/s
      90%_error_hi   5.98e-02  5.44e-02  4.16e-02  4.27e-01  1.32e-01  3.58e-01   ph/cm2/s

Fluence        CPL   1.27e-09  4.83e-09  1.47e-08  1.58e-07  4.20e-08  1.54e-07   erg/cm2
      90%_error_low    N/A    -1.83e-09    N/A       N/A       N/A    -7.42e-08   erg/cm2
      90%_error_hi     N/A     1.74e-09    N/A       N/A       N/A     2.71e-07   erg/cm2
Peak flux      CPL   7.04e-02  1.28e-01  1.77e-01  5.05e-01  5.08e-01  9.33e-01   ph/cm2/s
      90%_error_low     N/A   -5.68e-02     N/A       N/A   -1.31e-01 -5.04e-01   ph/cm2/s
      90%_error_hi      N/A    5.40e-02     N/A       N/A    1.32e-01  5.36e-01   ph/cm2/s

======================================================================
Image
Pre-slew 15.0-350.0 keV image (Event data)
#   RAcent    DECcent   POSerr    Theta     Phi              Peak Cts       SNR   Name
  330.2145    29.6607   0.0240    17.3372     6.3478         0.0507269      8.025 TRIG_00701288

Foreground time interval of the image:
  0.048   0.304 (delta_t =   0.256 [sec])
Background time interval of the image:
-239.760   0.048 (delta_t = 239.808 [sec])
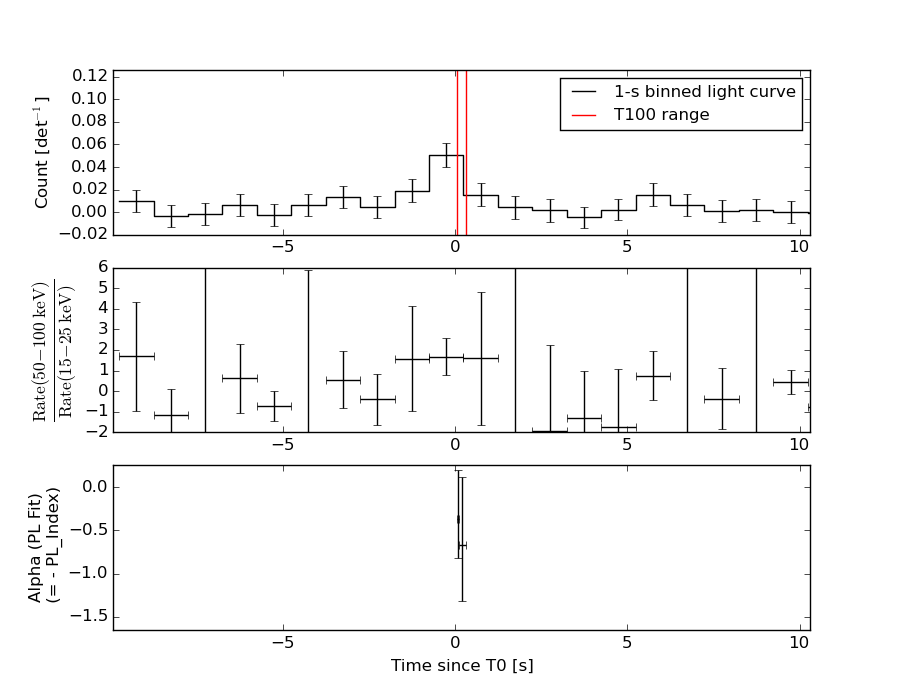
Light Curves
Note: The mask-weighted lightcurves have units of either count/det or counts/sec/det, where a det is 0.4 x 0.4 = 0.16 sq cm.
Full-time range; 1 s binning
Other quick-look light curves:
- 64 ms binning (zoomed)
- 16 ms binning (zoomed)
- 8 ms binning (zoomed)
- 2 ms binning (zoomed)
- SN=5 or 10 s binning (full-time range)
- Raw light curve
Spectra
- 64 ms binning (zoomed)
- 16 ms binning (zoomed)
- 8 ms binning (zoomed)
- 2 ms binning (zoomed)
- SN=5 or 10 s binning (full-time range)
- Raw light curve
Spectra
Notes:
- 1) The fitting includes the systematic errors.
- 2) When the burst includes telescope slew time periods, the fitting uses an average response file made from multiple 5-s response files through out the slew time plus single time preiod for the non-slew times, and weighted by the total counts in the corresponding time period using addrmf. An average response file is needed becuase a spectral fit using the pre-slew DRM will introduce some errors in both a spectral shape and a normalization if the PHA file contains a lot of the slew/post-slew time interval.
- 3) For fits to more complicated models (e.g. a power-law over a cutoff power-law), the BAT team has decided to require a chi-square improvement of more than 6 for each extra dof.
Time averaged spectrum fit using the average DRM
Power-law model
Time interval is from    0.048 sec. to    0.304 sec.

Spectral model in power-law:
------------------------------------------------------------
Parameters  : value       lower 90%   higher 90%
Photon index: -0.333016     ( -0.438676   0.532842 )
Norm@50keV  : 1.14294E-02    ( -0.00334179   0.00294625 )
------------------------------------------------------------
#Fit statistic : Chi-Squared =          60.87 using 59 PHA bins.
# Reduced chi-squared =          1.068 for     57 degrees of freedom
# Null hypothesis probability =   3.383848e-01

Photon flux (15-150 keV)    in 0.256 sec: 1.39897 ( -0.29658  0.29752 ) ph/cm2/s
Energy fluence (15-150 keV)             : 4.29427e-08 ( -9.07858e-09  9.06885e-09 ) ergs/cm2
Cutoff power-law model

Time interval is from    0.048 sec. to    0.304 sec.
Spectral model in the cutoff power-law:
------------------------------------------------------------
Parameters  : value       lower 90%   higher 90%
Photon index: -0.323725     ( -0.408896   0.669975 )
Epeak [keV] : 1.00000E+04      ( -10000 -10000 )
Norm@50keV  : 1.15467E-02    ( -0.00336372   -0.0115466 )
------------------------------------------------------------
#Fit statistic : Chi-Squared =          60.91 using 59 PHA bins.
# Reduced chi-squared =          1.088 for     56 degrees of freedom
# Null hypothesis probability =   3.037590e-01

Photon flux (15-150 keV)    in 0.256 sec: 1.39878 ( -0.29686  0.29697 ) ph/cm2/s
Energy fluence (15-150 keV)             : 4.20311e-08 ( 0  0 ) ergs/cm2
1-s peak spectrum fit
Power-law model
Time interval is from   -0.292 sec. to    0.708 sec.

Spectral model in power-law:
------------------------------------------------------------
Parameters  : value       lower 90%   higher 90%
Photon index: -0.526356     ( -0.512427   0.635841 )
Norm@50keV  : 4.30760E-03    ( -0.00142877   0.00124466 )
------------------------------------------------------------
#Fit statistic : Chi-Squared =          53.69 using 59 PHA bins.
# Reduced chi-squared =         0.9419 for     57 degrees of freedom
# Null hypothesis probability =   6.000976e-01

Photon flux (15-150 keV)    in 1 sec: 0.508025 ( -0.130674  0.132038 ) ph/cm2/s
Energy fluence (15-150 keV)             : 5.71163e-08 ( -1.42269e-08  1.42445e-08 ) ergs/cm2
Cutoff power-law model
Time interval is from   -0.292 sec. to    0.708 sec.
Spectral model in the cutoff power-law:
------------------------------------------------------------
Parameters  : value       lower 90%   higher 90%
Photon index: -0.544691     ( -0.490965   0.670245 )
Epeak [keV] : 9999.36      ( -9999.36 -9999.36 )
Norm@50keV  : 4.38497E-03    ( -0.00147133   0.00616527 )
------------------------------------------------------------
#Fit statistic : Chi-Squared =          53.72 using 59 PHA bins.
# Reduced chi-squared =         0.9592 for     56 degrees of freedom
# Null hypothesis probability =   5.617365e-01

Photon flux (15-150 keV)    in 1 sec: 0.508194 ( -0.131029  0.131624 ) ph/cm2/s
Energy fluence (15-150 keV)             : 5.62108e-08 ( 0  0 ) ergs/cm2
Time-resolved spectra
Distribution
T90 vs. Hardness ratio plot
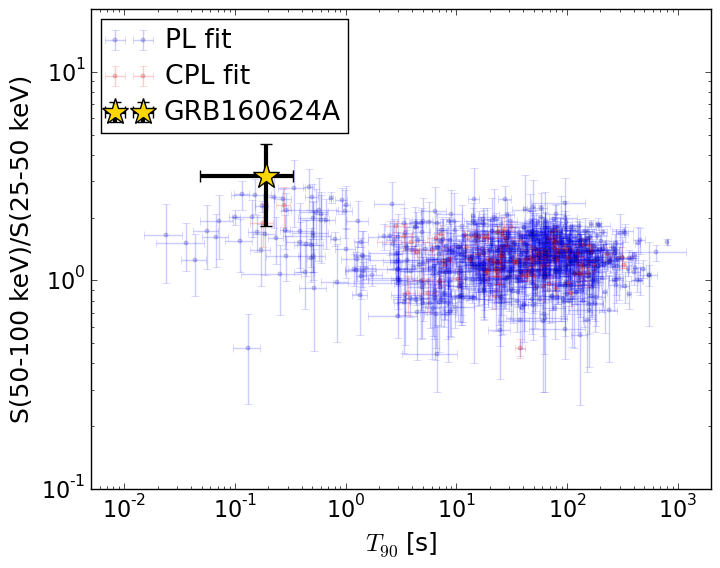
T90                                   = 0.192 sec.
Hardness ratio (energy fluence ratio) = 3.17584897449
S(15-50 keV) vs. S(50-150 keV) plot
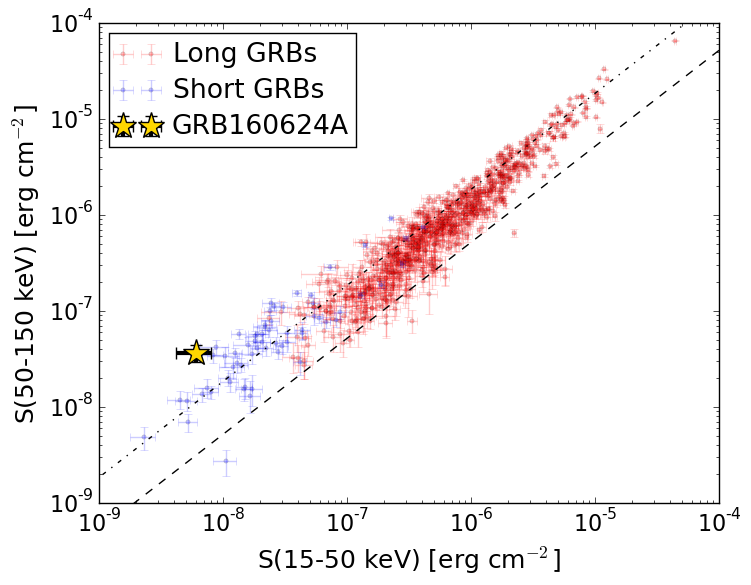
S(15-50 keV)  = 6.084836e-09
S(50-150 keV) = 3.68582e-08
The dash-dotted line and the dashed line traces the fluences calculated from the Band function with Epeak = 15 and 150 keV, respectively. Both lines assume a canonical values of alpha = -1 and beta = -2.5.
Mask shadow pattern
IMX = 3.102636974898729E-01, IMY = -3.451520371752392E-02
Spacecraft aspect plot
Bright source in the pre-burst/pre-slew/post-slew images
Pre-burst image of 15-350 keV band
Time interval of the image:
-239.760000 0.048000

# RAcent  DECcent POSerr Theta    Phi  PeakCts   SNR AngSep     Name
#  [deg]    [deg]    ['] [deg]  [deg]                   [']
254.5587  35.3133    5.0  46.9  157.7   1.2826   2.3    5.2	Her X-1
288.7794  10.9512    3.7  38.9   99.3   2.2755   3.1    1.2	GRS 1915+105
299.5941  35.2002    0.3  14.1  120.5   7.9626  33.9    0.2	Cyg X-1
308.1119  40.9633    1.4   5.5  134.8   1.6448   8.6    0.6	Cyg X-3
326.1218  38.2333    3.0   9.1  -13.1   0.8565   3.9    5.8	Cyg X-2
233.9295  46.6831    2.3  55.6  179.7   4.9092   5.0 ------	UNKNOWN
Pre-slew background subtracted image of 15-350 keV band
Time interval of the image:
0.048000 0.304000

# RAcent  DECcent POSerr Theta    Phi  PeakCts   SNR AngSep     Name
#  [deg]    [deg]    ['] [deg]  [deg]                   [']
254.2589  35.4099    5.3  47.0  158.0   0.0397   2.2   10.5	Her X-1
288.7793  10.9513   13.0  38.9   99.3   0.0233   0.9    1.2	GRS 1915+105
299.4130  35.1064    6.2  14.2  120.5   0.0132   1.9   10.4	Cyg X-1
308.3654  40.9862    5.9   5.3  134.5   0.0117   2.0   11.7	Cyg X-3
326.1965  38.2146   16.9   9.2  -13.2   0.0041   0.7    6.5	Cyg X-2
305.3532  10.8861    2.0  32.5   73.4   0.0708   5.8 ------	UNKNOWN
280.7112  37.8158    2.0  26.7  147.3   0.0434   5.7 ------	UNKNOWN
330.2144  29.6607    1.4  17.3    6.3   0.0507   8.0 ------	UNKNOWN
Post-slew image of 15-350 keV band
Time interval of the image:
57.740600 156.619000
158.240000 602.480000

# RAcent  DECcent POSerr Theta    Phi  PeakCts   SNR AngSep     Name
#  [deg]    [deg]    ['] [deg]  [deg]                   [']
299.5890  35.2129    1.7  26.3  148.3  12.7651   6.8    0.7	Cyg X-1
307.9654  40.9572    3.3  21.3  166.2   5.4877   3.5    6.6	Cyg X-3
326.2224  38.1620    5.6   9.2 -162.0   2.9390   2.1    9.9	Cyg X-2
291.4647  29.5969    2.5  33.5  137.9  10.8948   4.7 ------	UNKNOWN
357.5808  18.3022    3.1  27.4  -33.7   6.1100   3.8 ------	UNKNOWN
  6.9497  73.8184    2.5  48.0 -129.0  30.2045   4.6 ------	UNKNOWN