Analysis Summary
Notes:
- 1) No attempt has been made to eliminate the non-significant decimal places.
- 2) This batgrbproduct analysis is done using the HEASARC data.
- 3) This batgrbproduct analysis is using the flight position for the mask-weighting calculation.
======================================================================
BAT GRB EVENT DATA PROCESSING REPORT
Process Script Ver: batgrbproduct v2.46
Process Start Time: Fri Jul 15 14:18:29 EDT 2016
Host Name: bat1
Current Working Dir: /local/data/bat1/alien/Swift_3rdBATcatalog/event/batevent_reproc/trigger701503
======================================================================
Trigger: 00701503 Segment: 000
BAT Trigger Time: 488587247.936 [s; MET]
Trigger Stop: 488587248.96 [s; MET]
UTC: 2016-06-25T22:40:31.466540 [includes UTCF correction]
Where From?: TDRSS position message
BAT
RA: 176.936915418812 Dec: -65.1138111609725 [deg; J2000]
Catalogged Source?: NO
Point Source?: YES
GRB Indicated?: YES [ by BAT flight software ]
Image S/N Ratio: 8.86
Image Trigger?: NO
Rate S/N Ratio: 15.3622914957372 [ if not an image trigger ]
Image S/N Ratio: 8.86
Analysis Position: [ source = BAT ]
RA: 176.936915418812 Dec: -65.1138111609725 [deg; J2000]
Refined Position: [ source = BAT pre-slew burst ]
RA: 176.938977169425 Dec: -65.1419065043362 [deg; J2000]
{ 11h 47m 45.4s , -65d 08' 30.9" }
+/- 0.798197129754722 [arcmin] (estimated 90% radius based on SNR)
+/- 0.195796794885138 [arcmin] (formal 1-sigma fit error)
SNR: 41.9721296814664
Angular difference between the analysis and refined position is 1.686523 arcmin
Partial Coding Fraction: 0.5703125 [ including projection effects ]
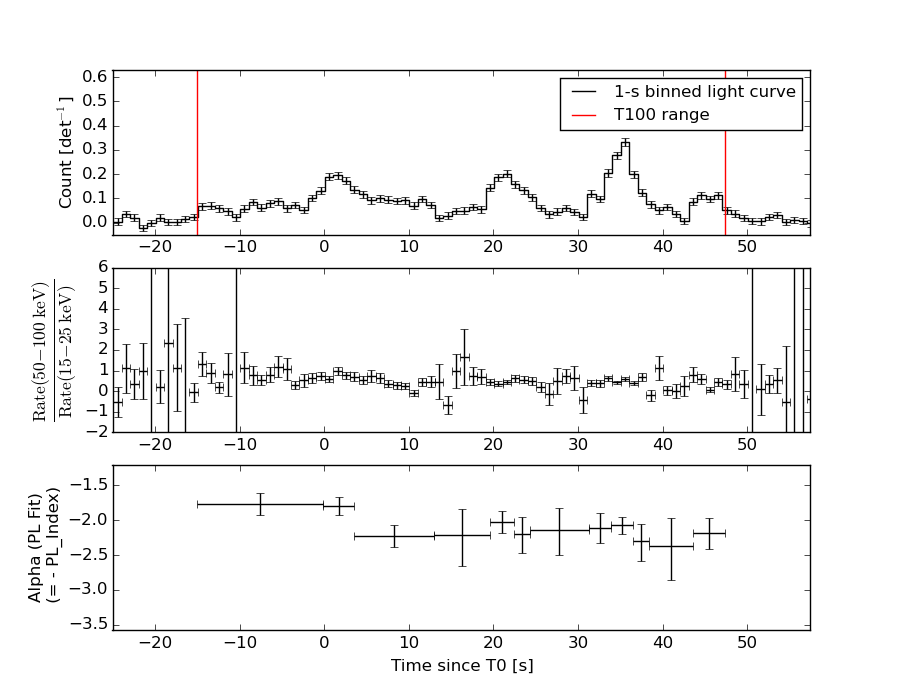
Duration
T90: 53.9199999570847 +/- 3.0991353106272
Measured from: -9.33200001716614
to: 44.5879999399185 [s; relative to TRIGTIME]
T50: 31.9519999027252 +/- 0.792131237689915
Measured from: 2.45600003004074
to: 34.407999932766 [s; relative to TRIGTIME]
Fluence
Peak Flux (peak 1 second)
Measured from: 35.0720000267029
to: 36.0720000267029 [s; relative to TRIGTIME]
Total Fluence
Measured from: -15.0360000133514
to: 47.4120000004768 [s; relative to TRIGTIME]
Band 1 Band 2 Band 3 Band 4
15-25 25-50 50-100 100-350 keV
Total 2.276958 2.376192 1.161156 0.254559
0.060521 0.062318 0.053674 0.045919 [error]
Peak 0.116273 0.134631 0.070410 0.016241
0.009058 0.009409 0.007885 0.005802 [error]
[ fluence units of on-axis counts / fully illuminated detector ]
======================================================================
====== Table of the duration information =============================
Value tstart tstop
T100 62.448 -15.036 47.412
T90 53.920 -9.332 44.588
T50 31.952 2.456 34.408
Peak 1.000 35.072 36.072
====== Spectral Analysis Summary =====================================
Model : spectral model: simple power-law (PL) and cutoff power-law (CPL)
Ph_index : photon index: E^{Ph_index}
Ph_90err : 90% error of the photon index
Epeak : Epeak in keV
Epeak_90err: 90% error of Epeak
Norm : normalization at 50 keV in both the PL model and CPL model
Nomr_90err : 90% error of the normalization
chi2 : Chi-Squared
dof : degree of freedo
=== Time-averaged spectral analysis ===
(Best model with acceptable fit: PL)
Model Ph_index Ph_90err_low Ph_90err_hi Epeak Epeak_90err_low Epeak_90err_hi Norm Nomr_90err_low Norm_90err_hi chi2 dof
PL -2.086 -0.075 0.074 - - - 5.70e-03 -2.35e-04 2.33e-04 37.660 57
CPL -1.917 -0.175 0.309 22.709 -20.968 27.225 7.01e-03 N/A N/A 36.670 56
=== 1-s peak spectral analysis ===
(Best model with acceptable fit: PL)
Model Ph_index Ph_90err_low Ph_90err_hi Epeak Epeak_90err_low Epeak_90err_hi Norm Nomr_90err_low Norm_90err_hi chi2 dof
PL -1.970 -0.151 0.146 - - - 2.03e-02 -1.97e-03 1.94e-03 53.890 57
CPL -1.633 -0.552 0.639 47.654 N/A N/A 3.14e-02 N/A N/A 52.850 56
=== Fluence/Peak Flux Summary ===
Model Band1 Band2 Band3 Band4 Band5 Total
15-25 25-50 50-100 100-350 15-150 15-350 keV
Fluence PL 7.91e-07 1.02e-06 9.60e-07 1.60e-06 3.31e-06 4.37e-06 erg/cm2
90%_error_low -4.84e-08 -3.68e-08 -5.55e-08 -1.88e-07 -1.26e-07 -2.37e-07 erg/cm2
90%_error_hi 4.95e-08 3.68e-08 5.57e-08 2.05e-07 1.26e-07 2.48e-07 erg/cm2
Peak flux PL 1.31e+00 1.00e+00 5.12e-01 3.75e-01 3.00e+00 3.20e+00 ph/cm2/s
90%_error_low -1.58e-01 -8.14e-02 -6.48e-02 -8.45e-02 -2.47e-01 -2.60e-01 ph/cm2/s
90%_error_hi 1.63e-01 8.14e-02 6.49e-02 9.80e-02 2.47e-01 2.60e-01 ph/cm2/s
Fluence CPL N/A N/A N/A N/A N/A N/A erg/cm2
90%_error_low -4.84e-08 -3.68e-08 -5.55e-08 -1.88e-07 -1.26e-07 -2.37e-07 erg/cm2
90%_error_hi 4.95e-08 3.68e-08 5.57e-08 2.05e-07 1.26e-07 2.48e-07 erg/cm2
Peak flux CPL 1.27e+00 1.04e+00 5.15e-01 2.39e-01 2.97e+00 3.06e+00 ph/cm2/s
90%_error_low -1.79e-01 -1.04e-01 -6.91e-02 -1.28e-01 -2.54e-01 -2.95e-01 ph/cm2/s
90%_error_hi 1.81e-01 1.08e-01 6.90e-02 1.71e-01 2.54e-01 3.50e-01 ph/cm2/s
======================================================================
Image
Pre-slew 15.0-350.0 keV image (Event data)
#   RAcent    DECcent   POSerr    Theta     Phi              Peak Cts       SNR   Name
  176.9390   -65.1419   0.0046    32.6557    26.2261         6.2026132     41.972 TRIG_00701503

Foreground time interval of the image:
-15.036  47.412 (delta_t =  62.448 [sec])
Background time interval of the image:
-223.635 -15.036 (delta_t = 208.599 [sec])
Light Curves
Note: The mask-weighted lightcurves have units of either count/det or counts/sec/det, where a det is 0.4 x 0.4 = 0.16 sq cm.
Full-time range; 1 s binning
Other quick-look light curves:
- 64 ms binning (zoomed)
- 16 ms binning (zoomed)
- 8 ms binning (zoomed)
- 2 ms binning (zoomed)
- SN=5 or 10 s binning (full-time range)
- Raw light curve
Spectra
- 64 ms binning (zoomed)
- 16 ms binning (zoomed)
- 8 ms binning (zoomed)
- 2 ms binning (zoomed)
- SN=5 or 10 s binning (full-time range)
- Raw light curve
Spectra
Notes:
- 1) The fitting includes the systematic errors.
- 2) When the burst includes telescope slew time periods, the fitting uses an average response file made from multiple 5-s response files through out the slew time plus single time preiod for the non-slew times, and weighted by the total counts in the corresponding time period using addrmf. An average response file is needed becuase a spectral fit using the pre-slew DRM will introduce some errors in both a spectral shape and a normalization if the PHA file contains a lot of the slew/post-slew time interval.
- 3) For fits to more complicated models (e.g. a power-law over a cutoff power-law), the BAT team has decided to require a chi-square improvement of more than 6 for each extra dof.
Time averaged spectrum fit using the average DRM
Power-law model
Time interval is from  -15.036 sec. to   47.412 sec.

Spectral model in power-law:
------------------------------------------------------------
Parameters  : value       lower 90%   higher 90%
Photon index: -2.08572     ( -0.0749813   0.0738729 )
Norm@50keV  : 5.70478E-03    ( -0.000234604   0.000232899 )
------------------------------------------------------------
#Fit statistic : Chi-Squared =          37.66 using 59 PHA bins.
# Reduced chi-squared =         0.6607 for     57 degrees of freedom
# Null hypothesis probability =   9.775503e-01

Photon flux (15-150 keV)    in 62.45 sec: 0.891310 ( -0.034842  0.034995 ) ph/cm2/s
Energy fluence (15-150 keV)             : 3.30623e-06 ( -1.25676e-07  1.26208e-07 ) ergs/cm2
Cutoff power-law model
Time interval is from  -15.036 sec. to   47.412 sec.
Spectral model in the cutoff power-law:
------------------------------------------------------------
Parameters  : value       lower 90%   higher 90%
Photon index: -1.91665     ( -0.17478   0.308917 )
Epeak [keV] : 22.7086      ( -20.9684 27.2246 )
Norm@50keV  : 7.00540E-03    (     )
------------------------------------------------------------
#Fit statistic : Chi-Squared =          36.67 using 59 PHA bins.
# Reduced chi-squared =         0.6548 for     56 degrees of freedom
# Null hypothesis probability =   9.787289e-01

Photon flux (15-150 keV)    in 62.45 sec: 0.879768 ( -0.039735  0.037141 ) ph/cm2/s
Energy fluence (15-150 keV)             : 0 ( 0  0 ) ergs/cm2
1-s peak spectrum fit
Power-law model
Time interval is from   35.072 sec. to   36.072 sec.

Spectral model in power-law:
------------------------------------------------------------
Parameters  : value       lower 90%   higher 90%
Photon index: -1.97037     ( -0.151224   0.145685 )
Norm@50keV  : 2.02823E-02    ( -0.00197016   0.00193653 )
------------------------------------------------------------
#Fit statistic : Chi-Squared =          53.89 using 59 PHA bins.
# Reduced chi-squared =         0.9455 for     57 degrees of freedom
# Null hypothesis probability =   5.923430e-01

Photon flux (15-150 keV)    in 1 sec: 3.00186 ( -0.24693  0.24711 ) ph/cm2/s
Energy fluence (15-150 keV)             : 1.86819e-07 ( -1.72994e-08  1.74865e-08 ) ergs/cm2
Cutoff power-law model

Time interval is from   35.072 sec. to   36.072 sec.
Spectral model in the cutoff power-law:
------------------------------------------------------------
Parameters  : value       lower 90%   higher 90%
Photon index: -1.63316     ( -0.55225   0.638772 )
Epeak [keV] : 47.6538      (   )
Norm@50keV  : 3.13839E-02    (     )
------------------------------------------------------------
#Fit statistic : Chi-Squared =          52.85 using 59 PHA bins.
# Reduced chi-squared =         0.9437 for     56 degrees of freedom
# Null hypothesis probability =   5.949192e-01

Photon flux (15-150 keV)    in 1 sec: 2.96580 ( -0.25431  0.25412 ) ph/cm2/s
Energy fluence (15-150 keV)             : 0 ( 0  0 ) ergs/cm2
Time-resolved spectra
Distribution
T90 vs. Hardness ratio plot
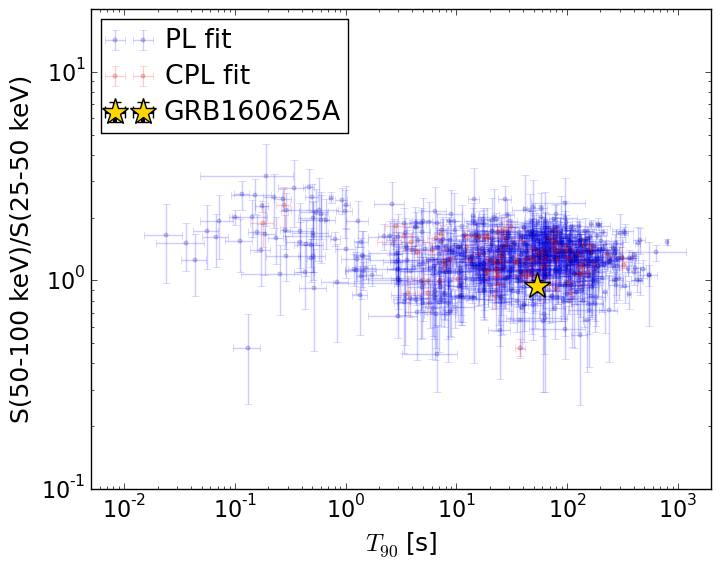
T90                                   = 53.92 sec.
Hardness ratio (energy fluence ratio) = 0.942344944792
S(15-50 keV) vs. S(50-150 keV) plot
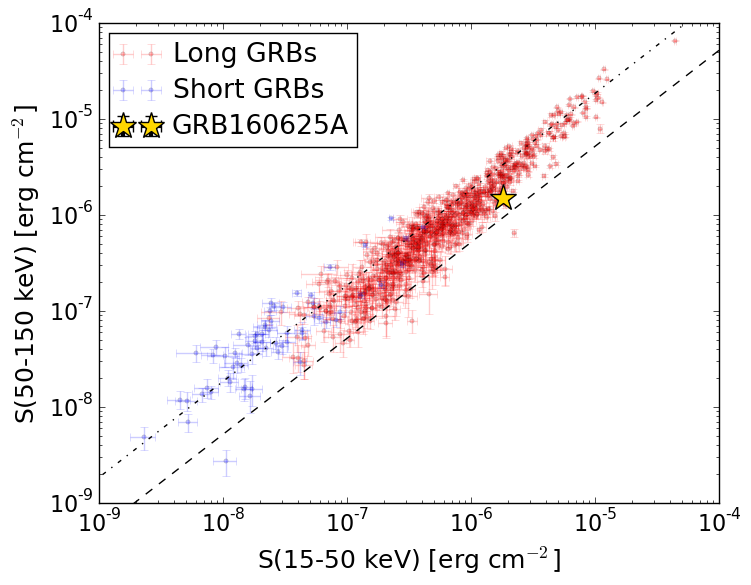
S(15-50 keV)  = 1.8100019e-06
S(50-150 keV) = 1.4962523e-06
The dash-dotted line and the dashed line traces the fluences calculated from the Band function with Epeak = 15 and 150 keV, respectively. Both lines assume a canonical values of alpha = -1 and beta = -2.5.
Mask shadow pattern
IMX = 5.749219583029950E-01, IMY = -2.832223970030819E-01
Spacecraft aspect plot
Bright source in the pre-burst/pre-slew/post-slew images
Pre-burst image of 15-350 keV band
Time interval of the image:
-223.635410 -15.036000

# RAcent  DECcent POSerr Theta    Phi  PeakCts   SNR AngSep     Name
#  [deg]    [deg]    ['] [deg]  [deg]                   [']
135.6279 -40.5209    4.4  39.0  -32.7   0.7680   2.6    5.0	Vela X-1
170.5794 -60.6355    6.4  34.2   16.9   0.4394   1.8    7.8	Cen X-3
186.6440 -62.7894    3.7  37.1   29.6   0.9524   3.1    1.2	GX 301-2
 38.3719 -29.7494    2.7  47.4 -160.9   1.6146   4.2 ------	UNKNOWN
 37.1204 -21.0731    3.2  55.9 -158.6   3.4513   3.6 ------	UNKNOWN
Pre-slew background subtracted image of 15-350 keV band
Time interval of the image:
-15.036000 47.412000

# RAcent  DECcent POSerr Theta    Phi  PeakCts   SNR AngSep     Name
#  [deg]    [deg]    ['] [deg]  [deg]                   [']
135.5975 -40.3913    0.0  39.2  -32.8  -0.1867  -1.2   10.3	Vela X-1
170.6001 -60.6056    7.7  34.3   16.9  -0.2163  -1.5    8.4	Cen X-3
186.5725 -62.7819    7.5  37.1   29.5  -0.2734  -1.5    2.4	GX 301-2
298.8094 -68.0625    2.4  40.7   96.2   2.2284   4.7 ------	UNKNOWN
184.5102 -47.8549    2.0  49.3   16.7   1.6375   5.8 ------	UNKNOWN
176.9390 -65.1419    0.3  32.7   26.2   6.2028  42.0 ------	UNKNOWN
 16.5637 -45.1538    2.6  40.8  167.0   0.8387   4.5 ------	UNKNOWN
101.1241 -66.0845    2.8   7.0  -31.1   0.4001   4.1 ------	UNKNOWN
Post-slew image of 15-350 keV band
Time interval of the image: