Analysis Summary
Notes:
- 1) No attempt has been made to eliminate the non-significant decimal places.
- 2) This batgrbproduct analysis is done using the HEASARC data.
- 3) This batgrbproduct analysis is using the flight position for the mask-weighting calculation.
======================================================================
                  BAT GRB EVENT DATA PROCESSING REPORT
    Process Script Ver: batgrbproduct v2.46
    Process Start Time: Mon Aug 22 15:47:10 EDT 2016
             Host Name: bat1
   Current Working Dir: /local/data/bat1/alien/Swift_3rdBATcatalog/event/batevent_reproc/trigger706871
======================================================================

  Trigger: 00706871      Segment: 000

  BAT Trigger Time: 491736527.168   [s; MET]
      Trigger Stop: 491736528.192   [s; MET]
               UTC: 2016-08-01T09:28:30.522860    [includes UTCF correction]
       Where From?: TDRSS position message

  BAT
    RA: 212.762767149869   Dec: 13.4995972351227  [deg; J2000]

     Catalogged Source?: NO
     Point Source?:      YES
     GRB Indicated?:     YES    [ by BAT flight software ]
     Image S/N Ratio:    9.93
     Image Trigger?:     NO
     Rate S/N Ratio:     14.9666295470958  [ if not an image trigger ]
     Image S/N Ratio:    9.93

  Analysis Position:   [ source = BAT ]
    RA: 212.762767149869   Dec: 13.4995972351227  [deg; J2000]

  Refined Position:   [ source = BAT pre-slew burst ]
    RA: 212.766318588363   Dec: 13.4827014060536  [deg; J2000]
        { 14h 11m 03.9s , +13d 28' 57.7" }
         +/- 1.76389699310403 [arcmin] (estimated 90% radius based on SNR)
         +/- 0.842572315625893 [arcmin] (formal 1-sigma fit error)
    SNR: 13.521154650618

  Angular difference between the analysis and refined position is 1.034709 arcmin

  Partial Coding Fraction: 0.734375    [ including projection effects ]

  Duration
     T90: 2.85199993848801 +/- 0.415427463220295
        Measured from: -1.16799998283386
                   to: 1.68399995565414     [s; relative to TRIGTIME]
     T50: 1.31599998474121 +/- 0.404949358277075
        Measured from: -0.379999995231628
                   to: 0.935999989509583     [s; relative to TRIGTIME]


  Fluence
     Peak Flux  (peak 1 second)
        Measured from: -0.0239999890327454
                   to: 0.976000010967255     [s; relative to TRIGTIME]
     Total Fluence
        Measured from: -1.34399998188019
                   to: 1.82800000905991     [s; relative to TRIGTIME]

             Band 1     Band 2     Band 3     Band 4
              15-25      25-50     50-100    100-350     keV
 Total     0.105874   0.130221   0.072628   0.015817
           0.012955   0.013797   0.011681   0.009278 [error]
 Peak      0.046616   0.069362   0.022037   0.001191
           0.007376   0.007980   0.006466   0.004885 [error]

     [ fluence units of on-axis counts / fully illuminated detector ]

======================================================================


====== Table of the duration information =============================

        Value   tstart    tstop
T100    3.172   -1.344    1.828
T90     2.852   -1.168    1.684
T50     1.316   -0.380    0.936
Peak    1.000   -0.024    0.976


====== Spectral Analysis Summary =====================================

Model      : spectral model: simple power-law (PL) and cutoff power-law (CPL)
Ph_index   : photon index: E^{Ph_index}
Ph_90err   : 90% error of the photon index
Epeak      : Epeak in keV
Epeak_90err: 90% error of Epeak
Norm       : normalization at 50 keV in both the PL model and CPL model
Nomr_90err : 90% error of the normalization
chi2       : Chi-Squared
dof        : degree of freedo

=== Time-averaged spectral analysis ===
(Best model with acceptable fit: N/A)

Model Ph_index Ph_90err_low Ph_90err_hi  Epeak  Epeak_90err_low  Epeak_90err_hi  Norm       Nomr_90err_low    Norm_90err_hi    chi2    dof
PL      -1.848    -0.225      0.213       -           -               -         5.98e-03     -8.90e-04          8.69e-04      56.840   57
CPL     -1.002    -0.912      1.136       51.310     -14.244       -51.310      1.79e-02     -1.79e-02          6.09e-02      54.390   56


=== 1-s peak spectral analysis ===
(Best model with acceptable fit: N/A)

Model Ph_index Ph_90err_low Ph_90err_hi  Epeak  Epeak_90err_low  Epeak_90err_hi  Norm       Nomr_90err_low    Norm_90err_hi    chi2    dof
PL      -1.975     -0.268     0.247       -           -               -         7.92e-03     -1.55e-03          1.52e-03      68.930   57
CPL      0.826     -1.581     2.341       39.614      -5.907         8.067      3.75e-01     -3.75e-01          1.02e+01      57.880   56


=== Fluence/Peak Flux Summary ===

              Model    Band1     Band2     Band3     Band4     Band5     Total
                       15-25     25-50    50-100    100-350    15-150    15-350    keV
Fluence         PL   3.36e-08  5.00e-08  5.55e-08  1.16e-07  1.74e-07  2.56e-07   erg/cm2
      90%_error_low -5.88e-09 -6.22e-09 -1.09e-08 -4.00e-08 -2.57e-08 -5.29e-08   erg/cm2
      90%_error_hi   6.05e-09  6.22e-09  1.11e-08  5.13e-08  2.61e-08  6.18e-08   erg/cm2
Peak flux       PL   5.16e-01  3.92e-01  1.99e-01  1.46e-01  1.17e+00  1.25e+00   ph/cm2/s
      90%_error_low -1.05e-01 -6.23e-02 -4.86e-02 -5.66e-02 -1.86e-01 -2.01e-01   ph/cm2/s
      90%_error_hi   1.09e-01  6.23e-02  4.97e-02  7.36e-02  1.86e-01  2.02e-01   ph/cm2/s

Fluence        CPL   3.10e-08  5.56e-08  5.51e-08  3.32e-08  1.62e-07  1.75e-07   erg/cm2
      90%_error_low -6.75e-09 -8.10e-09 -1.31e-08 -2.42e-08 -2.72e-08 -3.73e-08   erg/cm2
      90%_error_hi   6.75e-09  8.99e-09  1.25e-08  9.61e-08  2.89e-08  9.87e-08   erg/cm2
Peak flux      CPL   4.20e-01  5.35e-01  1.73e-01  8.11e-03  1.14e+00  1.14e+00   ph/cm2/s
      90%_error_low -1.22e-01 -9.81e-02 -7.27e-02 -8.11e-03 -1.83e-01 -1.83e-01   ph/cm2/s
      90%_error_hi   1.25e-01  1.02e-01  6.94e-02  3.17e-02  1.84e-01  1.85e-01   ph/cm2/s

======================================================================
Image
Pre-slew 15.0-350.0 keV image (Event data)
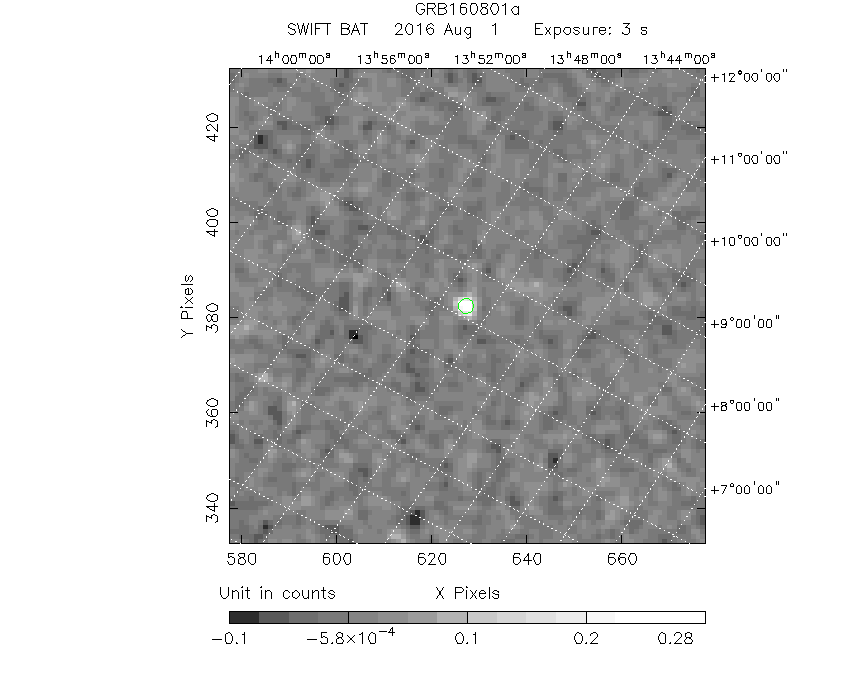
#   RAcent    DECcent   POSerr    Theta     Phi              Peak Cts       SNR   Name
  212.7663    13.4827   0.0143    29.5146    20.4480         0.3242621     13.521 TRIG_00706871

Foreground time interval of the image:
 -1.344   1.828 (delta_t =   3.172 [sec])
Background time interval of the image:
-239.168  -1.344 (delta_t = 237.824 [sec])
Light Curves
Note: The mask-weighted lightcurves have units of either count/det or counts/sec/det, where a det is 0.4 x 0.4 = 0.16 sq cm.
Full-time range; 1 s binning
Other quick-look light curves:
- 64 ms binning (zoomed)
- 16 ms binning (zoomed)
- 8 ms binning (zoomed)
- 2 ms binning (zoomed)
- SN=5 or 10 s binning (full-time range)
- Raw light curve
Spectra
- 64 ms binning (zoomed)
- 16 ms binning (zoomed)
- 8 ms binning (zoomed)
- 2 ms binning (zoomed)
- SN=5 or 10 s binning (full-time range)
- Raw light curve
Spectra
Notes:
- 1) The fitting includes the systematic errors.
- 2) When the burst includes telescope slew time periods, the fitting uses an average response file made from multiple 5-s response files through out the slew time plus single time preiod for the non-slew times, and weighted by the total counts in the corresponding time period using addrmf. An average response file is needed becuase a spectral fit using the pre-slew DRM will introduce some errors in both a spectral shape and a normalization if the PHA file contains a lot of the slew/post-slew time interval.
- 3) For fits to more complicated models (e.g. a power-law over a cutoff power-law), the BAT team has decided to require a chi-square improvement of more than 6 for each extra dof.
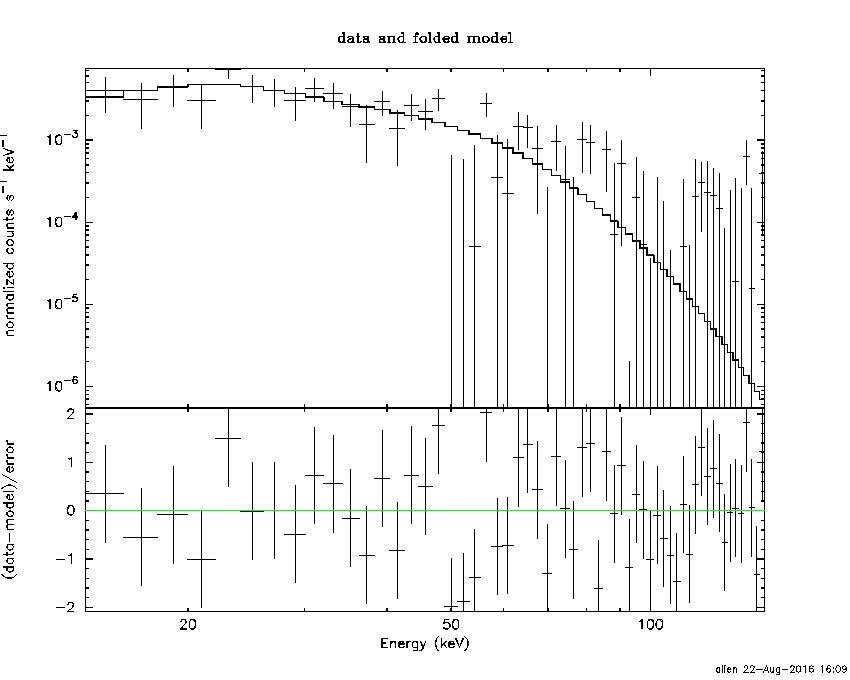
Time averaged spectrum fit using the average DRM
Power-law model
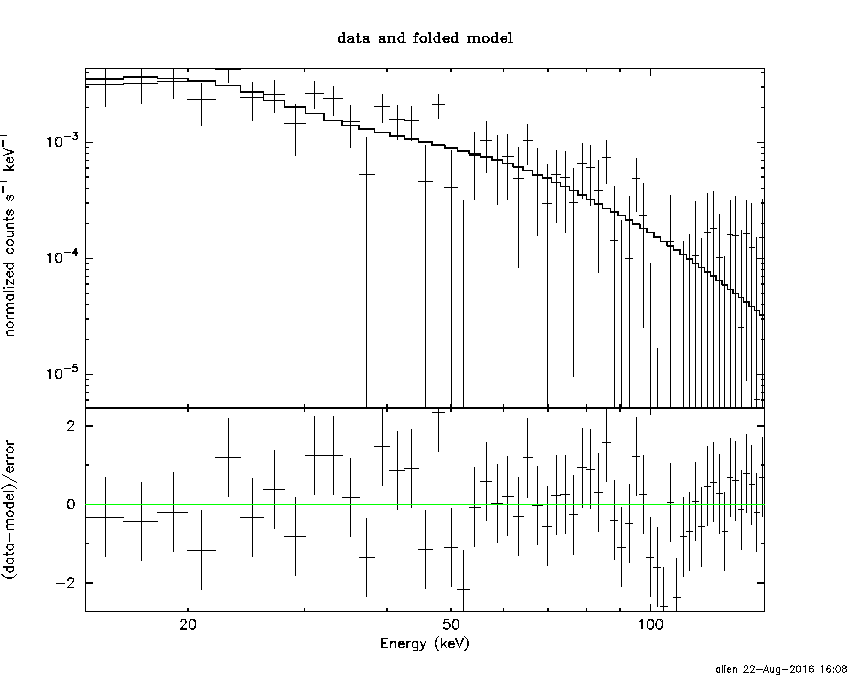
Time interval is from   -1.344 sec. to    1.828 sec.

Spectral model in power-law:
------------------------------------------------------------
Parameters  : value       lower 90%   higher 90%
Photon index: -1.84845     ( -0.225326   0.212989 )
Norm@50keV  : 5.97874E-03    ( -0.000889968   0.000869387 )
------------------------------------------------------------
#Fit statistic : Chi-Squared =          56.84 using 59 PHA bins.
# Reduced chi-squared =         0.9971 for     57 degrees of freedom
# Null hypothesis probability =   4.812263e-01

Photon flux (15-150 keV)    in 3.172 sec: 0.839892 ( -0.104718  0.104742 ) ph/cm2/s
Energy fluence (15-150 keV)             : 1.74407e-07 ( -2.56512e-08  2.61297e-08 ) ergs/cm2
Cutoff power-law model
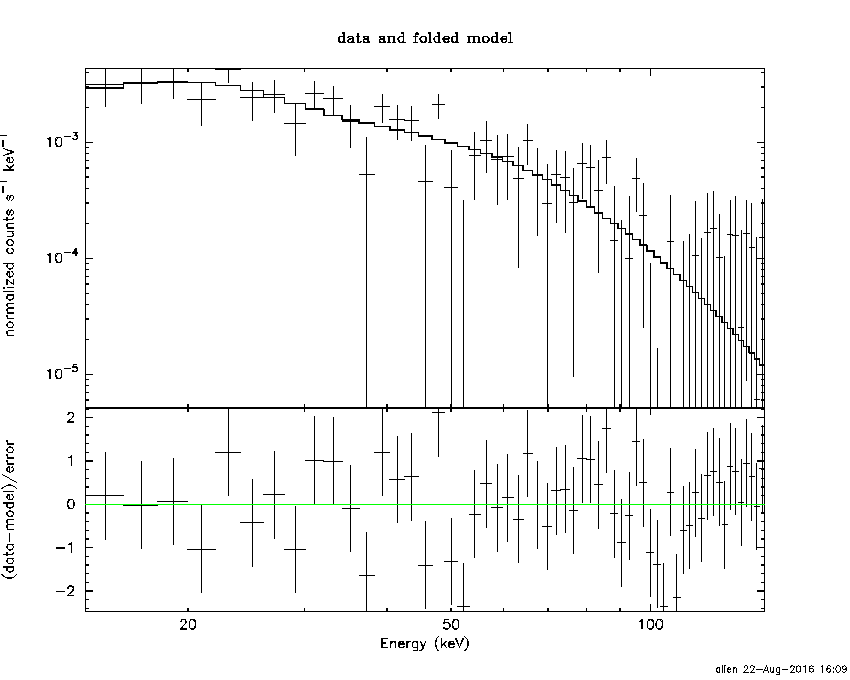
Time interval is from   -1.344 sec. to    1.828 sec.
Spectral model in the cutoff power-law:
------------------------------------------------------------
Parameters  : value       lower 90%   higher 90%
Photon index: -1.00238     ( -0.912072   1.13633 )
Epeak [keV] : 51.3105      ( -14.2445 -51.3105 )
Norm@50keV  : 1.79401E-02    ( -0.0179401   0.0608771 )
------------------------------------------------------------
#Fit statistic : Chi-Squared =          54.39 using 59 PHA bins.
# Reduced chi-squared =         0.9712 for     56 degrees of freedom
# Null hypothesis probability =   5.361500e-01

Photon flux (15-150 keV)    in 3.172 sec: 0.819013 ( -0.107099  0.107156 ) ph/cm2/s
Energy fluence (15-150 keV)             : 1.62485e-07 ( -2.72457e-08  2.8867e-08 ) ergs/cm2
1-s peak spectrum fit
Power-law model
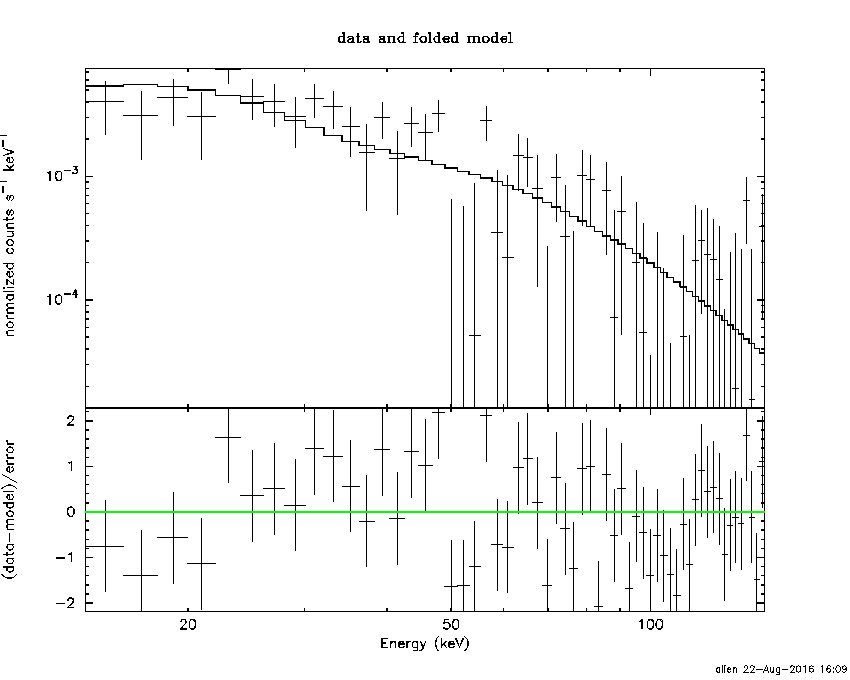
Time interval is from   -0.024 sec. to    0.976 sec.

Spectral model in power-law:
------------------------------------------------------------
Parameters  : value       lower 90%   higher 90%
Photon index: -1.97547     ( -0.267695   0.247858 )
Norm@50keV  : 7.91713E-03    ( -0.00155086   0.00151982 )
------------------------------------------------------------
#Fit statistic : Chi-Squared =          68.93 using 59 PHA bins.
# Reduced chi-squared =          1.209 for     57 degrees of freedom
# Null hypothesis probability =   1.336120e-01

Photon flux (15-150 keV)    in 1 sec: 1.17446 ( -0.185841  0.18585 ) ph/cm2/s
Energy fluence (15-150 keV)             : 7.2929e-08 ( -1.35094e-08  1.38391e-08 ) ergs/cm2
Cutoff power-law model
Time interval is from   -0.024 sec. to    0.976 sec.
Spectral model in the cutoff power-law:
------------------------------------------------------------
Parameters  : value       lower 90%   higher 90%
Photon index: 0.826273     ( -1.59634   2.32607 )
Epeak [keV] : 39.6142      ( -5.87684 8.09673 )
Norm@50keV  : 0.375409    ( -0.388101   10.1983 )
------------------------------------------------------------
#Fit statistic : Chi-Squared =          57.88 using 59 PHA bins.
# Reduced chi-squared =          1.034 for     56 degrees of freedom
# Null hypothesis probability =   4.057696e-01

Photon flux (15-150 keV)    in 1 sec: 1.13600 ( -0.182935  0.18398 ) ph/cm2/s
Energy fluence (15-150 keV)             : 6.25331e-08 ( -1.16176e-08  1.29448e-08 ) ergs/cm2
Time-resolved spectra
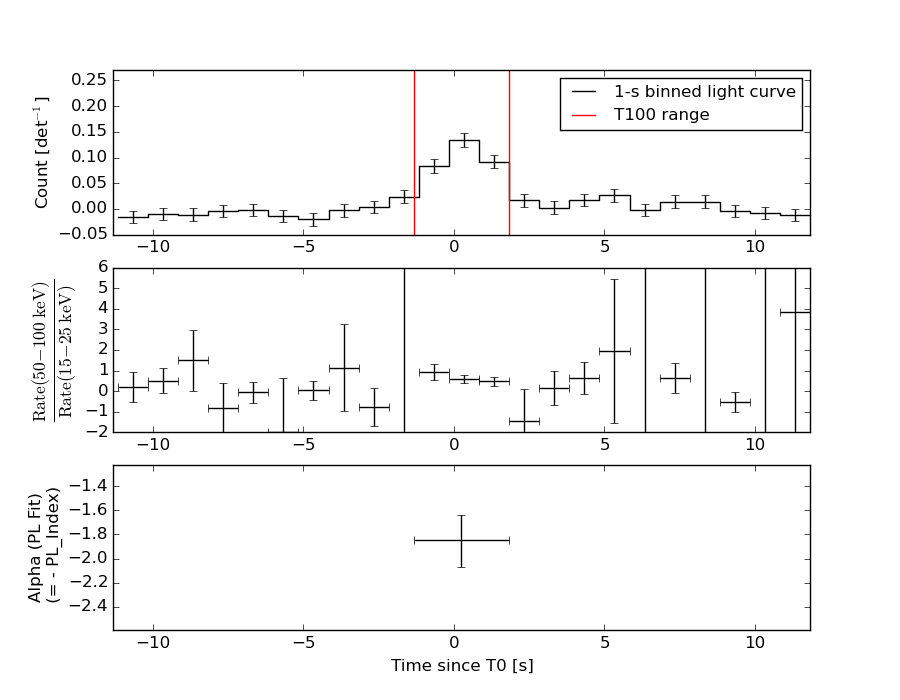
Distribution
T90 vs. Hardness ratio plot
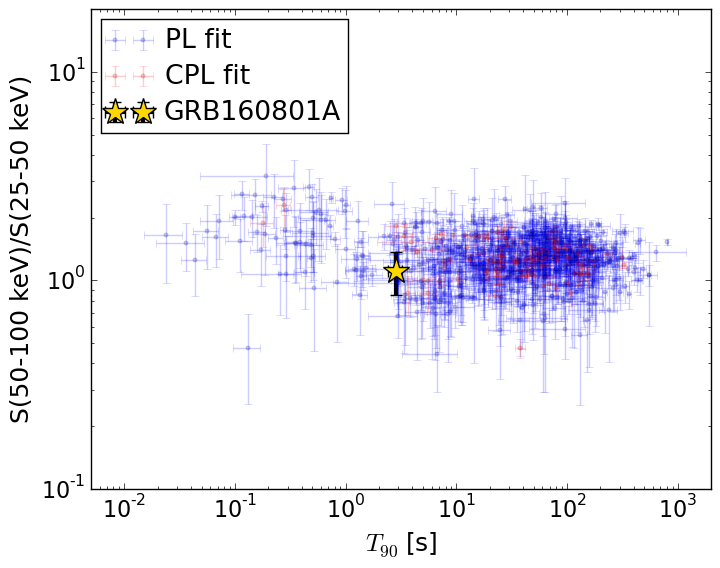
T90                                   = 2.852 sec.
Hardness ratio (energy fluence ratio) = 1.11083685644
S(15-50 keV) vs. S(50-150 keV) plot
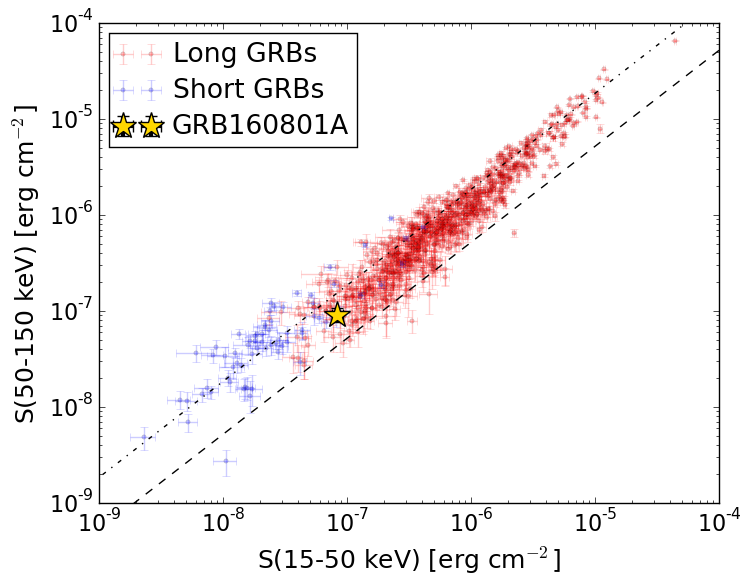
S(15-50 keV)  = 8.360158e-08
S(50-150 keV) = 9.080783e-08
The dash-dotted line and the dashed line traces the fluences calculated from the Band function with Epeak = 15 and 150 keV, respectively. Both lines assume a canonical values of alpha = -1 and beta = -2.5.
Mask shadow pattern
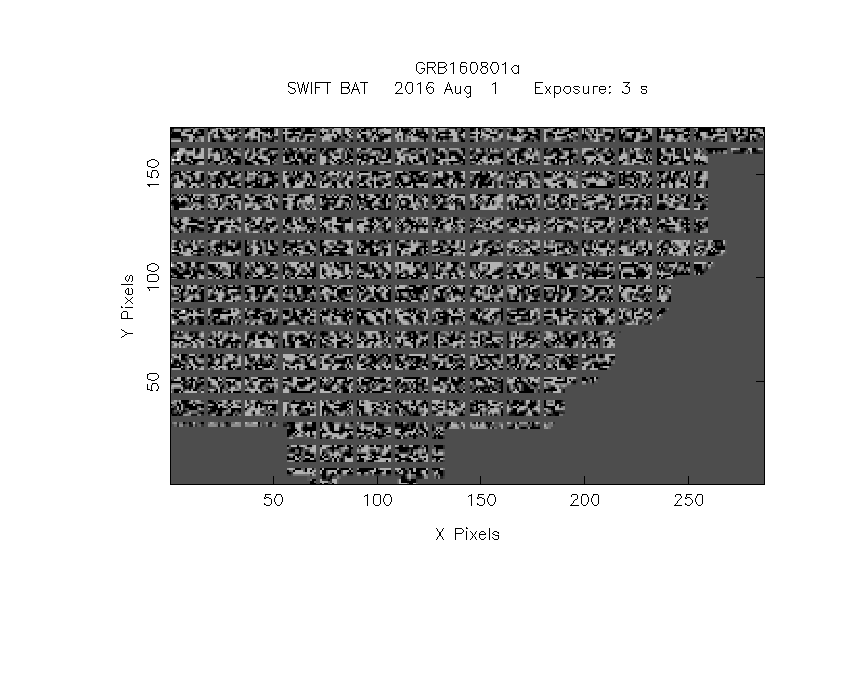
IMX = 5.304375290009572E-01, IMY = -1.977738262508182E-01
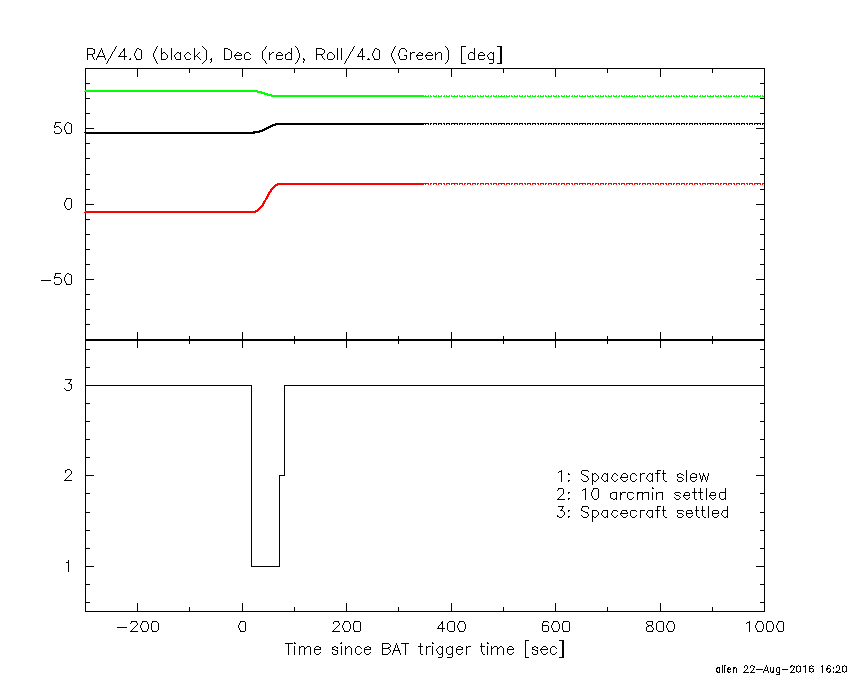
Spacecraft aspect plot
Bright source in the pre-burst/pre-slew/post-slew images
Pre-burst image of 15-350 keV band
Time interval of the image:
-239.168000 -1.344000

# RAcent  DECcent POSerr Theta    Phi  PeakCts   SNR AngSep     Name
#  [deg]    [deg]    ['] [deg]  [deg]                   [']
190.3568  51.3698    3.3  56.7  -29.4   4.3402   3.5 ------	UNKNOWN
Pre-slew background subtracted image of 15-350 keV band
Time interval of the image:
-1.344000 1.828000

# RAcent  DECcent POSerr Theta    Phi  PeakCts   SNR AngSep     Name
#  [deg]    [deg]    ['] [deg]  [deg]                   [']
200.5935 -52.3936    2.3  47.9  141.4   0.4645   5.0 ------	UNKNOWN
212.7663  13.4827    0.9  29.5   20.4   0.3242  13.5 ------	UNKNOWN
161.9596  28.2060    2.0  43.0  -67.0   0.4823   5.7 ------	UNKNOWN
Post-slew image of 15-350 keV band
Time interval of the image:
70.732600 962.965800

# RAcent  DECcent POSerr Theta    Phi  PeakCts   SNR AngSep     Name
#  [deg]    [deg]    ['] [deg]  [deg]                   [']
254.4988  35.4358    5.8  43.4   36.7   2.4963   2.0    6.0	Her X-1
239.9673  46.1150    2.8  39.8   14.2   3.2228   4.1 ------	UNKNOWN
212.0583 -25.6334    2.3  39.2  165.5   4.9441   5.0 ------	UNKNOWN
230.0749  43.5438    3.2  33.5    7.6   2.4277   3.7 ------	UNKNOWN
171.8633  12.9199    3.6  39.8 -101.4   7.5550   3.2 ------	UNKNOWN