Analysis Summary
Notes:
- 1) No attempt has been made to eliminate the non-significant decimal places.
- 2) This batgrbproduct analysis is done using the HEASARC data.
- 3) This batgrbproduct analysis is using the flight position for the mask-weighting calculation.
======================================================================
                  BAT GRB EVENT DATA PROCESSING REPORT
    Process Script Ver: batgrbproduct v2.46
    Process Start Time: Mon Aug 22 15:44:13 EDT 2016
             Host Name: bat1
   Current Working Dir: /local/data/bat1/alien/Swift_3rdBATcatalog/event/batevent_reproc/trigger707231
======================================================================

  Trigger: 00707231      Segment: 000

  BAT Trigger Time: 491967184   [s; MET]
      Trigger Stop: 491967248   [s; MET]
               UTC: 2016-08-04T01:32:47.341920    [includes UTCF correction]
       Where From?: TDRSS position message

  BAT
    RA: 221.638607807751   Dec: 10.0011165699529  [deg; J2000]

     Catalogged Source?: NO
     Point Source?:      YES
     GRB Indicated?:     YES    [ by BAT flight software ]
     Image S/N Ratio:    11.89
     Image Trigger?:     YES
     Rate S/N Ratio:     0  [ if not an image trigger ]
     Image S/N Ratio:    11.89

  Analysis Position:   [ source = BAT ]
    RA: 221.638607807751   Dec: 10.0011165699529  [deg; J2000]

  Refined Position:   [ source = BAT pre-slew burst ]
    RA: 221.651684980682   Dec: 10.0017624785386  [deg; J2000]
        { 14h 46m 36.4s , +10d 00' 06.3" }
         +/- 1.25788995682185 [arcmin] (estimated 90% radius based on SNR)
         +/- 0.433911071666474 [arcmin] (formal 1-sigma fit error)
    SNR: 21.9165271397057

  Angular difference between the analysis and refined position is 0.773678 arcmin

  Partial Coding Fraction: 0.2851562    [ including projection effects ]

  Duration
     T90: 152.743999958038 +/- 19.2032148019115
        Measured from: 38.2039999961853
                   to: 190.947999954224     [s; relative to TRIGTIME]
     T50: 50.5999999642372 +/- 2.70942947753414
        Measured from: 78.7080000042915
                   to: 129.307999968529     [s; relative to TRIGTIME]


  Fluence
     Peak Flux  (peak 1 second)
        Measured from: 88.5920000076294
                   to: 89.5920000076294     [s; relative to TRIGTIME]
     Total Fluence
        Measured from: 25.1399999856949
                   to: 247.148000001907     [s; relative to TRIGTIME]

             Band 1     Band 2     Band 3     Band 4
              15-25      25-50     50-100    100-350     keV
 Total     6.232479   7.701667   4.733605   0.638294
           0.136541   0.139284   0.121339   0.103212 [error]
 Peak      0.077065   0.124618   0.095828   0.018236
           0.011709   0.012702   0.011273   0.008825 [error]

     [ fluence units of on-axis counts / fully illuminated detector ]

======================================================================


====== Table of the duration information =============================

        Value   tstart    tstop
T100  222.008   25.140  247.148
T90   152.744   38.204  190.948
T50    50.600   78.708  129.308
Peak    1.000   88.592   89.592


====== Spectral Analysis Summary =====================================

Model      : spectral model: simple power-law (PL) and cutoff power-law (CPL)
Ph_index   : photon index: E^{Ph_index}
Ph_90err   : 90% error of the photon index
Epeak      : Epeak in keV
Epeak_90err: 90% error of Epeak
Norm       : normalization at 50 keV in both the PL model and CPL model
Nomr_90err : 90% error of the normalization
chi2       : Chi-Squared
dof        : degree of freedo

=== Time-averaged spectral analysis ===
(Best model with acceptable fit: N/A)

Model Ph_index Ph_90err_low Ph_90err_hi  Epeak  Epeak_90err_low  Epeak_90err_hi  Norm       Nomr_90err_low    Norm_90err_hi    chi2    dof
PL      -1.878    -0.050      0.050       -           -               -         5.56e-03     -1.48e-04          1.47e-04      70.560   57
CPL     -1.415    -0.212      0.222       64.233      -7.208        13.787      9.33e-03     -1.92e-03          2.58e-03      55.870   56


=== 1-s peak spectral analysis ===
(Best model with acceptable fit: N/A)

Model Ph_index Ph_90err_low Ph_90err_hi  Epeak  Epeak_90err_low  Epeak_90err_hi  Norm       Nomr_90err_low    Norm_90err_hi    chi2    dof
PL      -1.663     -0.195     0.189       -           -               -         2.16e-02     -2.59e-03          2.56e-03      70.200   57
CPL     -1.104     -0.678     0.882       78.961     -31.241       -78.961      4.20e-02     -2.20e-02          7.58e-02      68.600   56


=== Fluence/Peak Flux Summary ===

              Model    Band1     Band2     Band3     Band4     Band5     Total
                       15-25     25-50    50-100    100-350    15-150    15-350    keV
Fluence         PL   2.25e-06  3.29e-06  3.58e-06  7.29e-06  1.13e-05  1.64e-05   erg/cm2
      90%_error_low -1.07e-07 -9.10e-08 -1.27e-07 -5.54e-07 -3.01e-07 -6.43e-07   erg/cm2
      90%_error_hi   1.09e-07  9.09e-08  1.27e-07  5.84e-07  3.01e-07  6.63e-07   erg/cm2
Peak flux       PL   1.04e+00  9.51e-01  6.01e-01  5.81e-01  2.84e+00  3.17e+00   ph/cm2/s
      90%_error_low -1.86e-01 -1.12e-01 -9.06e-02 -1.57e-01 -3.27e-01 -3.59e-01   ph/cm2/s
      90%_error_hi   1.96e-01  1.11e-01  8.96e-02  1.87e-01  3.28e-01  3.60e-01   ph/cm2/s

Fluence        CPL   2.04e-06  3.38e-06  3.65e-06  3.99e-06  1.09e-05  1.31e-05   erg/cm2
      90%_error_low -1.37e-07 -1.03e-07 -1.36e-07 -8.81e-07 -3.54e-07 -9.64e-07   erg/cm2
      90%_error_hi   1.40e-07  1.03e-07  1.37e-07  1.19e-06  3.54e-07  1.24e-06   erg/cm2
Peak flux      CPL   9.50e-01  1.01e+00  6.30e-01  3.23e-01  2.78e+00  2.91e+00   ph/cm2/s
      90%_error_low -2.21e-01 -1.35e-01 -1.01e-01 -1.78e-01 -3.36e-01 -3.95e-01   ph/cm2/s
      90%_error_hi   2.29e-01  1.41e-01  1.04e-01  3.28e-01  3.36e-01  4.91e-01   ph/cm2/s

======================================================================
Image
Pre-slew 15.0-350.0 keV image (Event data)
#   RAcent    DECcent   POSerr    Theta     Phi              Peak Cts       SNR   Name
  221.6517    10.0018   0.0088    47.3747     7.9314         4.1905155     21.917 TRIG_00707231

Foreground time interval of the image:
 25.140  73.301 (delta_t =  48.161 [sec])
Background time interval of the image:
-239.000  25.140 (delta_t = 264.140 [sec])
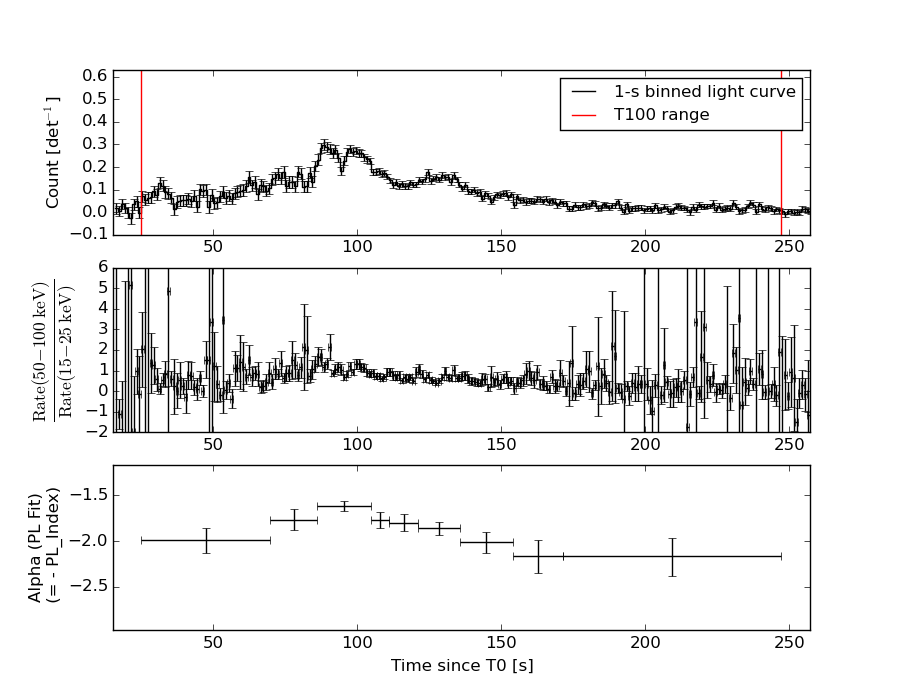
Light Curves
Note: The mask-weighted lightcurves have units of either count/det or counts/sec/det, where a det is 0.4 x 0.4 = 0.16 sq cm.
Full-time range; 1 s binning
Other quick-look light curves:
- 64 ms binning (zoomed)
- 16 ms binning (zoomed)
- 8 ms binning (zoomed)
- 2 ms binning (zoomed)
- SN=5 or 10 s binning (full-time range)
- Raw light curve
Spectra
- 64 ms binning (zoomed)
- 16 ms binning (zoomed)
- 8 ms binning (zoomed)
- 2 ms binning (zoomed)
- SN=5 or 10 s binning (full-time range)
- Raw light curve
Spectra
Notes:
- 1) The fitting includes the systematic errors.
- 2) When the burst includes telescope slew time periods, the fitting uses an average response file made from multiple 5-s response files through out the slew time plus single time preiod for the non-slew times, and weighted by the total counts in the corresponding time period using addrmf. An average response file is needed becuase a spectral fit using the pre-slew DRM will introduce some errors in both a spectral shape and a normalization if the PHA file contains a lot of the slew/post-slew time interval.
- 3) For fits to more complicated models (e.g. a power-law over a cutoff power-law), the BAT team has decided to require a chi-square improvement of more than 6 for each extra dof.
Time averaged spectrum fit using the average DRM
Power-law model
Time interval is from   25.140 sec. to  247.148 sec.

Spectral model in power-law:
------------------------------------------------------------
Parameters  : value       lower 90%   higher 90%
Photon index: -1.87765     ( -0.0503738   0.0500786 )
Norm@50keV  : 5.55951E-03    ( -0.000147552   0.000147321 )
------------------------------------------------------------
#Fit statistic : Chi-Squared =          70.56 using 59 PHA bins.
# Reduced chi-squared =          1.238 for     57 degrees of freedom
# Null hypothesis probability =   1.070007e-01

Photon flux (15-150 keV)    in 222 sec: 0.790435 ( -0.023109  0.02321 ) ph/cm2/s
Energy fluence (15-150 keV)             : 1.13478e-05 ( -3.00877e-07  3.01276e-07 ) ergs/cm2
Cutoff power-law model
Time interval is from   25.140 sec. to  247.148 sec.
Spectral model in the cutoff power-law:
------------------------------------------------------------
Parameters  : value       lower 90%   higher 90%
Photon index: -1.4147     ( -0.211593   0.222108 )
Epeak [keV] : 64.2334      ( -7.20772 13.7869 )
Norm@50keV  : 9.33167E-03    ( -0.00192445   0.00257672 )
------------------------------------------------------------
#Fit statistic : Chi-Squared =          55.87 using 59 PHA bins.
# Reduced chi-squared =         0.9976 for     56 degrees of freedom
# Null hypothesis probability =   4.798245e-01

Photon flux (15-150 keV)    in 222 sec: 0.759942 ( -0.026338  0.026509 ) ph/cm2/s
Energy fluence (15-150 keV)             : 1.09266e-05 ( -3.53923e-07  3.53548e-07 ) ergs/cm2
1-s peak spectrum fit
Power-law model
Time interval is from   88.592 sec. to   89.592 sec.

Spectral model in power-law:
------------------------------------------------------------
Parameters  : value       lower 90%   higher 90%
Photon index: -1.66323     ( -0.194558   0.18899 )
Norm@50keV  : 2.16198E-02    ( -0.00258725   0.00256068 )
------------------------------------------------------------
#Fit statistic : Chi-Squared =          70.20 using 59 PHA bins.
# Reduced chi-squared =          1.232 for     57 degrees of freedom
# Null hypothesis probability =   1.125157e-01

Photon flux (15-150 keV)    in 1 sec: 2.83556 ( -0.32741  0.32794 ) ph/cm2/s
Energy fluence (15-150 keV)             : 2.0084e-07 ( -2.5169e-08  2.53691e-08 ) ergs/cm2
Cutoff power-law model
Time interval is from   88.592 sec. to   89.592 sec.
Spectral model in the cutoff power-law:
------------------------------------------------------------
Parameters  : value       lower 90%   higher 90%
Photon index: -1.10438     ( -0.677773   0.881933 )
Epeak [keV] : 78.9614      ( -31.241 -78.9614 )
Norm@50keV  : 4.20007E-02    ( -0.0220028   0.0758428 )
------------------------------------------------------------
#Fit statistic : Chi-Squared =          68.60 using 59 PHA bins.
# Reduced chi-squared =          1.225 for     56 degrees of freedom
# Null hypothesis probability =   1.203094e-01

Photon flux (15-150 keV)    in 1 sec: 2.78155 ( -0.3359  0.33597 ) ph/cm2/s
Energy fluence (15-150 keV)             : 1.9446e-07 ( -2.68731e-08  2.69055e-08 ) ergs/cm2
Time-resolved spectra
Distribution
T90 vs. Hardness ratio plot
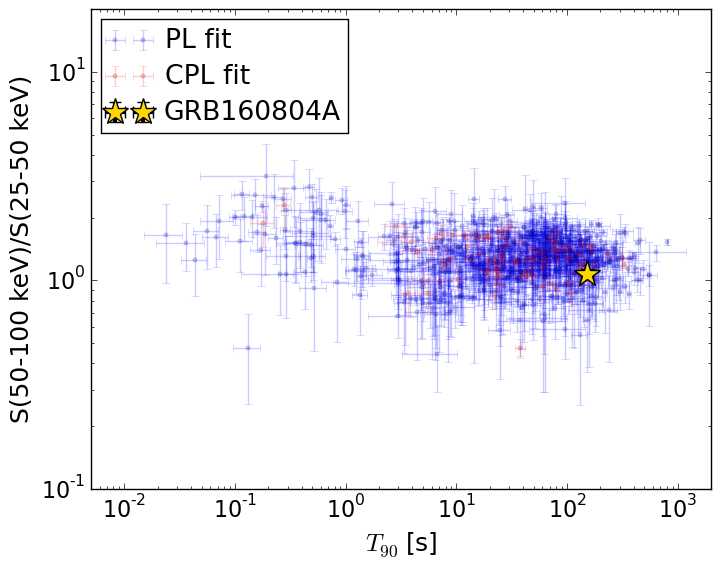
T90                                   = 152.744 sec.
Hardness ratio (energy fluence ratio) = 1.07882274492
S(15-50 keV) vs. S(50-150 keV) plot
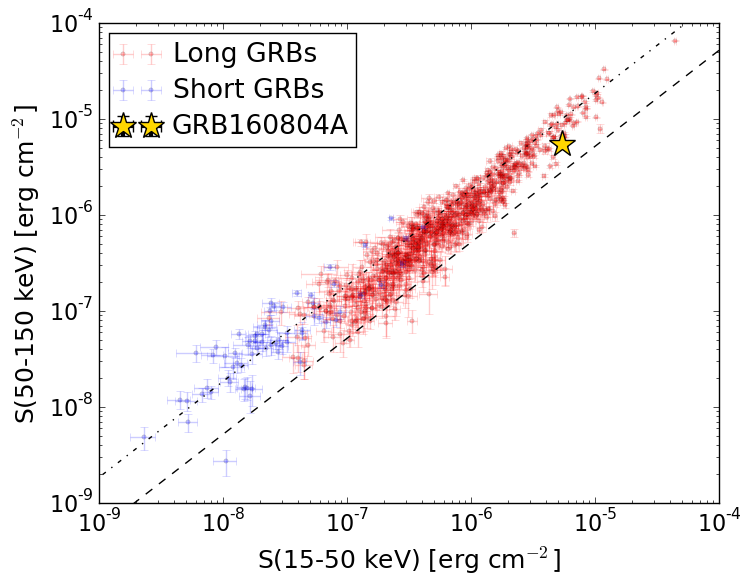
S(15-50 keV)  = 5.423795e-06
S(50-150 keV) = 5.502755e-06
The dash-dotted line and the dashed line traces the fluences calculated from the Band function with Epeak = 15 and 150 keV, respectively. Both lines assume a canonical values of alpha = -1 and beta = -2.5.
Mask shadow pattern
IMX = 1.076134540255951E+00, IMY = -1.499279680944308E-01
Spacecraft aspect plot
Bright source in the pre-burst/pre-slew/post-slew images
Pre-burst image of 15-350 keV band
Time interval of the image:
-239.000000 25.140000

# RAcent  DECcent POSerr Theta    Phi  PeakCts   SNR AngSep     Name
#  [deg]    [deg]    ['] [deg]  [deg]                   [']
170.2230 -60.7863   26.6  34.2 -167.3   0.1315   0.4   10.2	Cen X-3
186.4121 -62.7100    3.9  30.5  179.7   0.8832   3.0    7.6	GX 301-2
244.9946 -15.6392    0.8  41.3   57.5  14.3566  14.4    0.9	Sco X-1
229.3222  10.0490    2.6  50.5   17.1   3.3226   4.4 ------	UNKNOWN
132.1176 -48.1912    2.5  53.7 -144.3   7.3125   4.6 ------	UNKNOWN
181.8078  11.7370    2.9  50.6  -44.6   5.2453   3.9 ------	UNKNOWN
173.0762  -1.4844    2.6  43.6  -64.1   4.9762   4.4 ------	UNKNOWN
153.4070 -28.3513    2.5  43.1 -112.6   5.1620   4.6 ------	UNKNOWN
Pre-slew background subtracted image of 15-350 keV band
Time interval of the image:
25.140000 73.300590

# RAcent  DECcent POSerr Theta    Phi  PeakCts   SNR AngSep     Name
#  [deg]    [deg]    ['] [deg]  [deg]                   [']
170.3178 -60.6218   47.7  34.1 -167.1  -0.0272  -0.2    0.1	Cen X-3
186.8245 -62.8971    6.8  30.5  179.2  -0.1787  -1.7    8.9	GX 301-2
244.9016 -15.5073    4.1  41.3   57.2   0.9400   2.8    9.2	Sco X-1
245.4948 -28.9040    2.3  35.6   76.9   1.0089   5.1 ------	UNKNOWN
221.6517  10.0018    0.5  47.4    7.9   4.1908  21.9 ------	UNKNOWN
112.6839 -77.1742    2.2  57.0  179.2   2.7195   5.1 ------	UNKNOWN
Post-slew image of 15-350 keV band
Time interval of the image:
136.500590 838.953600
841.000000 963.160000

# RAcent  DECcent POSerr Theta    Phi  PeakCts   SNR AngSep     Name
#  [deg]    [deg]    ['] [deg]  [deg]                   [']
244.9831 -15.6489    0.4  34.6  121.4  44.4238  28.5    0.6	Sco X-1
254.4154  35.4031    4.7  39.2   28.1   2.8130   2.4    4.2	Her X-1
269.9377  34.8153    3.3  50.4   36.4  12.0966   3.5 ------	UNKNOWN
247.4134 -23.2847    2.7  41.8  126.9  11.1393   4.2 ------	UNKNOWN
223.4599 -17.6320    2.6  27.7  160.0   3.5334   4.4 ------	UNKNOWN
218.2703 -21.9598    3.5  32.1  169.6   3.0250   3.3 ------	UNKNOWN
221.6574  10.0170    1.6   0.0   63.9   4.9501   7.3 ------	UNKNOWN
215.5740  -2.6995    3.2  14.1 -170.6   2.6798   3.6 ------	UNKNOWN
238.1401  63.9575    3.2  55.2   -7.5   8.1949   3.6 ------	UNKNOWN
183.3188  40.3897    3.4  45.5  -57.7  14.5454   3.4 ------	UNKNOWN