Analysis Summary
Notes:
- 1) No attempt has been made to eliminate the non-significant decimal places.
- 2) This batgrbproduct analysis is done using the HEASARC data.
- 3) This batgrbproduct analysis is using the flight position for the mask-weighting calculation.
======================================================================
                  BAT GRB EVENT DATA PROCESSING REPORT
    Process Script Ver: batgrbproduct v2.46
    Process Start Time: Sun Sep 11 20:58:37 EDT 2016
             Host Name: bat1
   Current Working Dir: /local/data/bat1/alien/Swift_3rdBATcatalog/event/batevent_reproc/trigger708598
======================================================================

  Trigger: 00708598      Segment: 000

  BAT Trigger Time: 492954328.448   [s; MET]
      Trigger Stop: 492954329.472   [s; MET]
               UTC: 2016-08-15T11:45:11.734540    [includes UTCF correction]
       Where From?: TDRSS position message

  BAT
    RA: 288.686231783051   Dec: 84.2999980928292  [deg; J2000]

     Catalogged Source?: NO
     Point Source?:      YES
     GRB Indicated?:     YES    [ by BAT flight software ]
     Image S/N Ratio:    12.55
     Image Trigger?:     NO
     Rate S/N Ratio:     29.3938769133981  [ if not an image trigger ]
     Image S/N Ratio:    12.55

  Analysis Position:   [ source = BAT ]
    RA: 288.686231783051   Dec: 84.2999980928292  [deg; J2000]

  Refined Position:   [ source = BAT pre-slew burst ]
    RA: 288.616285136508   Dec: 84.2984506938288  [deg; J2000]
        { 19h 14m 27.9s , +84d 17' 54.4" }
         +/- 0.969787085396543 [arcmin] (estimated 90% radius based on SNR)
         +/- 0.335371393467033 [arcmin] (formal 1-sigma fit error)
    SNR: 31.7798687681838

  Angular difference between the analysis and refined position is 0.427095 arcmin

  Partial Coding Fraction: 0.4101562    [ including projection effects ]

  Duration
     T90: 8.56799989938736 +/- 1.8342955655889
        Measured from: -4.25999999046326
                   to: 4.3079999089241     [s; relative to TRIGTIME]
     T50: 2.87199997901917 +/- 0.291204389676345
        Measured from: -0.156000018119812
                   to: 2.71599996089935     [s; relative to TRIGTIME]


  Fluence
     Peak Flux  (peak 1 second)
        Measured from: 2.14399999380112
                   to: 3.14399999380112     [s; relative to TRIGTIME]
     Total Fluence
        Measured from: -6.40799999237061
                   to: 5.19599997997284     [s; relative to TRIGTIME]

             Band 1     Band 2     Band 3     Band 4
              15-25      25-50     50-100    100-350     keV
 Total     0.655528   0.914291   0.630525   0.122144
           0.038439   0.041549   0.036145   0.028525 [error]
 Peak      0.145093   0.191871   0.159921   0.030142
           0.013068   0.014501   0.012825   0.009217 [error]

     [ fluence units of on-axis counts / fully illuminated detector ]

======================================================================


====== Table of the duration information =============================

        Value   tstart    tstop
T100   11.604   -6.408    5.196
T90     8.568   -4.260    4.308
T50     2.872   -0.156    2.716
Peak    1.000    2.144    3.144


====== Spectral Analysis Summary =====================================

Model      : spectral model: simple power-law (PL) and cutoff power-law (CPL)
Ph_index   : photon index: E^{Ph_index}
Ph_90err   : 90% error of the photon index
Epeak      : Epeak in keV
Epeak_90err: 90% error of Epeak
Norm       : normalization at 50 keV in both the PL model and CPL model
Nomr_90err : 90% error of the normalization
chi2       : Chi-Squared
dof        : degree of freedo

=== Time-averaged spectral analysis ===
(Best model with acceptable fit: CPL)

Model Ph_index Ph_90err_low Ph_90err_hi  Epeak  Epeak_90err_low  Epeak_90err_hi  Norm       Nomr_90err_low    Norm_90err_hi    chi2    dof
PL      -1.725    -0.092      0.091       -           -               -         1.36e-02     -7.55e-04          7.52e-04      60.000   57
CPL     -0.961    -0.395      0.434       67.728      -9.676        21.670      3.31e-02     -1.20e-02          2.11e-02      48.200   56


=== 1-s peak spectral analysis ===
(Best model with acceptable fit: PL)

Model Ph_index Ph_90err_low Ph_90err_hi  Epeak  Epeak_90err_low  Epeak_90err_hi  Norm       Nomr_90err_low    Norm_90err_hi    chi2    dof
PL      -1.570     -0.133     0.131       -           -               -         3.68e-02     -2.90e-03          2.90e-03      33.770   57
CPL     -1.134     -0.489     0.587      106.504     -35.149      -106.504      5.96e-02     -2.42e-02          5.23e-02      31.780   56


=== Fluence/Peak Flux Summary ===

              Model    Band1     Band2     Band3     Band4     Band5     Total
                       15-25     25-50    50-100    100-350    15-150    15-350    keV
Fluence         PL   2.49e-07  4.00e-07  4.83e-07  1.15e-06  1.46e-06  2.28e-06   erg/cm2
      90%_error_low -2.15e-08 -2.18e-08 -3.49e-08 -1.64e-07 -8.38e-08 -1.96e-07   erg/cm2
      90%_error_hi   2.21e-08  2.18e-08  3.49e-08  1.80e-07  8.41e-08  2.08e-07   erg/cm2
Peak flux       PL   1.62e+00  1.56e+00  1.05e+00  1.11e+00  4.69e+00  5.35e+00   ph/cm2/s
      90%_error_low -2.14e-01 -1.32e-01 -1.02e-01 -2.04e-01 -3.79e-01 -4.14e-01   ph/cm2/s
      90%_error_hi   2.24e-01  1.31e-01  1.01e-01  2.28e-01  3.80e-01  4.14e-01   ph/cm2/s

Fluence        CPL   2.19e-07  4.30e-07  5.05e-07  4.42e-07  1.39e-06  1.60e-06   erg/cm2
      90%_error_low -2.61e-08 -2.69e-08 -3.93e-08 -1.56e-07 -9.07e-08 -1.80e-07   erg/cm2
      90%_error_hi   2.66e-08  2.74e-08  3.97e-08  2.56e-07  9.11e-08  2.64e-07   erg/cm2
Peak flux      CPL   1.48e+00  1.62e+00  1.11e+00  7.36e-01  4.60e+00  4.94e+00   ph/cm2/s
      90%_error_low -2.70e-01 -1.50e-01 -1.22e-01 -2.82e-01 -3.92e-01 -5.25e-01   ph/cm2/s
      90%_error_hi   2.79e-01  1.53e-01  1.25e-01  4.56e-01  3.93e-01  6.19e-01   ph/cm2/s

======================================================================
Image
Pre-slew 15.0-350.0 keV image (Event data)
#   RAcent    DECcent   POSerr    Theta     Phi              Peak Cts       SNR   Name
  288.6163    84.2985   0.0061    41.9049    13.6167         2.4691020     31.780 TRIG_00708598

Foreground time interval of the image:
 -6.408   5.196 (delta_t =  11.604 [sec])
Background time interval of the image:
-239.448  -6.408 (delta_t = 233.040 [sec])
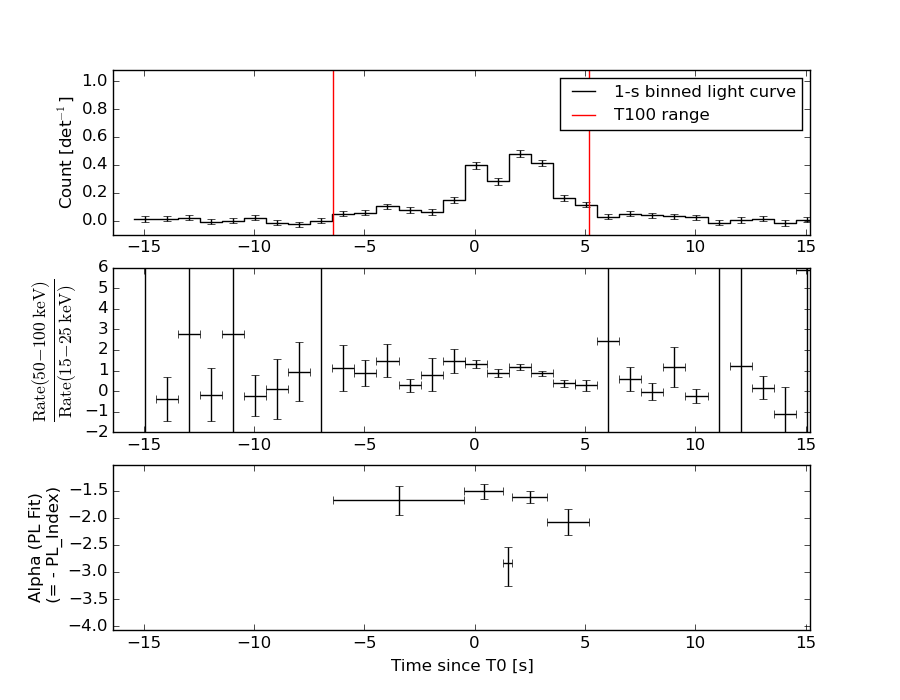
Light Curves
Note: The mask-weighted lightcurves have units of either count/det or counts/sec/det, where a det is 0.4 x 0.4 = 0.16 sq cm.
Full-time range; 1 s binning
Other quick-look light curves:
Spectra
Notes:
- 1) The fitting includes the systematic errors.
- 2) When the burst includes telescope slew time periods, the fitting uses an average response file made from multiple 5-s response files through out the slew time plus single time preiod for the non-slew times, and weighted by the total counts in the corresponding time period using addrmf. An average response file is needed becuase a spectral fit using the pre-slew DRM will introduce some errors in both a spectral shape and a normalization if the PHA file contains a lot of the slew/post-slew time interval.
- 3) For fits to more complicated models (e.g. a power-law over a cutoff power-law), the BAT team has decided to require a chi-square improvement of more than 6 for each extra dof.
Time averaged spectrum fit using the average DRM
Power-law model
Time interval is from   -6.408 sec. to    5.196 sec.

Spectral model in power-law:
------------------------------------------------------------
Parameters  : value       lower 90%   higher 90%
Photon index: -1.72491     ( -0.0922982   0.0910761 )
Norm@50keV  : 1.36258E-02    ( -0.000755416   0.000752361 )
------------------------------------------------------------
#Fit statistic : Chi-Squared =          60.00 using 59 PHA bins.
# Reduced chi-squared =          1.053 for     57 degrees of freedom
# Null hypothesis probability =   3.675722e-01

Photon flux (15-150 keV)    in 11.6 sec: 1.82577 ( -0.10073  0.10092 ) ph/cm2/s
Energy fluence (15-150 keV)             : 1.46103e-06 ( -8.38286e-08  8.40733e-08 ) ergs/cm2
Cutoff power-law model
Time interval is from   -6.408 sec. to    5.196 sec.
Spectral model in the cutoff power-law:
------------------------------------------------------------
Parameters  : value       lower 90%   higher 90%
Photon index: -0.961261     ( -0.39484   0.434067 )
Epeak [keV] : 67.7279      ( -9.67607 21.6706 )
Norm@50keV  : 3.30991E-02    ( -0.0119584   0.0211368 )
------------------------------------------------------------
#Fit statistic : Chi-Squared =          48.20 using 59 PHA bins.
# Reduced chi-squared =         0.8607 for     56 degrees of freedom
# Null hypothesis probability =   7.613327e-01

Photon flux (15-150 keV)    in 11.6 sec: 1.75870 ( -0.10601  0.1062 ) ph/cm2/s
Energy fluence (15-150 keV)             : 1.39351e-06 ( -9.07373e-08  9.1087e-08 ) ergs/cm2
1-s peak spectrum fit
Power-law model
Time interval is from    2.144 sec. to    3.144 sec.

Spectral model in power-law:
------------------------------------------------------------
Parameters  : value       lower 90%   higher 90%
Photon index: -1.56993     ( -0.13262   0.130668 )
Norm@50keV  : 3.67945E-02    ( -0.00290336   0.00289516 )
------------------------------------------------------------
#Fit statistic : Chi-Squared =          33.77 using 59 PHA bins.
# Reduced chi-squared =         0.5924 for     57 degrees of freedom
# Null hypothesis probability =   9.938919e-01

Photon flux (15-150 keV)    in 1 sec: 4.68544 ( -0.37905  0.37982 ) ph/cm2/s
Energy fluence (15-150 keV)             : 3.45478e-07 ( -2.89078e-08  2.90377e-08 ) ergs/cm2
Cutoff power-law model
Time interval is from    2.144 sec. to    3.144 sec.
Spectral model in the cutoff power-law:
------------------------------------------------------------
Parameters  : value       lower 90%   higher 90%
Photon index: -1.13369     ( -0.489275   0.587438 )
Epeak [keV] : 106.504      ( -35.1493 -106.504 )
Norm@50keV  : 5.96298E-02    ( -0.0242499   0.0523076 )
------------------------------------------------------------
#Fit statistic : Chi-Squared =          31.78 using 59 PHA bins.
# Reduced chi-squared =         0.5676 for     56 degrees of freedom
# Null hypothesis probability =   9.962451e-01

Photon flux (15-150 keV)    in 1 sec: 4.60101 ( -0.39245  0.39305 ) ph/cm2/s
Energy fluence (15-150 keV)             : 3.39735e-07 ( -3.00644e-08  3.00251e-08 ) ergs/cm2
Time-resolved spectra
Distribution
T90 vs. Hardness ratio plot
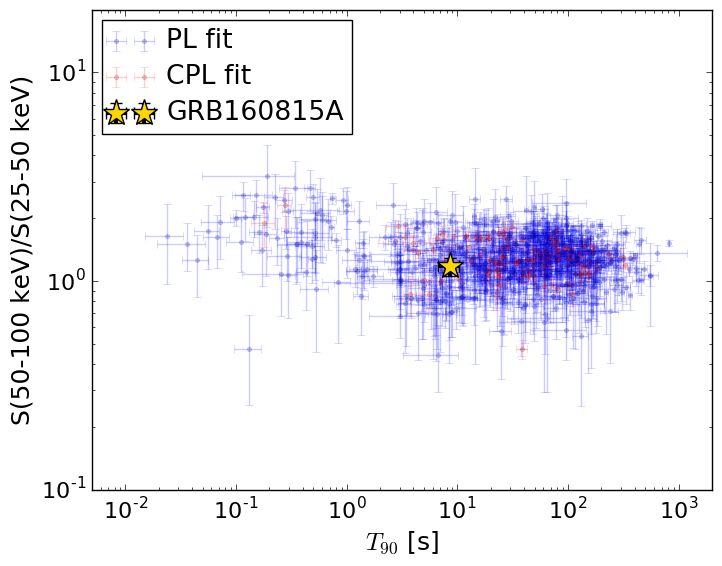
T90                                   = 8.568 sec.
Hardness ratio (energy fluence ratio) = 1.1762238169
S(15-50 keV) vs. S(50-150 keV) plot
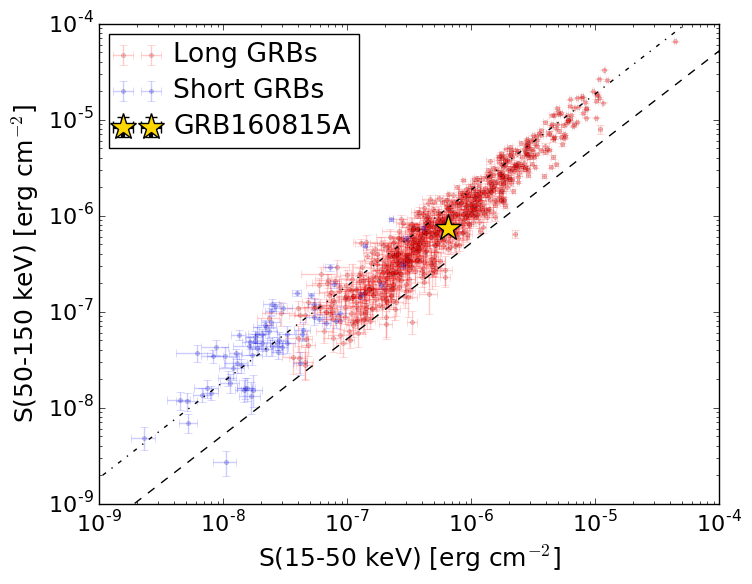
S(15-50 keV)  = 6.482703e-07
S(50-150 keV) = 7.452459e-07
The dash-dotted line and the dashed line traces the fluences calculated from the Band function with Epeak = 15 and 150 keV, respectively. Both lines assume a canonical values of alpha = -1 and beta = -2.5.
Mask shadow pattern
IMX = 8.721793904678404E-01, IMY = -2.112719245971386E-01
Spacecraft aspect plot
Bright source in the pre-burst/pre-slew/post-slew images
Pre-burst image of 15-350 keV band
Time interval of the image:
-239.448000 -6.408000

# RAcent  DECcent POSerr Theta    Phi  PeakCts   SNR AngSep     Name
#  [deg]    [deg]    ['] [deg]  [deg]                   [']
254.3770  35.5099   53.3  39.2   94.3   0.1875   0.2   10.8	Her X-1
 91.6114  61.8182    3.6  57.5  -26.2   3.7401   3.2 ------	UNKNOWN
164.0628  18.8313    2.0  43.1 -113.4   5.0932   5.6 ------	UNKNOWN
Pre-slew background subtracted image of 15-350 keV band
Time interval of the image:
-6.408000 5.196000

# RAcent  DECcent POSerr Theta    Phi  PeakCts   SNR AngSep     Name
#  [deg]    [deg]    ['] [deg]  [deg]                   [']
254.4770  35.4666    4.7  39.3   94.3  -0.4644  -2.4    7.5	Her X-1
333.3416  78.4281    2.1  50.1   16.7   0.7802   5.5 ------	UNKNOWN
288.6164  84.2984    0.4  41.9   13.6   2.4695  31.8 ------	UNKNOWN
271.7616  83.5992    2.1  40.1   14.4   0.3715   5.4 ------	UNKNOWN
Post-slew image of 15-350 keV band
Time interval of the image:
77.652590 962.624200

# RAcent  DECcent POSerr Theta    Phi  PeakCts   SNR AngSep     Name
#  [deg]    [deg]    ['] [deg]  [deg]                   [']
254.3244  35.3577    5.9  50.0  163.1   3.8717   2.0    6.6	Her X-1
325.3160  73.7899    3.6  12.1   73.8   1.6686   3.3 ------	UNKNOWN
 52.6793  58.4588    2.3  35.0   -4.6   3.7968   5.0 ------	UNKNOWN
178.0830  72.8937    2.2  19.8 -108.1   3.0390   5.3 ------	UNKNOWN
 69.6723  34.8947    3.4  59.6  -17.0  14.0885   3.4 ------	UNKNOWN
 78.9753  36.1966    3.6  58.8  -25.9  13.6719   3.2 ------	UNKNOWN
 98.5733  44.9639    4.3  50.6  -44.5   9.1761   2.7 ------	UNKNOWN