Analysis Summary
Notes:
- 1) No attempt has been made to eliminate the non-significant decimal places.
- 2) This batgrbproduct analysis is done using the HEASARC data.
- 3) This batgrbproduct analysis is using the flight position for the mask-weighting calculation.
==========================================================================
BAT GROUND-DETECTED GRB DATA PROCESSING REPORT
(This burst occurred during telescope slew)
Process Script Ver: batgrbproduct v2.46
Process Start Time: Sat Aug 20 12:52:11 EDT 2016
Host Name: bat1
Current Working Dir: /local/data/bat1/alien/Swift_3rdBATcatalog/event/batevent_reproc/GRB160819A
======================================================================
Trigger: 00086022 Segment: 006
BAT Trigger Time: 493331254.4
UTC: 2016-08-19T20:27:30.400 [includes UTCF correction]
Where From?: Ground analysis (best_duration.txt)
NOTE: BAT trigger time for ground-detected burst during slew is the T100 start time.
Analysis Position: [ source = GCN ]
RA: 114.13494286 Dec: -22.35165385 [deg; J2000]
Refined Position: [ source = BAT mosaic image ]
RA: 114.138948096313 Dec: -22.3472685705862 [deg; J2000]
{ 07h 36m 33.3s , -22d -20' -50.2" }
+/- 1.01533632758 [arcmin] (estimated 90% radius based on SNR)
SNR: 29.7668204346
Angular difference between the analysis and refined position is 0.344428 arcmin
Partial Coding Fraction: Unavailable because the burst occurred during slew.
Duration
T90: 67.1999999880791 +/- 1.6
Measured from: 3.2
to: 70.4 [s; relative to TRIGTIME]
T50: 35.1999999880791 +/- 1.6
Measured from: 19.2
to: 54.4 [s; relative to TRIGTIME]
====== Table of the duration information =============================
Value tstart tstop
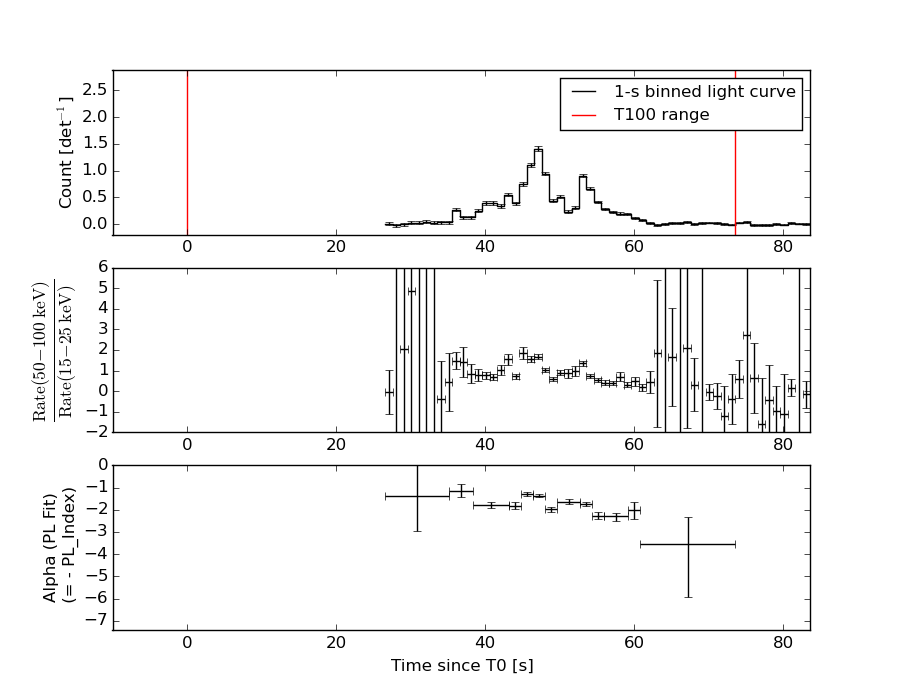
T100 73.600 0.000 73.600
T90 67.200 3.200 70.400
T50 35.200 19.200 54.400
Peak 1.000 46.700 47.700
====== Spectral Analysis Summary =====================================
Model : spectral model: simple power-law (PL) and cutoff power-law (CPL)
Ph_index : photon index: E^{Ph_index}
Ph_90err : 90% error of the photon index
Epeak : Epeak in keV
Epeak_90err: 90% error of Epeak
Norm : normalization at 50 keV in both the PL model and CPL model
Nomr_90err : 90% error of the normalization
chi2 : Chi-Squared
dof : degree of freedo
=== Time-averaged spectral analysis ===
(Best model with acceptable fit: PL)
Model Ph_index Ph_90err_low Ph_90err_hi Epeak Epeak_90err_low Epeak_90err_hi Norm Nomr_90err_low Norm_90err_hi chi2 dof
PL -1.697 -0.053 0.052 - - - 1.78e-02 -5.04e-04 5.04e-04 48.820 57
CPL -1.489 -0.203 0.212 133.047 -41.343 864.209 2.23e-02 -4.24e-03 5.54e-03 45.770 56
=== 1-s peak spectral analysis ===
(Best model with acceptable fit: PL)
Model Ph_index Ph_90err_low Ph_90err_hi Epeak Epeak_90err_low Epeak_90err_hi Norm Nomr_90err_low Norm_90err_hi chi2 dof
PL -1.351 -0.085 0.085 - - - 1.00e-01 -5.10e-03 5.10e-03 65.080 57
CPL -0.972 -0.357 0.388 147.328 -48.738 901.712 1.52e-01 -4.83e-02 7.82e-02 61.820 56
=== Fluence/Peak Flux Summary ===
Model Band1 Band2 Band3 Band4 Band5 Total
15-25 25-50 50-100 100-350 15-150 15-350 keV
Fluence PL 1.29e-06 2.10e-06 2.59e-06 6.31e-06 7.75e-06 1.23e-05 erg/cm2
90%_error_low -6.94e-08 -6.68e-08 -9.18e-08 -4.86e-07 -2.25e-07 -5.43e-07 erg/cm2
90%_error_hi 7.09e-08 6.67e-08 9.15e-08 5.13e-07 2.25e-07 5.62e-07 erg/cm2
Peak flux PL 3.58e+00 3.94e+00 3.09e+00 3.99e+00 1.21e+01 1.46e+01 ph/cm2/s
90%_error_low -3.32e-01 -2.31e-01 -1.83e-01 -4.66e-01 -6.43e-01 -7.53e-01 ph/cm2/s
90%_error_hi 3.42e-01 2.29e-01 1.82e-01 5.00e-01 6.43e-01 7.55e-01 ph/cm2/s
Fluence CPL 1.23e-06 2.12e-06 2.63e-06 4.81e-06 7.65e-06 1.08e-05 erg/cm2
90%_error_low -8.87e-08 -7.28e-08 -1.02e-07 -1.08e-06 -2.45e-07 -1.10e-06 erg/cm2
90%_error_hi 9.04e-08 7.33e-08 1.03e-07 1.47e-06 2.44e-07 1.47e-06 erg/cm2
Peak flux CPL 3.30e+00 4.06e+00 3.23e+00 2.74e+00 1.19e+01 1.33e+01 ph/cm2/s
90%_error_low -4.15e-01 -2.61e-01 -2.27e-01 -7.86e-01 -6.59e-01 -1.05e+00 ph/cm2/s
90%_error_hi 4.26e-01 2.65e-01 2.30e-01 1.18e+00 6.60e-01 1.31e+00 ph/cm2/s
======================================================================
Image
Note1: The mosaic image is made with timebin = 0.3 s; energybin = 15-350 keV
Note2: The mosaic image uses Galactic coordinate.
#RAcent DECcent POSerr Theta  Phi  Peak_Cts  SNR Name
114.139 -22.347 0.002 29.001 178.669 0.112 29.767 UNKNOWN

Image time interval: 26.600 to 73.600 [sec]
Light Curves
Note: The mask-weighted lightcurves have units of either count/det or counts/sec/det, where a det is 0.4 x 0.4 = 0.16 sq cm.
Best duration plot
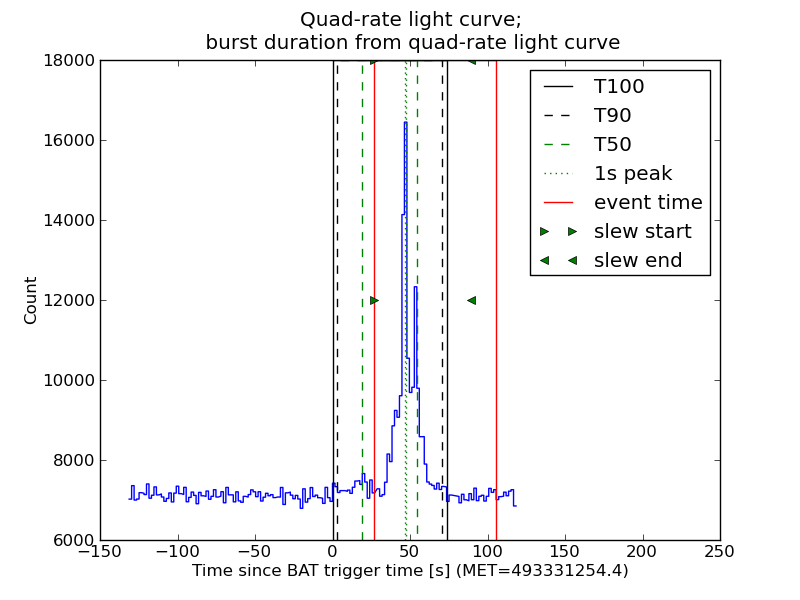
Full-time range; 1 s binning
Other quick-look light curves:
- 64 ms binning (zoomed)
- 16 ms binning (zoomed)
- 8 ms binning (zoomed)
- 2 ms binning (zoomed)
- SN=5 or 10 s binning (full-time range)
- Raw light curve
Spectra
- 64 ms binning (zoomed)
- 16 ms binning (zoomed)
- 8 ms binning (zoomed)
- 2 ms binning (zoomed)
- SN=5 or 10 s binning (full-time range)
- Raw light curve
Spectra
Notes:
- 1) The fitting includes the systematic errors.
- 2) When the burst includes telescope slew time periods, the fitting uses an average response file made from multiple 5-s response files through out the slew time plus single time preiod for the non-slew times, and weighted by the total counts in the corresponding time period using addrmf. An average response file is needed becuase a spectral fit using the pre-slew DRM will introduce some errors in both a spectral shape and a normalization if the PHA file contains a lot of the slew/post-slew time interval.
- 3) For fits to more complicated models (e.g. a power-law over a cutoff power-law), the BAT team has decided to require a chi-square improvement of more than 6 for each extra dof.
Time averaged spectrum fit using the average DRM
Power-law model
Time interval is from   26.600 sec. to   73.600 sec.

Spectral model in power-law:
------------------------------------------------------------
Parameters  : value       lower 90%   higher 90%
Photon index: -1.69657     ( -0.0525741   0.0524359 )
Norm@50keV  : 1.78057E-02    ( -0.000504166   0.000504032 )
------------------------------------------------------------
#Fit statistic : Chi-Squared =          48.82 using 59 PHA bins.
# Reduced chi-squared =         0.8566 for     57 degrees of freedom
# Null hypothesis probability =   7.710943e-01

Photon flux (15-150 keV)    in 47 sec: 2.36206 ( -0.07592  0.07622 ) ph/cm2/s
Energy fluence (15-150 keV)             : 7.75171e-06 ( -2.2478e-07  2.24891e-07 ) ergs/cm2
Cutoff power-law model
Time interval is from   26.600 sec. to   73.600 sec.
Spectral model in the cutoff power-law:
------------------------------------------------------------
Parameters  : value       lower 90%   higher 90%
Photon index: -1.48874     ( -0.20291   0.212321 )
Epeak [keV] : 133.047      ( -41.3425 864.209 )
Norm@50keV  : 2.22618E-02    ( -0.00423646   0.00553706 )
------------------------------------------------------------
#Fit statistic : Chi-Squared =          45.77 using 59 PHA bins.
# Reduced chi-squared =         0.8173 for     56 degrees of freedom
# Null hypothesis probability =   8.336603e-01

Photon flux (15-150 keV)    in 47 sec: 2.32507 ( -0.08324  0.08366 ) ph/cm2/s
Energy fluence (15-150 keV)             : 7.6531e-06 ( -2.45157e-07  2.44182e-07 ) ergs/cm2
1-s peak spectrum fit
Power-law model
Time interval is from   46.700 sec. to   47.700 sec.

Spectral model in power-law:
------------------------------------------------------------
Parameters  : value       lower 90%   higher 90%
Photon index: -1.3515     ( -0.0850586   0.0850684 )
Norm@50keV  : 0.100350    ( -0.00510207   0.00510169 )
------------------------------------------------------------
#Fit statistic : Chi-Squared =          65.08 using 59 PHA bins.
# Reduced chi-squared =          1.142 for     57 degrees of freedom
# Null hypothesis probability =   2.159656e-01

Photon flux (15-150 keV)    in 1 sec: 12.0931 ( -0.6426  0.6435 ) ph/cm2/s
Energy fluence (15-150 keV)             : 9.79873e-07 ( -5.37045e-08  5.38639e-08 ) ergs/cm2
Cutoff power-law model
Time interval is from   46.700 sec. to   47.700 sec.
Spectral model in the cutoff power-law:
------------------------------------------------------------
Parameters  : value       lower 90%   higher 90%
Photon index: -0.972296     ( -0.357201   0.38815 )
Epeak [keV] : 147.328      ( -48.7398 901.706 )
Norm@50keV  : 0.152053    ( -0.048305   0.0782101 )
------------------------------------------------------------
#Fit statistic : Chi-Squared =          61.82 using 59 PHA bins.
# Reduced chi-squared =          1.104 for     56 degrees of freedom
# Null hypothesis probability =   2.761495e-01

Photon flux (15-150 keV)    in 1 sec: 11.9369 ( -0.659  0.6596 ) ph/cm2/s
Energy fluence (15-150 keV)             : 9.64784e-07 ( -5.65244e-08  5.6226e-08 ) ergs/cm2
Time-resolved spectra
Distribution
T90 vs. Hardness ratio plot
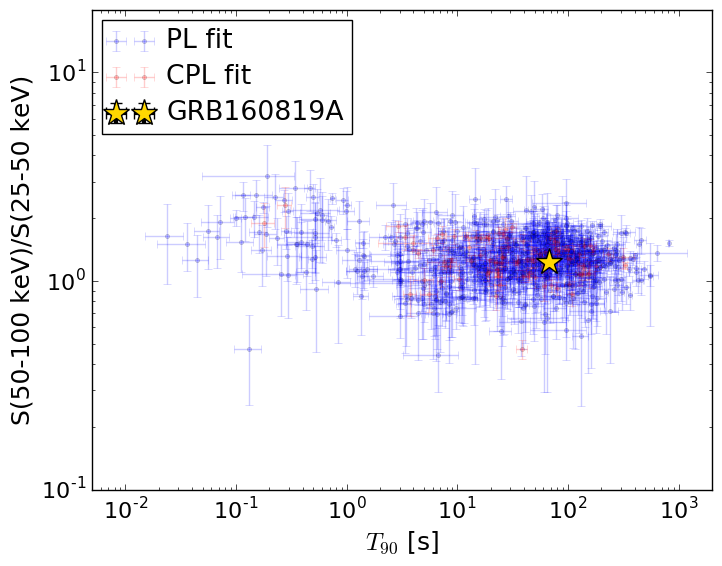
T90                                   = 67.2 sec.
Hardness ratio (energy fluence ratio) = 1.23412764317
S(15-50 keV) vs. S(50-150 keV) plot
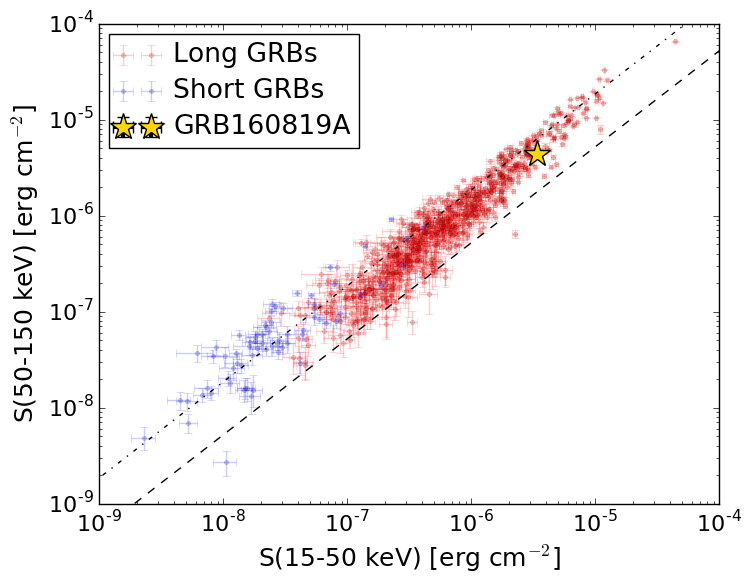
S(15-50 keV)  = 3.380862e-06
S(50-150 keV) = 4.37083e-06
The dash-dotted line and the dashed line traces the fluences calculated from the Band function with Epeak = 15 and 150 keV, respectively. Both lines assume a canonical values of alpha = -1 and beta = -2.5.