Analysis Summary
Notes:
- 1) No attempt has been made to eliminate the non-significant decimal places.
- 2) This batgrbproduct analysis is done using the HEASARC data.
- 3) This batgrbproduct analysis is using the flight position for the mask-weighting calculation.
======================================================================
                  BAT GRB EVENT DATA PROCESSING REPORT
    Process Script Ver: batgrbproduct v2.46
    Process Start Time: Sun Sep 11 20:50:17 EDT 2016
             Host Name: bat1
   Current Working Dir: /local/data/bat1/alien/Swift_3rdBATcatalog/event/batevent_reproc/trigger709765
======================================================================

  Trigger: 00709765      Segment: 000

  BAT Trigger Time: 493773762.112   [s; MET]
      Trigger Stop: 493773764.16   [s; MET]
               UTC: 2016-08-24T23:22:25.352360    [includes UTCF correction]
       Where From?: TDRSS position message

  BAT
    RA: 80.0777395894866   Dec: 40.040385833891  [deg; J2000]

     Catalogged Source?: NO
     Point Source?:      YES
     GRB Indicated?:     YES    [ by BAT flight software ]
     Image S/N Ratio:    8.84
     Image Trigger?:     NO
     Rate S/N Ratio:     18.4390889145858  [ if not an image trigger ]
     Image S/N Ratio:    8.84

  Analysis Position:   [ source = BAT ]
    RA: 80.0777395894866   Dec: 40.040385833891  [deg; J2000]

  Refined Position:   [ source = BAT pre-slew burst ]
    RA: 80.0869025083955   Dec: 40.0389958214833  [deg; J2000]
        { 05h 20m 20.9s , +40d 02' 20.4" }
         +/- 1.18539004731115 [arcmin] (estimated 90% radius based on SNR)
         +/- 0.495869787561142 [arcmin] (formal 1-sigma fit error)
    SNR: 23.856255128993

  Angular difference between the analysis and refined position is 0.429090 arcmin

  Partial Coding Fraction: 0.5546875    [ including projection effects ]

  Duration
     T90: 99.3319999575615 +/- 7.8777916000799
        Measured from: 1.34399998188019
                   to: 100.675999939442     [s; relative to TRIGTIME]
     T50: 41.6719999909401 +/- 14.6916827472663
        Measured from: 8.11599999666214
                   to: 49.7879999876022     [s; relative to TRIGTIME]


  Fluence
     Peak Flux  (peak 1 second)
        Measured from: 4.88400000333786
                   to: 5.88400000333786     [s; relative to TRIGTIME]
     Total Fluence
        Measured from: -0.659999966621399
                   to: 111.576000034809     [s; relative to TRIGTIME]

             Band 1     Band 2     Band 3     Band 4
              15-25      25-50     50-100    100-350     keV
 Total     1.308048   1.487486   1.078640   0.272890
           0.075890   0.078702   0.068235   0.057832 [error]
 Peak      0.048205   0.050028   0.053246   0.025470
           0.008784   0.009820   0.009214   0.007374 [error]

     [ fluence units of on-axis counts / fully illuminated detector ]

======================================================================


====== Table of the duration information =============================

        Value   tstart    tstop
T100  112.236   -0.660  111.576
T90    99.332    1.344  100.676
T50    41.672    8.116   49.788
Peak    1.000    4.884    5.884


====== Spectral Analysis Summary =====================================

Model      : spectral model: simple power-law (PL) and cutoff power-law (CPL)
Ph_index   : photon index: E^{Ph_index}
Ph_90err   : 90% error of the photon index
Epeak      : Epeak in keV
Epeak_90err: 90% error of Epeak
Norm       : normalization at 50 keV in both the PL model and CPL model
Nomr_90err : 90% error of the normalization
chi2       : Chi-Squared
dof        : degree of freedo

=== Time-averaged spectral analysis ===
(Best model with acceptable fit: PL)

Model Ph_index Ph_90err_low Ph_90err_hi  Epeak  Epeak_90err_low  Epeak_90err_hi  Norm       Nomr_90err_low    Norm_90err_hi    chi2    dof
PL      -1.618    -0.108      0.107       -           -               -         2.40e-03     -1.45e-04          1.44e-04      65.030   57
CPL     -1.598    -0.128      0.319      962.064    -962.064      -962.064      2.46e-03     -1.99e-04          8.42e-05      65.090   56


=== 1-s peak spectral analysis ===
(Best model with acceptable fit: PL)

Model Ph_index Ph_90err_low Ph_90err_hi  Epeak  Epeak_90err_low  Epeak_90err_hi  Norm       Nomr_90err_low    Norm_90err_hi    chi2    dof
PL      -1.301     -0.320     0.321       -           -               -         1.11e-02     -1.96e-03          1.95e-03      68.310   57
CPL     -1.307     -0.312     0.333     9999.320    -9999.320      -9999.320      1.12e-02     -1.96e-03          1.59e-02      68.320   56


=== Fluence/Peak Flux Summary ===

              Model    Band1     Band2     Band3     Band4     Band5     Total
                       15-25     25-50    50-100    100-350    15-150    15-350    keV
Fluence         PL   3.85e-07  6.58e-07  8.57e-07  2.26e-06  2.52e-06  4.16e-06   erg/cm2
      90%_error_low -3.83e-08 -3.95e-08 -6.92e-08 -3.72e-07 -1.62e-07 -4.29e-07   erg/cm2
      90%_error_hi   3.94e-08  3.94e-08  6.90e-08  4.20e-07  1.63e-07  4.67e-07   erg/cm2
Peak flux       PL   3.79e-01  4.29e-01  3.48e-01  4.72e-01  1.33e+00  1.63e+00   ph/cm2/s
      90%_error_low -1.18e-01 -8.58e-02 -7.64e-02 -1.87e-01 -2.36e-01 -2.97e-01   ph/cm2/s
      90%_error_hi   1.29e-01  8.33e-02  7.42e-02  2.52e-01  2.37e-01  3.05e-01   ph/cm2/s

Fluence        CPL   3.86e-07  6.54e-07  8.54e-07  2.41e-06  2.53e-06  4.35e-06   erg/cm2
      90%_error_low -4.39e-08 -4.22e-08 -8.83e-08    N/A    -2.17e-07 -1.14e-06   erg/cm2
      90%_error_hi   3.95e-08  5.44e-08  9.36e-08    N/A     1.91e-07  3.68e-08   erg/cm2
Peak flux      CPL   3.79e-01  4.29e-01  3.46e-01  5.22e-01  1.34e+00  1.64e+00   ph/cm2/s
      90%_error_low     N/A   -8.60e-02 -7.46e-02     N/A   -2.97e-01 -3.83e-01   ph/cm2/s
      90%_error_hi      N/A    8.52e-02  7.82e-02     N/A    2.80e-01  2.69e-01   ph/cm2/s

======================================================================
Image
Pre-slew 15.0-350.0 keV image (Event data)

#   RAcent    DECcent   POSerr    Theta     Phi              Peak Cts       SNR   Name
   80.0869    40.0390   0.0081    31.0893    35.1676         2.3456540     23.856 TRIG_00709765

Foreground time interval of the image:
 -0.660  28.789 (delta_t =  29.449 [sec])
Background time interval of the image:
-146.811  -0.660 (delta_t = 146.151 [sec])
Light Curves
Note: The mask-weighted lightcurves have units of either count/det or counts/sec/det, where a det is 0.4 x 0.4 = 0.16 sq cm.
Full-time range; 1 s binning
Other quick-look light curves:
- 64 ms binning (zoomed)
- 16 ms binning (zoomed)
- 8 ms binning (zoomed)
- 2 ms binning (zoomed)
- SN=5 or 10 s binning (full-time range)
- Raw light curve
Spectra
- 64 ms binning (zoomed)
- 16 ms binning (zoomed)
- 8 ms binning (zoomed)
- 2 ms binning (zoomed)
- SN=5 or 10 s binning (full-time range)
- Raw light curve
Spectra
Notes:
- 1) The fitting includes the systematic errors.
- 2) When the burst includes telescope slew time periods, the fitting uses an average response file made from multiple 5-s response files through out the slew time plus single time preiod for the non-slew times, and weighted by the total counts in the corresponding time period using addrmf. An average response file is needed becuase a spectral fit using the pre-slew DRM will introduce some errors in both a spectral shape and a normalization if the PHA file contains a lot of the slew/post-slew time interval.
- 3) For fits to more complicated models (e.g. a power-law over a cutoff power-law), the BAT team has decided to require a chi-square improvement of more than 6 for each extra dof.
Time averaged spectrum fit using the average DRM
Power-law model

Time interval is from   -0.660 sec. to  111.576 sec.

Spectral model in power-law:
------------------------------------------------------------
Parameters  : value       lower 90%   higher 90%
Photon index: -1.61837     ( -0.108129   0.107366 )
Norm@50keV  : 2.40269E-03    ( -0.000144716   0.000143949 )
------------------------------------------------------------
#Fit statistic : Chi-Squared =          65.03 using 59 PHA bins.
# Reduced chi-squared =          1.141 for     57 degrees of freedom
# Null hypothesis probability =   2.173815e-01

Photon flux (15-150 keV)    in 112.2 sec: 0.310550 ( -0.018474  0.018516 ) ph/cm2/s
Energy fluence (15-150 keV)             : 2.51607e-06 ( -1.6231e-07  1.6342e-07 ) ergs/cm2
Cutoff power-law model

Time interval is from   -0.660 sec. to  111.576 sec.
Spectral model in the cutoff power-law:
------------------------------------------------------------
Parameters  : value       lower 90%   higher 90%
Photon index: -1.61651     ( -0.128461   0.31938 )
Epeak [keV] : 1.00000E+04      ( -10000 -10000 )
Norm@50keV  : 2.40816E-03    ( -0.000145536   0.000138004 )
------------------------------------------------------------
#Fit statistic : Chi-Squared =          65.03 using 59 PHA bins.
# Reduced chi-squared =          1.161 for     56 degrees of freedom
# Null hypothesis probability =   1.911067e-01

Photon flux (15-150 keV)    in 112.2 sec: 0.311586 ( -0.02318  0.020562 ) ph/cm2/s
Energy fluence (15-150 keV)             : 2.52908e-06 ( -2.16678e-07  1.91385e-07 ) ergs/cm2
1-s peak spectrum fit
Power-law model

Time interval is from    4.884 sec. to    5.884 sec.

Spectral model in power-law:
------------------------------------------------------------
Parameters  : value       lower 90%   higher 90%
Photon index: -1.30079     ( -0.319751   0.321238 )
Norm@50keV  : 1.11372E-02    ( -0.00196196   0.00195453 )
------------------------------------------------------------
#Fit statistic : Chi-Squared =          68.31 using 59 PHA bins.
# Reduced chi-squared =          1.198 for     57 degrees of freedom
# Null hypothesis probability =   1.451235e-01

Photon flux (15-150 keV)    in 1 sec: 1.32891 ( -0.23613  0.23674 ) ph/cm2/s
Energy fluence (15-150 keV)             : 1.10047e-07 ( -2.18914e-08  2.21556e-08 ) ergs/cm2
Cutoff power-law model

Time interval is from    4.884 sec. to    5.884 sec.
Spectral model in the cutoff power-law:
------------------------------------------------------------
Parameters  : value       lower 90%   higher 90%
Photon index: -1.30681     ( -0.313039   0.332326 )
Epeak [keV] : 9999.32      ( -9999.36 -9999.36 )
Norm@50keV  : 1.11734E-02    ( -0.00196662   0.015852 )
------------------------------------------------------------
#Fit statistic : Chi-Squared =          68.32 using 59 PHA bins.
# Reduced chi-squared =          1.220 for     56 degrees of freedom
# Null hypothesis probability =   1.250606e-01

Photon flux (15-150 keV)    in 1 sec: 1.33765 ( -0.29727  0.2801 ) ph/cm2/s
Energy fluence (15-150 keV)             : 1.10632e-07 ( 0  0 ) ergs/cm2
Time-resolved spectra

Distribution
T90 vs. Hardness ratio plot
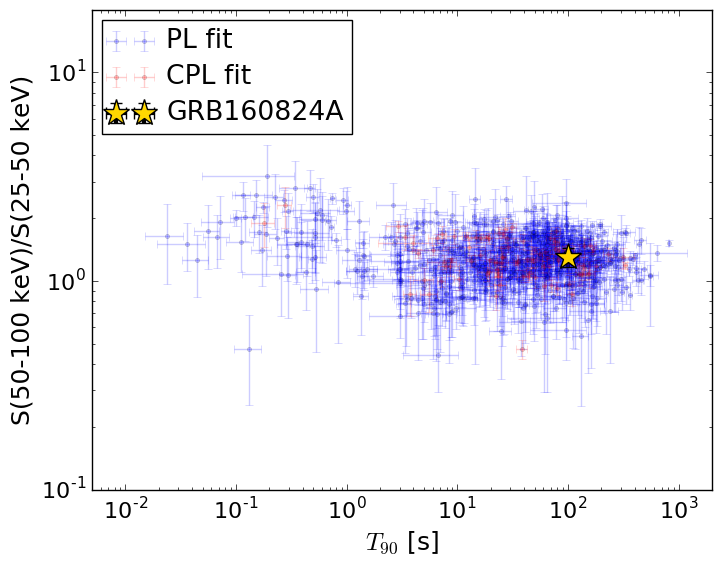
T90                                   = 99.332 sec.
Hardness ratio (energy fluence ratio) = 1.30286653739
S(15-50 keV) vs. S(50-150 keV) plot

S(15-50 keV)  = 1.0423477e-06
S(50-150 keV) = 1.4737237e-06
The dash-dotted line and the dashed line traces the fluences calculated from the Band function with Epeak = 15 and 150 keV, respectively. Both lines assume a canonical values of alpha = -1 and beta = -2.5.
Mask shadow pattern

IMX = 4.929225329358100E-01, IMY = -3.473012831761868E-01
Spacecraft aspect plot
Bright source in the pre-burst/pre-slew/post-slew images
Pre-burst image of 15-350 keV band
Time interval of the image:
-146.811400 -0.660000

# RAcent  DECcent POSerr Theta    Phi  PeakCts   SNR AngSep     Name
#  [deg]    [deg]    ['] [deg]  [deg]                   [']
 83.6168  22.0019    0.7  44.2   14.0   5.1797  17.6    1.2	Crab
 52.2664  47.5676    2.9  40.9   67.9   2.5201   3.9 ------	UNKNOWN
 64.3524  25.9365    3.9  50.3   37.2   2.2480   3.0 ------	UNKNOWN
 76.4071  33.7975    2.4  37.7   32.0   1.2838   4.9 ------	UNKNOWN
 87.6230   5.5488    2.4  57.7    0.8   4.0261   4.7 ------	UNKNOWN
166.0205  30.0269    2.4  41.4 -107.9   3.7242   4.7 ------	UNKNOWN
135.6008  13.9064    2.6  44.7  -60.0   3.3103   4.4 ------	UNKNOWN
Pre-slew background subtracted image of 15-350 keV band
Time interval of the image:
-0.660000 28.788640

# RAcent  DECcent POSerr Theta    Phi  PeakCts   SNR AngSep     Name
#  [deg]    [deg]    ['] [deg]  [deg]                   [']
 83.5586  22.0291    4.3  44.2   14.1   0.3698   2.7    4.2	Crab
 80.0869  40.0390    0.5  31.1   35.2   2.3458  23.9 ------	UNKNOWN
 82.9711  29.5641    2.3  38.0   20.5   0.5549   5.0 ------	UNKNOWN
Post-slew image of 15-350 keV band
Time interval of the image:
79.988590 963.020900

# RAcent  DECcent POSerr Theta    Phi  PeakCts   SNR AngSep     Name
#  [deg]    [deg]    ['] [deg]  [deg]                   [']
 83.6318  22.0186    0.2  18.3  -12.2  35.5231  54.7    0.3	Crab
 33.2926  40.8534    3.4  35.2  105.2   5.4773   3.4 ------	UNKNOWN
 71.7423  -9.3076    3.6  49.9    9.1   5.2735   3.2 ------	UNKNOWN
 93.8985 -15.0876    3.2  56.6  -17.7   8.9527   3.6 ------	UNKNOWN
101.3657 -15.2987    3.4  58.8  -25.8  15.9096   3.8 ------	UNKNOWN
101.6009 -15.3012    4.1  58.8  -26.1  15.8560   3.7 ------	UNKNOWN
111.8976  -1.4303    2.5  50.6  -44.7  17.7583   4.6 ------	UNKNOWN