Analysis Summary
Notes:
- 1) No attempt has been made to eliminate the non-significant decimal places.
- 2) This batgrbproduct analysis is done using the HEASARC data.
- 3) This batgrbproduct analysis is using the flight position for the mask-weighting calculation.
======================================================================
                  BAT GRB EVENT DATA PROCESSING REPORT
    Process Script Ver: batgrbproduct v2.46
    Process Start Time: Thu Oct  6 13:59:21 EDT 2016
             Host Name: bat1
   Current Working Dir: /local/data/bat1/alien/Swift_3rdBATcatalog/event/batevent_reproc/trigger711084
======================================================================

  Trigger: 00711084      Segment: 000

  BAT Trigger Time: 494767155.2   [s; MET]
      Trigger Stop: 494767156.224   [s; MET]
               UTC: 2016-09-05T11:18:58.384380    [includes UTCF correction]
       Where From?: TDRSS position message

  BAT
    RA: 162.236616675553   Dec: -50.8000612070971  [deg; J2000]

     Catalogged Source?: NO
     Point Source?:      YES
     GRB Indicated?:     YES    [ by BAT flight software ]
     Image S/N Ratio:    16.29
     Image Trigger?:     NO
     Rate S/N Ratio:     42.5910788780937  [ if not an image trigger ]
     Image S/N Ratio:    16.29

  Analysis Position:   [ source = BAT ]
    RA: 162.236616675553   Dec: -50.8000612070971  [deg; J2000]

  Refined Position:   [ source = BAT pre-slew burst ]
    RA: 162.249091581177   Dec: -50.8025439479838  [deg; J2000]
        { 10h 48m 59.8s , -50d 48' 09.2" }
         +/- 0.551085651758628 [arcmin] (estimated 90% radius based on SNR)
         +/- 0.158843634107766 [arcmin] (formal 1-sigma fit error)
    SNR: 71.2533642703155

  Angular difference between the analysis and refined position is 0.495957 arcmin

  Partial Coding Fraction: 0.984375    [ including projection effects ]

  Duration
     T90: 64 +/- 16
        Measured from: -15.1999999880791
                   to: 48.8000000119209     [s; relative to TRIGTIME]
     T50: 16 +/- 16
        Measured from: 0.800000011920929
                   to: 16.8000000119209     [s; relative to TRIGTIME]


  Fluence
     Peak Flux  (peak 1 second)
        Measured from: 8.30000001192093
                   to: 9.30000001192093     [s; relative to TRIGTIME]
     Total Fluence
        Measured from: -15.1999999880791
                   to: 96.8000000119209     [s; relative to TRIGTIME]

             Band 1     Band 2     Band 3     Band 4
              15-25      25-50     50-100    100-350     keV
 Total     3.928226   7.178737   7.701413   2.800258
           0.075727   0.079604   0.074580   0.061883 [error]
 Peak      0.147496   0.269385   0.312736   0.130626
           0.009322   0.011083   0.011679   0.009785 [error]

     [ fluence units of on-axis counts / fully illuminated detector ]

======================================================================


====== Table of the duration information =============================

        Value   tstart    tstop
T100  112.000  -15.200   96.800
T90    64.000  -15.200   48.800
T50    16.000    0.800   16.800
Peak    1.000    8.300    9.300


====== Spectral Analysis Summary =====================================

Model      : spectral model: simple power-law (PL) and cutoff power-law (CPL)
Ph_index   : photon index: E^{Ph_index}
Ph_90err   : 90% error of the photon index
Epeak      : Epeak in keV
Epeak_90err: 90% error of Epeak
Norm       : normalization at 50 keV in both the PL model and CPL model
Nomr_90err : 90% error of the normalization
chi2       : Chi-Squared
dof        : degree of freedo

=== Time-averaged spectral analysis ===
(Best model with acceptable fit: PL)

Model Ph_index Ph_90err_low Ph_90err_hi  Epeak  Epeak_90err_low  Epeak_90err_hi  Norm       Nomr_90err_low    Norm_90err_hi    chi2    dof
PL      -0.961    -0.029      0.030       -           -               -         1.26e-02     -2.09e-04          2.08e-04      40.950   57
CPL     -0.956    -0.028      0.032     9999.360    -9999.360      -9999.360      1.27e-02     -1.81e-04          1.21e-03      41.020   56


=== 1-s peak spectral analysis ===
(Best model with acceptable fit: PL)

Model Ph_index Ph_90err_low Ph_90err_hi  Epeak  Epeak_90err_low  Epeak_90err_hi  Norm       Nomr_90err_low    Norm_90err_hi    chi2    dof
PL      -0.877     -0.077     0.078       -           -               -         5.44e-02     -2.31e-03          2.31e-03      67.780   57
CPL     -0.871     -0.077     0.079     9999.360    -9999.360      -9999.360      5.48e-02     -2.29e-03          1.81e-02      67.780   56


=== Fluence/Peak Flux Summary ===

              Model    Band1     Band2     Band3     Band4     Band5     Total
                       15-25     25-50    50-100    100-350    15-150    15-350    keV
Fluence         PL   1.09e-06  2.79e-06  5.74e-06  2.99e-05  1.55e-05  3.96e-05   erg/cm2
      90%_error_low -4.08e-08 -6.17e-08 -8.83e-08 -1.14e-06 -2.36e-07 -1.15e-06   erg/cm2
      90%_error_hi   4.15e-08  6.17e-08  8.83e-08  1.17e-06  2.36e-07  1.18e-06   erg/cm2
Peak flux       PL   1.24e+00  1.81e+00  1.97e+00  4.01e+00  6.24e+00  9.02e+00   ph/cm2/s
      90%_error_low -1.11e-01 -9.79e-02 -9.07e-02 -4.02e-01 -2.65e-01 -4.51e-01   ph/cm2/s
      90%_error_hi   1.14e-01  9.72e-02  9.03e-02  4.32e-01  2.65e-01  4.63e-01   ph/cm2/s

Fluence        CPL   1.09e-06  2.79e-06  5.74e-06  2.97e-05  1.55e-05  3.97e-05   erg/cm2
      90%_error_low    N/A    -7.00e-08 -8.77e-08    N/A       N/A    -3.19e-06   erg/cm2
      90%_error_hi     N/A     6.98e-08  1.07e-07    N/A       N/A     1.65e-06   erg/cm2
Peak flux      CPL   1.24e+00  1.81e+00  1.97e+00  3.99e+00  6.24e+00  9.00e+00   ph/cm2/s
      90%_error_low -1.19e-01 -9.12e-02 -9.00e-02 -1.09e+00 -2.70e-01 -1.11e+00   ph/cm2/s
      90%_error_hi   8.22e-02  9.38e-02  5.63e-02  2.51e-01  2.64e-01  4.28e-01   ph/cm2/s

======================================================================
Image
Pre-slew 15.0-350.0 keV image (Event data)
#   RAcent    DECcent   POSerr    Theta     Phi              Peak Cts       SNR   Name
  162.2491   -50.8025   0.0027     9.3791   -70.6202         8.7556164     71.253 TRIG_00711084

Foreground time interval of the image:
-15.200  11.701 (delta_t =  26.901 [sec])
Background time interval of the image:
-46.899 -15.200 (delta_t =  31.699 [sec])
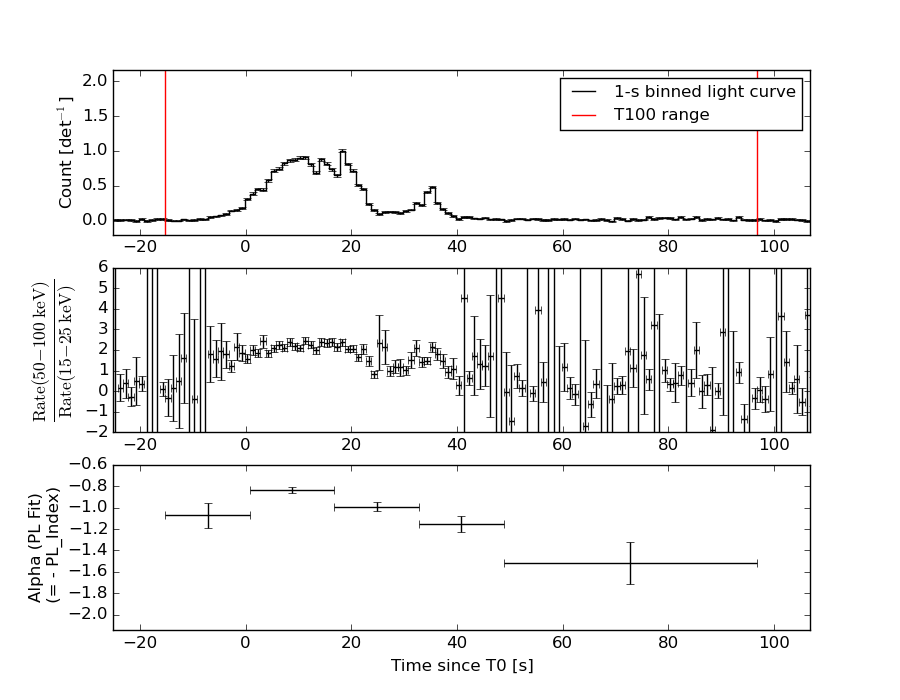
Light Curves
Note: The mask-weighted lightcurves have units of either count/det or counts/sec/det, where a det is 0.4 x 0.4 = 0.16 sq cm.
Full-time range; 1 s binning
Other quick-look light curves:
- 64 ms binning (zoomed)
- 16 ms binning (zoomed)
- 8 ms binning (zoomed)
- 2 ms binning (zoomed)
- SN=5 or 10 s binning (full-time range)
- Raw light curve
Spectra
- 64 ms binning (zoomed)
- 16 ms binning (zoomed)
- 8 ms binning (zoomed)
- 2 ms binning (zoomed)
- SN=5 or 10 s binning (full-time range)
- Raw light curve
Spectra
Notes:
- 1) The fitting includes the systematic errors.
- 2) When the burst includes telescope slew time periods, the fitting uses an average response file made from multiple 5-s response files through out the slew time plus single time preiod for the non-slew times, and weighted by the total counts in the corresponding time period using addrmf. An average response file is needed becuase a spectral fit using the pre-slew DRM will introduce some errors in both a spectral shape and a normalization if the PHA file contains a lot of the slew/post-slew time interval.
- 3) For fits to more complicated models (e.g. a power-law over a cutoff power-law), the BAT team has decided to require a chi-square improvement of more than 6 for each extra dof.
Time averaged spectrum fit using the average DRM
Power-law model
Time interval is from  -15.200 sec. to   96.800 sec.

Spectral model in power-law:
------------------------------------------------------------
Parameters  : value       lower 90%   higher 90%
Photon index: -0.960998     ( -0.0294516   0.0296052 )
Norm@50keV  : 1.26088E-02    ( -0.000209253   0.00020834 )
------------------------------------------------------------
#Fit statistic : Chi-Squared =          40.95 using 59 PHA bins.
# Reduced chi-squared =         0.7185 for     57 degrees of freedom
# Null hypothesis probability =   9.461659e-01

Photon flux (15-150 keV)    in 112 sec: 1.44914 ( -0.02466  0.02475 ) ph/cm2/s
Energy fluence (15-150 keV)             : 1.54888e-05 ( -2.3572e-07  2.36089e-07 ) ergs/cm2
Cutoff power-law model
Time interval is from  -15.200 sec. to   96.800 sec.
Spectral model in the cutoff power-law:
------------------------------------------------------------
Parameters  : value       lower 90%   higher 90%
Photon index: -0.955654     ( -0.0289528   0.0310547 )
Epeak [keV] : 9999.36      ( -9999.36 -9999.36 )
Norm@50keV  : 1.26685E-02    ( -0.000198012   0.00119227 )
------------------------------------------------------------
#Fit statistic : Chi-Squared =          41.02 using 59 PHA bins.
# Reduced chi-squared =         0.7326 for     56 degrees of freedom
# Null hypothesis probability =   9.333062e-01

Photon flux (15-150 keV)    in 112 sec: 1.44846 (    ) ph/cm2/s
Energy fluence (15-150 keV)             : 1.54921e-05 ( 0  0 ) ergs/cm2
1-s peak spectrum fit
Power-law model
Time interval is from    8.300 sec. to    9.300 sec.

Spectral model in power-law:
------------------------------------------------------------
Parameters  : value       lower 90%   higher 90%
Photon index: -0.876931     ( -0.0768803   0.0776683 )
Norm@50keV  : 5.43900E-02    ( -0.00231502   0.00230877 )
------------------------------------------------------------
#Fit statistic : Chi-Squared =          67.78 using 59 PHA bins.
# Reduced chi-squared =          1.189 for     57 degrees of freedom
# Null hypothesis probability =   1.553271e-01

Photon flux (15-150 keV)    in 1 sec: 6.24220 ( -0.26496  0.26515 ) ph/cm2/s
Energy fluence (15-150 keV)             : 6.16013e-07 ( -2.92131e-08  2.93142e-08 ) ergs/cm2
Cutoff power-law model
Time interval is from    8.300 sec. to    9.300 sec.
Spectral model in the cutoff power-law:
------------------------------------------------------------
Parameters  : value       lower 90%   higher 90%
Photon index: -0.870958     ( -0.0770835   0.0786195 )
Epeak [keV] : 9999.36      ( -9999.36 -9999.36 )
Norm@50keV  : 5.47553E-02    ( -0.0022932   0.0181055 )
------------------------------------------------------------
#Fit statistic : Chi-Squared =          67.78 using 59 PHA bins.
# Reduced chi-squared =          1.210 for     56 degrees of freedom
# Null hypothesis probability =   1.344020e-01

Photon flux (15-150 keV)    in 1 sec: 6.24163 ( -0.27017  0.26434 ) ph/cm2/s
Energy fluence (15-150 keV)             : 6.16042e-07 ( -2.84579e-08  2.65125e-08 ) ergs/cm2
Time-resolved spectra
Distribution
T90 vs. Hardness ratio plot
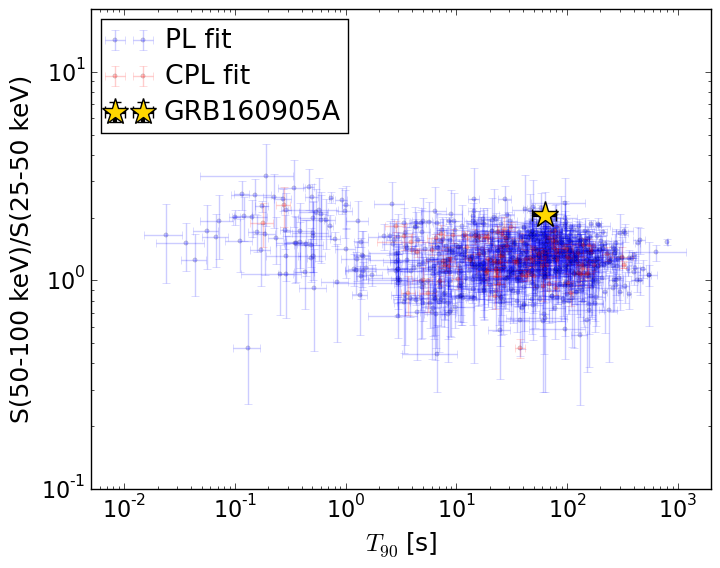
T90                                   = 64.0 sec.
Hardness ratio (energy fluence ratio) = 2.05484992605
S(15-50 keV) vs. S(50-150 keV) plot
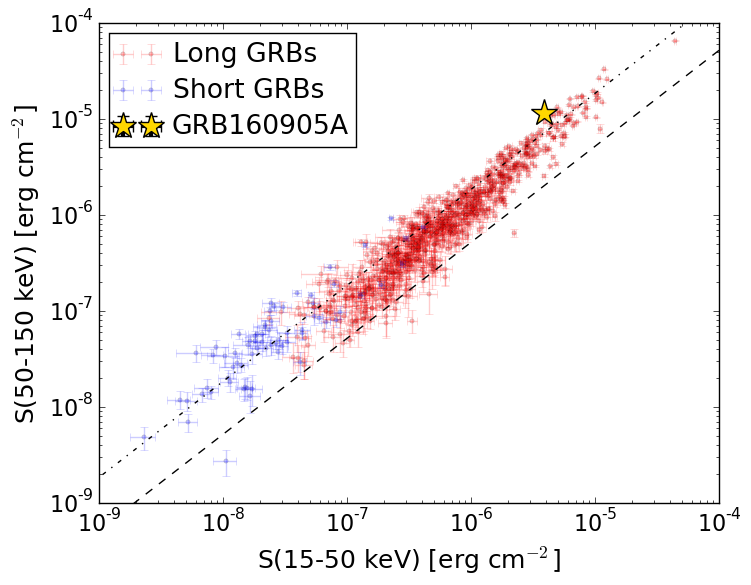
S(15-50 keV)  = 3.885773e-06
S(50-150 keV) = 1.1603007e-05
The dash-dotted line and the dashed line traces the fluences calculated from the Band function with Epeak = 15 and 150 keV, respectively. Both lines assume a canonical values of alpha = -1 and beta = -2.5.
Mask shadow pattern
IMX = 5.480983421668502E-02, IMY = 1.558160213670279E-01
Spacecraft aspect plot
Bright source in the pre-burst/pre-slew/post-slew images
Pre-burst image of 15-350 keV band
Time interval of the image:
-46.899410 -15.200000

# RAcent  DECcent POSerr Theta    Phi  PeakCts   SNR AngSep     Name
#  [deg]    [deg]    ['] [deg]  [deg]                   [']
135.5392 -40.5670   33.0  20.8 -150.3  -0.0226  -0.3    0.9	Vela X-1
170.4790 -60.4828   10.0   9.4   -0.6   0.0698   1.2    9.7	Cen X-3
186.6487 -62.7871    0.7  17.1    7.9   1.0623  16.3    1.0	GX 301-2
277.2690 -67.1152    1.7  48.1   43.0   1.8756   6.6 ------	UNKNOWN
 64.9869 -82.1133    2.4  32.2   83.3   0.6228   4.8 ------	UNKNOWN
 95.5514 -41.1415    2.7  39.2  158.8   0.5058   4.3 ------	UNKNOWN
235.4117 -49.1799    2.7  46.6    5.3   0.5647   4.4 ------	UNKNOWN
162.2340 -50.8786    3.0   9.3  -70.4   0.2434   3.8 ------	UNKNOWN
123.5295 -18.8997    2.3  44.7 -152.2   0.6099   5.0 ------	UNKNOWN
155.6569 -17.1857    2.2  41.2 -107.0   1.4201   5.3 ------	UNKNOWN
Pre-slew background subtracted image of 15-350 keV band
Time interval of the image:
-15.200000 11.700600

# RAcent  DECcent POSerr Theta    Phi  PeakCts   SNR AngSep     Name
#  [deg]    [deg]    ['] [deg]  [deg]                   [']
135.2537 -40.5888    0.0  20.8 -150.9   0.1381   1.1   12.7	Vela X-1
170.1153 -60.4631    6.5   9.2   -0.6   0.2242   1.8   11.3	Cen X-3
186.7632 -62.9079    9.6  17.2    8.3  -0.1469  -1.2    8.8	GX 301-2
 13.1172 -82.5260    2.8  37.6   76.4   1.5647   4.1 ------	UNKNOWN
190.5116 -64.4560    2.0  18.9   13.2   0.7183   5.7 ------	UNKNOWN
162.2491 -50.8025    0.2   9.4  -70.6   8.7556  71.3 ------	UNKNOWN
123.1022 -23.1578    2.4  40.9 -155.1   0.9148   4.9 ------	UNKNOWN
Post-slew image of 15-350 keV band
Time interval of the image:
46.100590 962.819700

# RAcent  DECcent POSerr Theta    Phi  PeakCts   SNR AngSep     Name
#  [deg]    [deg]    ['] [deg]  [deg]                   [']
135.7401 -40.5579   10.3  21.0 -163.7   0.8818   1.1    9.6	Vela X-1
170.3339 -60.7723    7.6  10.9   66.2   1.1293   1.5    9.0	Cen X-3
186.6551 -62.7760    0.3  17.7   49.1  33.1988  42.3    0.3	GX 301-2
139.3256 -14.4769    3.4  40.8 -127.9   5.8790   3.5 ------	UNKNOWN
215.3497 -10.8084    3.3  58.8  -25.9  18.8528   3.6 ------	UNKNOWN
152.0162 -10.1991    3.9  41.5 -107.9  13.0771   3.0 ------	UNKNOWN
197.8678  -9.4917    3.5  50.6  -44.6  15.9415   3.3 ------	UNKNOWN
135.7342  -8.1035    3.8  48.0 -129.1  13.0201   3.0 ------	UNKNOWN