Analysis Summary
Notes:
- 1) No attempt has been made to eliminate the non-significant decimal places.
- 2) This batgrbproduct analysis is done using the HEASARC data.
- 3) This batgrbproduct analysis is using the flight position for the mask-weighting calculation.
======================================================================
BAT GRB EVENT DATA PROCESSING REPORT
Process Script Ver: batgrbproduct v2.46
Process Start Time: Thu Oct 6 15:25:31 EDT 2016
Host Name: bat1
Current Working Dir: /local/data/bat1/alien/Swift_3rdBATcatalog/event/batevent_reproc/trigger711914
======================================================================
Trigger: 00711914 Segment: 000
BAT Trigger Time: 495389280 [s; MET]
Trigger Stop: 495389344 [s; MET]
UTC: 2016-09-12T16:07:43.149340 [includes UTCF correction]
Where From?: TDRSS position message
BAT
RA: 301.518010297722 Dec: 57.543460509347 [deg; J2000]
Catalogged Source?: NO
Point Source?: YES
GRB Indicated?: YES [ by BAT flight software ]
Image S/N Ratio: 7.97
Image Trigger?: YES
Rate S/N Ratio: 0 [ if not an image trigger ]
Image S/N Ratio: 7.97
Analysis Position: [ source = BAT ]
RA: 301.518010297722 Dec: 57.543460509347 [deg; J2000]
Refined Position: [ source = BAT pre-slew burst ]
RA: 301.605851267266 Dec: 57.5638056226087 [deg; J2000]
{ 20h 06m 25.4s , +57d 33' 49.7" }
+/- 2.35821115181329 [arcmin] (estimated 90% radius based on SNR)
+/- 1.3558636778596 [arcmin] (formal 1-sigma fit error)
SNR: 8.9301220804323
Angular difference between the analysis and refined position is 3.079894 arcmin
Partial Coding Fraction: 0.9609375 [ including projection effects ]
Duration
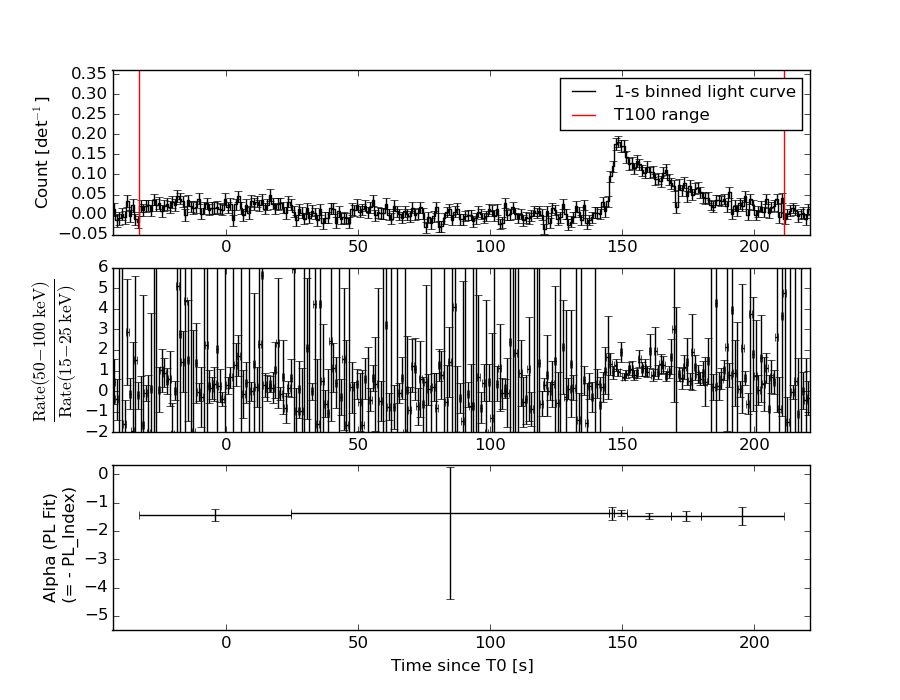
T90: 207.307999968529 +/- 16.0269435733524
Measured from: -20.4480000138283
to: 186.8599999547 [s; relative to TRIGTIME]
T50: 22.4359999895096 +/- 105.830444624765
Measured from: 145.463999986649
to: 167.899999976158 [s; relative to TRIGTIME]
Fluence
Peak Flux (peak 1 second)
Measured from: 148.56400001049
to: 149.56400001049 [s; relative to TRIGTIME]
Total Fluence
Measured from: -33.1119999885559
to: 211.087999999523 [s; relative to TRIGTIME]
Band 1 Band 2 Band 3 Band 4
15-25 25-50 50-100 100-350 keV
Total 1.578017 2.179341 1.768317 0.481266
0.106124 0.113153 0.105087 0.109793 [error]
Peak 0.052537 0.071959 0.062680 0.022365
0.007134 0.008209 0.007661 0.007259 [error]
[ fluence units of on-axis counts / fully illuminated detector ]
======================================================================
====== Table of the duration information =============================
Value tstart tstop
T100 244.200 -33.112 211.088
T90 207.308 -20.448 186.860
T50 22.436 145.464 167.900
Peak 1.000 148.564 149.564
====== Spectral Analysis Summary =====================================
Model : spectral model: simple power-law (PL) and cutoff power-law (CPL)
Ph_index : photon index: E^{Ph_index}
Ph_90err : 90% error of the photon index
Epeak : Epeak in keV
Epeak_90err: 90% error of Epeak
Norm : normalization at 50 keV in both the PL model and CPL model
Nomr_90err : 90% error of the normalization
chi2 : Chi-Squared
dof : degree of freedo
=== Time-averaged spectral analysis ===
(Best model with acceptable fit: PL)
Model Ph_index Ph_90err_low Ph_90err_hi Epeak Epeak_90err_low Epeak_90err_hi Norm Nomr_90err_low Norm_90err_hi chi2 dof
PL -1.435 -0.109 0.108 - - - 1.56e-03 -9.37e-05 9.33e-05 36.820 57
CPL -1.177 -0.310 0.456 158.823 -72.019 -158.823 2.10e-03 -6.10e-04 1.42e-03 35.710 56
=== 1-s peak spectral analysis ===
(Best model with acceptable fit: PL)
Model Ph_index Ph_90err_low Ph_90err_hi Epeak Epeak_90err_low Epeak_90err_hi Norm Nomr_90err_low Norm_90err_hi chi2 dof
PL -1.268 -0.204 0.205 - - - 1.36e-02 -1.57e-03 1.56e-03 53.260 57
CPL -1.262 -0.207 0.355 9999.320 -9999.320 -9999.320 1.36e-02 -1.36e-02 8.26e-03 53.280 56
=== Fluence/Peak Flux Summary ===
Model Band1 Band2 Band3 Band4 Band5 Total
15-25 25-50 50-100 100-350 15-150 15-350 keV
Fluence PL 4.57e-07 8.75e-07 1.29e-06 4.12e-06 3.66e-06 6.74e-06 erg/cm2
90%_error_low -4.68e-08 -5.38e-08 -1.04e-07 -6.80e-07 -2.48e-07 -7.63e-07 erg/cm2
90%_error_hi 4.84e-08 5.36e-08 1.04e-07 7.72e-07 2.50e-07 8.41e-07 erg/cm2
Peak flux PL 4.47e-01 5.16e-01 4.29e-01 6.00e-01 1.61e+00 1.99e+00 ph/cm2/s
90%_error_low -8.87e-02 -6.39e-02 -6.28e-02 -1.66e-01 -1.82e-01 -2.46e-01 ph/cm2/s
90%_error_hi 9.28e-02 6.29e-02 6.20e-02 2.04e-01 1.82e-01 2.54e-01 ph/cm2/s
Fluence CPL 4.37e-07 8.96e-07 1.31e-06 2.72e-06 3.56e-06 5.37e-06 erg/cm2
90%_error_low -5.68e-08 -6.34e-08 -1.08e-07 -1.26e-06 -2.89e-07 -1.29e-06 erg/cm2
90%_error_hi 5.77e-08 6.48e-08 1.10e-07 1.59e-06 2.90e-07 1.66e-06 erg/cm2
Peak flux CPL 4.47e-01 5.17e-01 4.29e-01 5.96e-01 1.62e+00 2.00e+00 ph/cm2/s
90%_error_low N/A N/A -6.28e-02 N/A -2.52e-01 -3.24e-01 ph/cm2/s
90%_error_hi N/A N/A 6.21e-02 N/A 2.34e-01 2.22e-01 ph/cm2/s
======================================================================
Image
Pre-slew 15.0-350.0 keV image (Event data)
#   RAcent    DECcent   POSerr    Theta     Phi              Peak Cts       SNR   Name
  301.6059    57.5638   0.0216    22.3794   -24.9060         1.4323674      8.930 TRIG_00711914

Foreground time interval of the image:
-15.099  73.301 (delta_t =  88.400 [sec])
Background time interval of the image:
Light Curves
Note: The mask-weighted lightcurves have units of either count/det or counts/sec/det, where a det is 0.4 x 0.4 = 0.16 sq cm.
Full-time range; 1 s binning
Other quick-look light curves:
- 64 ms binning (zoomed)
- 16 ms binning (zoomed)
- 8 ms binning (zoomed)
- 2 ms binning (zoomed)
- SN=5 or 10 s binning (full-time range)
- Raw light curve
Spectra
- 64 ms binning (zoomed)
- 16 ms binning (zoomed)
- 8 ms binning (zoomed)
- 2 ms binning (zoomed)
- SN=5 or 10 s binning (full-time range)
- Raw light curve
Spectra
Notes:
- 1) The fitting includes the systematic errors.
- 2) When the burst includes telescope slew time periods, the fitting uses an average response file made from multiple 5-s response files through out the slew time plus single time preiod for the non-slew times, and weighted by the total counts in the corresponding time period using addrmf. An average response file is needed becuase a spectral fit using the pre-slew DRM will introduce some errors in both a spectral shape and a normalization if the PHA file contains a lot of the slew/post-slew time interval.
- 3) For fits to more complicated models (e.g. a power-law over a cutoff power-law), the BAT team has decided to require a chi-square improvement of more than 6 for each extra dof.
Time averaged spectrum fit using the average DRM
Power-law model
Time interval is from  -33.112 sec. to  211.088 sec.

Spectral model in power-law:
------------------------------------------------------------
Parameters  : value       lower 90%   higher 90%
Photon index: -1.43457     ( -0.108985   0.108447 )
Norm@50keV  : 1.55989E-03    ( -9.3659e-05   9.33196e-05 )
------------------------------------------------------------
#Fit statistic : Chi-Squared =          36.82 using 59 PHA bins.
# Reduced chi-squared =         0.6459 for     57 degrees of freedom
# Null hypothesis probability =   9.825965e-01

Photon flux (15-150 keV)    in 244.2 sec: 0.191513 ( -0.011302  0.011314 ) ph/cm2/s
Energy fluence (15-150 keV)             : 3.65616e-06 ( -2.47643e-07  2.50229e-07 ) ergs/cm2
Cutoff power-law model
Time interval is from  -33.112 sec. to  211.088 sec.
Spectral model in the cutoff power-law:
------------------------------------------------------------
Parameters  : value       lower 90%   higher 90%
Photon index: -1.17698     ( -0.309532   0.456159 )
Epeak [keV] : 158.823      ( -72.0188 -158.823 )
Norm@50keV  : 2.10233E-03    ( -0.000609899   0.00141775 )
------------------------------------------------------------
#Fit statistic : Chi-Squared =          35.71 using 59 PHA bins.
# Reduced chi-squared =         0.6377 for     56 degrees of freedom
# Null hypothesis probability =   9.841947e-01

Photon flux (15-150 keV)    in 244.2 sec: 0.188580 ( -0.012259  0.012221 ) ph/cm2/s
Energy fluence (15-150 keV)             : 3.56324e-06 ( -2.89494e-07  2.89726e-07 ) ergs/cm2
1-s peak spectrum fit
Power-law model
Time interval is from  148.564 sec. to  149.564 sec.

Spectral model in power-law:
------------------------------------------------------------
Parameters  : value       lower 90%   higher 90%
Photon index: -1.26758     ( -0.203968   0.204819 )
Norm@50keV  : 1.35623E-02    ( -0.00156648   0.00155734 )
------------------------------------------------------------
#Fit statistic : Chi-Squared =          53.26 using 59 PHA bins.
# Reduced chi-squared =         0.9344 for     57 degrees of freedom
# Null hypothesis probability =   6.160660e-01

Photon flux (15-150 keV)    in 1 sec: 1.60876 ( -0.18182  0.1819 ) ph/cm2/s
Energy fluence (15-150 keV)             : 1.35126e-07 ( -1.82084e-08  1.84842e-08 ) ergs/cm2
Cutoff power-law model
Time interval is from  148.564 sec. to  149.564 sec.
Spectral model in the cutoff power-law:
------------------------------------------------------------
Parameters  : value       lower 90%   higher 90%
Photon index: -1.26195     ( -0.207032   0.355701 )
Epeak [keV] : 9999.32      ( -9999.36 -9999.36 )
Norm@50keV  : 1.36241E-02    ( -0.013623   0.00825932 )
------------------------------------------------------------
#Fit statistic : Chi-Squared =          53.28 using 59 PHA bins.
# Reduced chi-squared =         0.9514 for     56 degrees of freedom
# Null hypothesis probability =   5.784344e-01

Photon flux (15-150 keV)    in 1 sec: 1.61747 ( -0.25174  0.23395 ) ph/cm2/s
Energy fluence (15-150 keV)             : 4.49593e-08 ( 0  0 ) ergs/cm2
Time-resolved spectra
Distribution
T90 vs. Hardness ratio plot
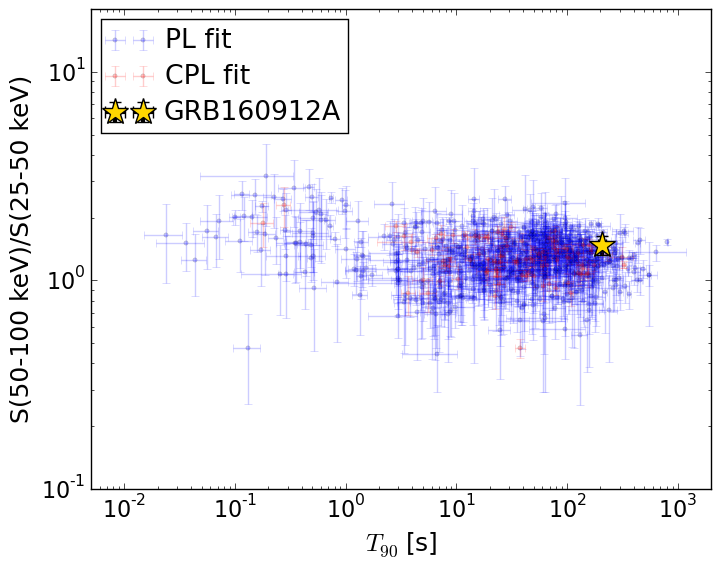
T90                                   = 207.308 sec.
Hardness ratio (energy fluence ratio) = 1.47985799039
S(15-50 keV) vs. S(50-150 keV) plot
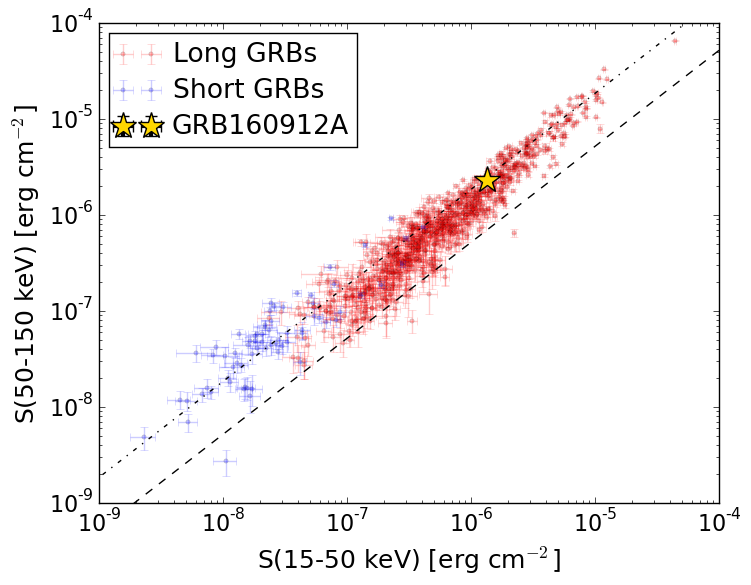
S(15-50 keV)  = 1.3324282e-06
S(50-150 keV) = 2.323739e-06
The dash-dotted line and the dashed line traces the fluences calculated from the Band function with Epeak = 15 and 150 keV, respectively. Both lines assume a canonical values of alpha = -1 and beta = -2.5.
Mask shadow pattern
IMX = 3.734577096126134E-01, IMY = 1.734012259417237E-01
Spacecraft aspect plot
Bright source in the pre-burst/pre-slew/post-slew images
Pre-burst image of 15-350 keV band
Time interval of the image:
Pre-slew background subtracted image of 15-350 keV band
Time interval of the image:
-15.099400 73.300590

# RAcent  DECcent POSerr Theta    Phi  PeakCts   SNR AngSep     Name
#  [deg]    [deg]    ['] [deg]  [deg]                   [']
254.3165  35.4220   26.2  36.6 -104.0   0.1576   0.4    8.4	Her X-1
268.3344  -1.3854    4.6  46.8 -162.5  -0.8111  -2.5    4.5	SW J1753.5-0127
273.9985 -14.1943   23.4  55.0 -177.1  -0.3734  -0.5    9.5	GX 17+2
288.6537  10.8431    4.9  26.3  176.9   0.4009   2.4   10.5	GRS 1915+105
299.6219  35.2040    0.6   0.1   81.4   2.9464  20.4    1.6	Cyg X-1
308.0537  41.1599    0.0   8.9   18.0  -0.0800  -0.5   12.7	Cyg X-3
326.1717  38.3224   15.1  21.5   46.0  -0.1291  -0.8    0.0	Cyg X-2
349.4214  29.1824    2.9  42.2   55.9   2.2970   4.0 ------	UNKNOWN
331.6195  64.4827    2.8  35.0   -4.3   0.7713   4.2 ------	UNKNOWN
301.6058  57.5638    1.3  22.4  -24.9   1.4319   8.9 ------	UNKNOWN
249.1229  41.8426    2.9  39.4  -92.5   2.3144   4.0 ------	UNKNOWN
249.4127  32.3497    2.5  41.3 -106.9   2.7992   4.7 ------	UNKNOWN
Post-slew image of 15-350 keV band
Time interval of the image:
117.900600 337.511500
361.000200 365.720000
421.000000 430.094900
482.000000 482.318100
541.000000 547.816500
601.000000 617.898700
776.000000 778.846500
780.000000 903.088400
920.000000 959.079600

# RAcent  DECcent POSerr Theta    Phi  PeakCts   SNR AngSep     Name
#  [deg]    [deg]    ['] [deg]  [deg]                   [']
254.4901  35.3194   21.0  38.2 -142.1  -0.2501  -0.6    2.1	Her X-1
288.7467  10.8958    6.0  47.7  159.9   1.6248   1.9    4.3	GRS 1915+105
299.6146  35.2089    0.4  22.4  146.9   7.5943  26.6    1.3	Cyg X-1
308.3908  40.9608    0.0  17.2  125.0  -0.5698  -1.9   12.7	Cyg X-3
326.3085  38.3907   16.8  25.1   91.9   0.2761   0.7    7.7	Cyg X-2
318.3591  35.1321    2.8  25.1  108.8   1.4252   4.1 ------	UNKNOWN
 37.4954  52.3703    2.9  50.6   14.5   3.0252   4.1 ------	UNKNOWN
 12.6179  63.3848    3.4  33.7   12.6   1.1204   3.3 ------	UNKNOWN
301.5488  57.5503    0.6   0.0   34.2   4.5918  18.0 ------	UNKNOWN
275.0715  56.1138    2.1  14.5 -121.6   1.4588   5.6 ------	UNKNOWN
100.1020  63.8875    4.3  57.5  -26.2   4.7473   2.9 ------	UNKNOWN
100.2897  63.7649    4.1  57.6  -26.3   5.6368   3.5 ------	UNKNOWN