Analysis Summary
Notes:
- 1) No attempt has been made to eliminate the non-significant decimal places.
- 2) This batgrbproduct analysis is done using the HEASARC data.
- 3) This batgrbproduct analysis is using the flight position for the mask-weighting calculation.
======================================================================
                  BAT GRB EVENT DATA PROCESSING REPORT
    Process Script Ver: batgrbproduct v2.46
    Process Start Time: Thu Oct  6 15:00:40 EDT 2016
             Host Name: bat1
   Current Working Dir: /local/data/bat1/alien/Swift_3rdBATcatalog/event/batevent_reproc/trigger712505
======================================================================

  Trigger: 00712505      Segment: 000

  BAT Trigger Time: 495804636.224   [s; MET]
      Trigger Stop: 495804637.248   [s; MET]
               UTC: 2016-09-17T11:30:19.349940    [includes UTCF correction]
       Where From?: TDRSS position message

  BAT
    RA: 295.670955502867   Dec: 46.398883954926  [deg; J2000]

     Catalogged Source?: NO
     Point Source?:      YES
     GRB Indicated?:     YES    [ by BAT flight software ]
     Image S/N Ratio:    8.62
     Image Trigger?:     NO
     Rate S/N Ratio:     29.2574776766556  [ if not an image trigger ]
     Image S/N Ratio:    8.62

  Analysis Position:   [ source = BAT ]
    RA: 295.670955502867   Dec: 46.398883954926  [deg; J2000]

  Refined Position:   [ source = BAT pre-slew burst ]
    RA: 295.654080243517   Dec: 46.3961822066092  [deg; J2000]
        { 19h 42m 37.0s , +46d 23' 46.3" }
         +/- 1.44555332745446 [arcmin] (estimated 90% radius based on SNR)
         +/- 0.568071181763014 [arcmin] (formal 1-sigma fit error)
    SNR: 17.9679368193235

  Angular difference between the analysis and refined position is 0.716851 arcmin

  Partial Coding Fraction: 0.4375    [ including projection effects ]

  Duration
     T90: 14.5199999809265 +/- 1.8157092352809
        Measured from: 0.0920000076293945
                   to: 14.6119999885559     [s; relative to TRIGTIME]
     T50: 7.85199993848801 +/- 1.59884960337923
        Measured from: 1.87600004673004
                   to: 9.72799998521805     [s; relative to TRIGTIME]


  Fluence
     Peak Flux  (peak 1 second)
        Measured from: -0.0079999566078186
                   to: 0.992000043392181     [s; relative to TRIGTIME]
     Total Fluence
        Measured from: -0.299999952316284
                   to: 15.3080000281334     [s; relative to TRIGTIME]

             Band 1     Band 2     Band 3     Band 4
              15-25      25-50     50-100    100-350     keV
 Total     0.234577   0.472670   0.618579   0.286520
           0.043413   0.046154   0.042504   0.037224 [error]
 Peak      0.056626   0.073315   0.104815   0.043332
           0.011985   0.013315   0.012710   0.011358 [error]

     [ fluence units of on-axis counts / fully illuminated detector ]

======================================================================


====== Table of the duration information =============================

        Value   tstart    tstop
T100   15.608   -0.300   15.308
T90    14.520    0.092   14.612
T50     7.852    1.876    9.728
Peak    1.000   -0.008    0.992


====== Spectral Analysis Summary =====================================

Model      : spectral model: simple power-law (PL) and cutoff power-law (CPL)
Ph_index   : photon index: E^{Ph_index}
Ph_90err   : 90% error of the photon index
Epeak      : Epeak in keV
Epeak_90err: 90% error of Epeak
Norm       : normalization at 50 keV in both the PL model and CPL model
Nomr_90err : 90% error of the normalization
chi2       : Chi-Squared
dof        : degree of freedo

=== Time-averaged spectral analysis ===
(Best model with acceptable fit: PL)

Model Ph_index Ph_90err_low Ph_90err_hi  Epeak  Epeak_90err_low  Epeak_90err_hi  Norm       Nomr_90err_low    Norm_90err_hi    chi2    dof
PL      -0.897    -0.151      0.158       -           -               -         6.95e-03     -6.38e-04          6.28e-04      67.780   57
CPL     -0.815    -0.219      0.616      893.458    -893.458      -893.458      7.51e-03     -9.66e-04          5.59e-03      67.720   56


=== 1-s peak spectral analysis ===
(Best model with acceptable fit: PL)

Model Ph_index Ph_90err_low Ph_90err_hi  Epeak  Epeak_90err_low  Epeak_90err_hi  Norm       Nomr_90err_low    Norm_90err_hi    chi2    dof
PL      -0.862     -0.260     0.281       -           -               -         1.92e-02     -2.92e-03          2.83e-03      45.450   57
CPL     -0.849     -0.269     0.277     9999.240    -9999.240      -9999.240      1.93e-02     -2.63e-03          1.17e-02      45.480   56


=== Fluence/Peak Flux Summary ===

              Model    Band1     Band2     Band3     Band4     Band5     Total
                       15-25     25-50    50-100    100-350    15-150    15-350    keV
Fluence         PL   7.90e-08  2.10e-07  4.52e-07  2.52e-06  1.22e-06  3.26e-06   erg/cm2
      90%_error_low -1.51e-08 -2.52e-08 -3.84e-08 -4.73e-07 -1.03e-07 -4.86e-07   erg/cm2
      90%_error_hi   1.63e-08  2.48e-08  3.83e-08  5.54e-07  1.03e-07  5.56e-07   erg/cm2
Peak flux       PL   4.31e-01  6.35e-01  6.98e-01  1.44e+00  2.20e+00  3.21e+00   ph/cm2/s
      90%_error_low -1.38e-01 -1.32e-01 -9.74e-02 -4.17e-01 -3.25e-01 -4.72e-01   ph/cm2/s
      90%_error_hi   1.56e-01  1.28e-01  9.67e-02  5.32e-01  3.27e-01  5.00e-01   ph/cm2/s

Fluence        CPL   7.71e-08  2.11e-07  4.57e-07  2.28e-06  1.22e-06  3.02e-06   erg/cm2
      90%_error_low -1.95e-08 -2.55e-08 -4.19e-08 -1.10e-06 -1.05e-07 -1.09e-06   erg/cm2
      90%_error_hi   1.51e-08  2.58e-08  4.98e-08  3.73e-07  1.05e-07  3.96e-07   erg/cm2
Peak flux      CPL   4.30e-01  6.36e-01  6.99e-01  1.43e+00  2.20e+00  3.36e+00   ph/cm2/s
      90%_error_low     N/A   -1.28e-01     N/A       N/A   -3.25e-01 -8.08e-01   ph/cm2/s
      90%_error_hi      N/A    1.27e-01     N/A       N/A    3.27e-01  2.84e-01   ph/cm2/s

======================================================================
Image
Pre-slew 15.0-350.0 keV image (Event data)
#   RAcent    DECcent   POSerr    Theta     Phi              Peak Cts       SNR   Name
  295.6541    46.3962   0.0107    41.3133   176.8986         1.6350799     17.968 TRIG_00712505

Foreground time interval of the image:
 -0.300  15.308 (delta_t =  15.608 [sec])
Background time interval of the image:
-125.123  -0.300 (delta_t = 124.823 [sec])
Light Curves
Note: The mask-weighted lightcurves have units of either count/det or counts/sec/det, where a det is 0.4 x 0.4 = 0.16 sq cm.
Full-time range; 1 s binning
Other quick-look light curves:
- 64 ms binning (zoomed)
- 16 ms binning (zoomed)
- 8 ms binning (zoomed)
- 2 ms binning (zoomed)
- SN=5 or 10 s binning (full-time range)
- Raw light curve
Spectra
- 64 ms binning (zoomed)
- 16 ms binning (zoomed)
- 8 ms binning (zoomed)
- 2 ms binning (zoomed)
- SN=5 or 10 s binning (full-time range)
- Raw light curve
Spectra
Notes:
- 1) The fitting includes the systematic errors.
- 2) When the burst includes telescope slew time periods, the fitting uses an average response file made from multiple 5-s response files through out the slew time plus single time preiod for the non-slew times, and weighted by the total counts in the corresponding time period using addrmf. An average response file is needed becuase a spectral fit using the pre-slew DRM will introduce some errors in both a spectral shape and a normalization if the PHA file contains a lot of the slew/post-slew time interval.
- 3) For fits to more complicated models (e.g. a power-law over a cutoff power-law), the BAT team has decided to require a chi-square improvement of more than 6 for each extra dof.
Time averaged spectrum fit using the average DRM
Power-law model
Time interval is from   -0.300 sec. to   15.308 sec.

Spectral model in power-law:
------------------------------------------------------------
Parameters  : value       lower 90%   higher 90%
Photon index: -0.897337     ( -0.150847   0.157757 )
Norm@50keV  : 6.94627E-03    ( -0.000638317   0.000628348 )
------------------------------------------------------------
#Fit statistic : Chi-Squared =          67.78 using 59 PHA bins.
# Reduced chi-squared =          1.189 for     57 degrees of freedom
# Null hypothesis probability =   1.552826e-01

Photon flux (15-150 keV)    in 15.61 sec: 0.797253 ( -0.072782  0.073209 ) ph/cm2/s
Energy fluence (15-150 keV)             : 1.21827e-06 ( -1.03068e-07  1.0334e-07 ) ergs/cm2
Cutoff power-law model

Time interval is from   -0.300 sec. to   15.308 sec.
Spectral model in the cutoff power-law:
------------------------------------------------------------
Parameters  : value       lower 90%   higher 90%
Photon index: -0.814983     ( -0.219265   0.616014 )
Epeak [keV] : 893.458      ( -893.463 -893.463 )
Norm@50keV  : 7.51062E-03    ( -0.000965829   0.00558653 )
------------------------------------------------------------
#Fit statistic : Chi-Squared =          67.72 using 59 PHA bins.
# Reduced chi-squared =          1.209 for     56 degrees of freedom
# Null hypothesis probability =   1.355583e-01

Photon flux (15-150 keV)    in 15.61 sec: 0.794513 ( -0.074971  0.071394 ) ph/cm2/s
Energy fluence (15-150 keV)             : 1.21566e-06 ( -1.0515e-07  1.04639e-07 ) ergs/cm2
1-s peak spectrum fit
Power-law model
Time interval is from   -0.008 sec. to    0.992 sec.

Spectral model in power-law:
------------------------------------------------------------
Parameters  : value       lower 90%   higher 90%
Photon index: -0.862329     ( -0.259662   0.281043 )
Norm@50keV  : 1.92064E-02    ( -0.00291788   0.00282662 )
------------------------------------------------------------
#Fit statistic : Chi-Squared =          45.45 using 59 PHA bins.
# Reduced chi-squared =         0.7973 for     57 degrees of freedom
# Null hypothesis probability =   8.646861e-01

Photon flux (15-150 keV)    in 1 sec: 2.20443 ( -0.32543  0.32728 ) ph/cm2/s
Energy fluence (15-150 keV)             : 2.18796e-07 ( -3.10892e-08  3.11522e-08 ) ergs/cm2
Cutoff power-law model
Time interval is from   -0.008 sec. to    0.992 sec.
Spectral model in the cutoff power-law:
------------------------------------------------------------
Parameters  : value       lower 90%   higher 90%
Photon index: -0.848584     ( -0.268164   0.27734 )
Epeak [keV] : 9999.24      ( -9999.36 -9999.36 )
Norm@50keV  : 1.93016E-02    ( -0.00263873   0.01167 )
------------------------------------------------------------
#Fit statistic : Chi-Squared =          45.48 using 59 PHA bins.
# Reduced chi-squared =         0.8121 for     56 degrees of freedom
# Null hypothesis probability =   8.413939e-01

Photon flux (15-150 keV)    in 1 sec: 2.20388 ( -0.32547  0.32719 ) ph/cm2/s
Energy fluence (15-150 keV)             : 2.19286e-07 ( 0  0 ) ergs/cm2
Time-resolved spectra
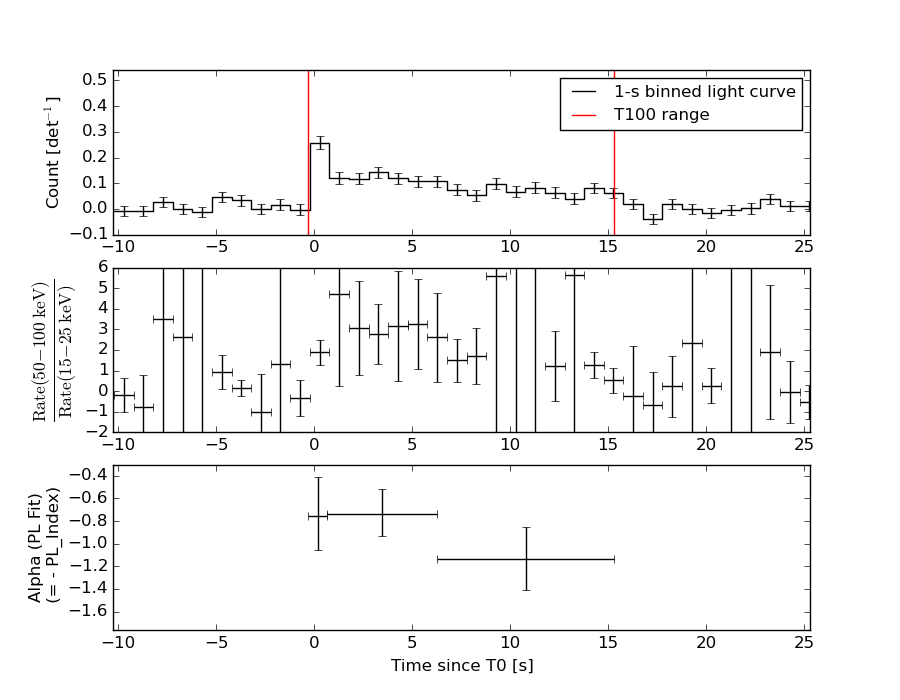
Distribution
T90 vs. Hardness ratio plot

T90                                   = 14.52 sec.
Hardness ratio (energy fluence ratio) = 2.14748427897
S(15-50 keV) vs. S(50-150 keV) plot
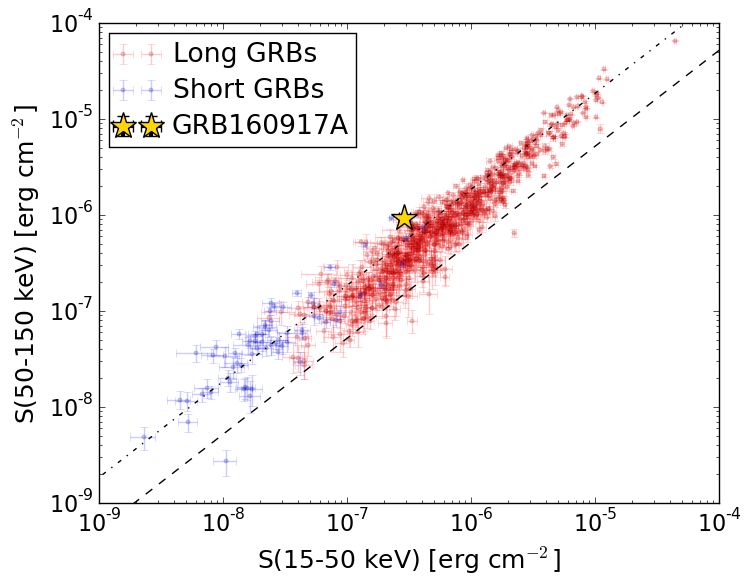
S(15-50 keV)  = 2.8945664e-07
S(50-150 keV) = 9.288247e-07
The dash-dotted line and the dashed line traces the fluences calculated from the Band function with Epeak = 15 and 150 keV, respectively. Both lines assume a canonical values of alpha = -1 and beta = -2.5.
Mask shadow pattern
IMX = -8.776457842954155E-01, IMY = -4.755285116922988E-02
Spacecraft aspect plot
Bright source in the pre-burst/pre-slew/post-slew images
Pre-burst image of 15-350 keV band
Time interval of the image:
-125.123400 -0.300000

# RAcent  DECcent POSerr Theta    Phi  PeakCts   SNR AngSep     Name
#  [deg]    [deg]    ['] [deg]  [deg]                   [']
299.6141  35.1860    1.7  48.7  164.3   3.4771   6.9    1.5	Cyg X-1
308.2060  40.9973    6.5  40.2  160.8   0.4700   1.8    5.1	Cyg X-3
326.3021  38.3408    5.8  34.9  139.1   0.5505   2.0    6.2	Cyg X-2
 57.1171  23.2901    2.7  52.5   13.4   2.2411   4.3 ------	UNKNOWN
352.0345  48.2776    2.4  17.6  110.1   0.7387   4.8 ------	UNKNOWN
 80.8861  43.4681    2.4  45.3  -23.0   1.3153   4.9 ------	UNKNOWN
264.2397  65.4060    2.3  38.7 -143.3   1.2336   5.0 ------	UNKNOWN
Pre-slew background subtracted image of 15-350 keV band
Time interval of the image:
-0.300000 15.308000

# RAcent  DECcent POSerr Theta    Phi  PeakCts   SNR AngSep     Name
#  [deg]    [deg]    ['] [deg]  [deg]                   [']
299.7184  35.1480    7.6  48.7  164.1  -0.2614  -1.5    7.1	Cyg X-1
308.1426  41.1051   18.6  40.1  161.0   0.0579   0.6    9.3	Cyg X-3
325.9244  38.4077   70.2  35.0  139.6   0.0150   0.2   12.7	Cyg X-2
295.6541  46.3962    0.6  41.3  176.9   1.6350  18.0 ------	UNKNOWN
235.8706  62.2913    2.4  48.3 -131.0   1.1727   4.9 ------	UNKNOWN
Post-slew image of 15-350 keV band
Time interval of the image:
80.076580 225.276610

# RAcent  DECcent POSerr Theta    Phi  PeakCts   SNR AngSep     Name
#  [deg]    [deg]    ['] [deg]  [deg]                   [']
254.3087  35.2359  216.2  32.8 -118.9   0.0149   0.1    9.7	Her X-1
268.2811  -1.3953    5.3  53.5 -169.1  -1.2707  -2.2    6.2	SW J1753.5-0127
288.8537  10.9928    4.9  35.9  167.5   0.6144   2.3    4.3	GRS 1915+105
299.5859  35.2050    0.4  11.6  139.9   4.8360  28.3    0.3	Cyg X-1
308.0401  41.0804    3.8  10.4   92.4   0.5245   3.0    8.3	Cyg X-3
326.0625  38.3733    5.5  23.7   74.8   0.4643   2.1    6.0	Cyg X-2
293.9747  -4.9973    2.8  51.4  158.1   3.2054   4.1 ------	UNKNOWN
123.4948  76.0245    3.5  57.5  -26.3   3.3769   3.3 ------	UNKNOWN
188.1043  73.4125    3.0  50.6  -44.6   3.8762   3.8 ------	UNKNOWN