Analysis Summary
Notes:
- 1) No attempt has been made to eliminate the non-significant decimal places.
- 2) This batgrbproduct analysis is done using the HEASARC data.
- 3) This batgrbproduct analysis is using the flight position for the mask-weighting calculation.
======================================================================
BAT GRB EVENT DATA PROCESSING REPORT
Process Script Ver: batgrbproduct v2.46
Process Start Time: Mon Oct 24 17:12:10 EDT 2016
Host Name: bat1
Current Working Dir: /local/data/bat1/alien/Swift_3rdBATcatalog/event/batevent_reproc/trigger715084
======================================================================
Trigger: 00715084 Segment: 000
BAT Trigger Time: 497278725.632 [s; MET]
Trigger Stop: 497278726.656 [s; MET]
UTC: 2016-10-04T12:58:28.674640 [includes UTCF correction]
Where From?: TDRSS position message
BAT
RA: 263.170818888793 Dec: -0.928319619942499 [deg; J2000]
Catalogged Source?: NO
Point Source?: YES
GRB Indicated?: YES [ by BAT flight software ]
Image S/N Ratio: 8.19
Image Trigger?: NO
Rate S/N Ratio: 13.490737563232 [ if not an image trigger ]
Image S/N Ratio: 8.19
Analysis Position: [ source = BAT ]
RA: 263.170818888793 Dec: -0.928319619942499 [deg; J2000]
Refined Position: [ source = BAT pre-slew burst ]
RA: 263.132931038963 Dec: -0.933942111445677 [deg; J2000]
{ 17h 32m 31.9s , -00d 56' 02.2" }
+/- 2.07686744203869 [arcmin] (estimated 90% radius based on SNR)
+/- 0.923795624059648 [arcmin] (formal 1-sigma fit error)
SNR: 10.707233366062
Angular difference between the analysis and refined position is 2.297869 arcmin
Partial Coding Fraction: 0.921875 [ including projection effects ]
Duration
T90: 1.3199999332428 +/- 0.299786554107303
Measured from: -0.0640000104904175
to: 1.25599992275238 [s; relative to TRIGTIME]
T50: 0.659999966621399 +/- 0.187018713468652
Measured from: 0.195999979972839
to: 0.855999946594238 [s; relative to TRIGTIME]
Fluence
Peak Flux (peak 1 second)
Measured from: 0.059999942779541
to: 1.05999994277954 [s; relative to TRIGTIME]
Total Fluence
Measured from: -0.108000040054321
to: 1.31199997663498 [s; relative to TRIGTIME]
Band 1 Band 2 Band 3 Band 4
15-25 25-50 50-100 100-350 keV
Total 0.040622 0.060924 0.047705 0.012137
0.009166 0.008679 0.007366 0.005865 [error]
Peak 0.037159 0.045418 0.035016 0.011649
0.007809 0.007294 0.006280 0.004940 [error]
[ fluence units of on-axis counts / fully illuminated detector ]
======================================================================
====== Table of the duration information =============================
Value tstart tstop
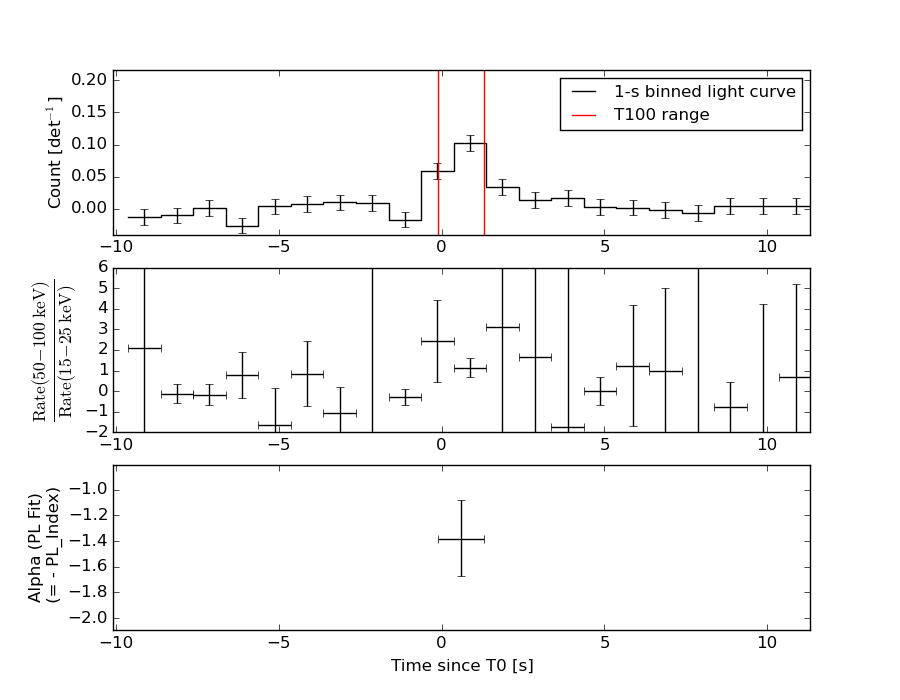
T100 1.420 -0.108 1.312
T90 1.320 -0.064 1.256
T50 0.660 0.196 0.856
Peak 1.000 0.060 1.060
====== Spectral Analysis Summary =====================================
Model : spectral model: simple power-law (PL) and cutoff power-law (CPL)
Ph_index : photon index: E^{Ph_index}
Ph_90err : 90% error of the photon index
Epeak : Epeak in keV
Epeak_90err: 90% error of Epeak
Norm : normalization at 50 keV in both the PL model and CPL model
Nomr_90err : 90% error of the normalization
chi2 : Chi-Squared
dof : degree of freedo
=== Time-averaged spectral analysis ===
(Best model with acceptable fit: N/A)
Model Ph_index Ph_90err_low Ph_90err_hi Epeak Epeak_90err_low Epeak_90err_hi Norm Nomr_90err_low Norm_90err_hi chi2 dof
PL -1.380 -0.294 0.301 - - - 7.45e-03 -1.15e-03 1.15e-03 73.360 57
CPL -1.391 -1.092 0.271 9999.360 N/A N/A 7.47e-03 N/A N/A 73.380 56
=== 1-s peak spectral analysis ===
(Best model with acceptable fit: PL)
Model Ph_index Ph_90err_low Ph_90err_hi Epeak Epeak_90err_low Epeak_90err_hi Norm Nomr_90err_low Norm_90err_hi chi2 dof
PL -1.496 -0.343 0.343 - - - 8.07e-03 -1.41e-03 1.40e-03 62.460 57
CPL -1.502 -0.338 0.535 9999.340 -9999.340 -9999.340 8.08e-03 -1.40e-03 5.13e-03 62.470 56
=== Fluence/Peak Flux Summary ===
Model Band1 Band2 Band3 Band4 Band5 Total
15-25 25-50 50-100 100-350 15-150 15-350 keV
Fluence PL 1.21e-08 2.39e-08 3.67e-08 1.23e-07 1.03e-07 1.96e-07 erg/cm2
90%_error_low -3.53e-09 -4.28e-09 -7.22e-09 -4.71e-08 -1.74e-08 -5.26e-08 erg/cm2
90%_error_hi 3.83e-09 4.14e-09 7.06e-09 6.53e-08 1.75e-08 6.76e-08 erg/cm2
Peak flux PL 3.31e-01 3.34e-01 2.37e-01 2.67e-01 1.01e+00 1.17e+00 ph/cm2/s
90%_error_low -1.05e-01 -6.51e-02 -5.41e-02 -1.11e-01 -1.79e-01 -2.00e-01 ph/cm2/s
90%_error_hi 1.14e-01 6.27e-02 5.22e-02 1.55e-01 1.79e-01 2.02e-01 ph/cm2/s
Fluence CPL 9.72e-09 1.28e-08 1.28e-08 2.91e-08 4.34e-08 6.46e-08 erg/cm2
90%_error_low -4.81e-09 -5.19e-09 N/A -1.35e-08 N/A N/A erg/cm2
90%_error_hi 4.34e-09 3.69e-09 N/A 1.06e-08 N/A N/A erg/cm2
Peak flux CPL 3.31e-01 3.33e-01 2.33e-01 3.00e-01 1.01e+00 1.17e+00 ph/cm2/s
90%_error_low -1.05e-01 -6.68e-02 N/A N/A -1.93e-01 -2.06e-01 ph/cm2/s
90%_error_hi 1.14e-01 6.56e-02 N/A N/A 1.81e-01 1.99e-01 ph/cm2/s
======================================================================
Image
Pre-slew 15.0-350.0 keV image (Event data)
#   RAcent    DECcent   POSerr    Theta     Phi              Peak Cts       SNR   Name
  263.1329    -0.9339   0.0180    26.4650    -6.8052         0.1648449     10.707 TRIG_00715084

Foreground time interval of the image:
 -0.108   1.312 (delta_t =   1.420 [sec])
Background time interval of the image:
-239.632  -0.108 (delta_t = 239.524 [sec])
Light Curves
Note: The mask-weighted lightcurves have units of either count/det or counts/sec/det, where a det is 0.4 x 0.4 = 0.16 sq cm.
Full-time range; 1 s binning
Other quick-look light curves:
- 64 ms binning (zoomed)
- 16 ms binning (zoomed)
- 8 ms binning (zoomed)
- 2 ms binning (zoomed)
- SN=5 or 10 s binning (full-time range)
- Raw light curve
Spectra
- 64 ms binning (zoomed)
- 16 ms binning (zoomed)
- 8 ms binning (zoomed)
- 2 ms binning (zoomed)
- SN=5 or 10 s binning (full-time range)
- Raw light curve
Spectra
Notes:
- 1) The fitting includes the systematic errors.
- 2) When the burst includes telescope slew time periods, the fitting uses an average response file made from multiple 5-s response files through out the slew time plus single time preiod for the non-slew times, and weighted by the total counts in the corresponding time period using addrmf. An average response file is needed becuase a spectral fit using the pre-slew DRM will introduce some errors in both a spectral shape and a normalization if the PHA file contains a lot of the slew/post-slew time interval.
- 3) For fits to more complicated models (e.g. a power-law over a cutoff power-law), the BAT team has decided to require a chi-square improvement of more than 6 for each extra dof.
Time averaged spectrum fit using the average DRM
Power-law model
Time interval is from   -0.108 sec. to    1.312 sec.

Spectral model in power-law:
------------------------------------------------------------
Parameters  : value       lower 90%   higher 90%
Photon index: -1.37996     ( -0.294013   0.30072 )
Norm@50keV  : 7.45080E-03    ( -0.00115196   0.00115088 )
------------------------------------------------------------
#Fit statistic : Chi-Squared =          73.36 using 59 PHA bins.
# Reduced chi-squared =          1.287 for     57 degrees of freedom
# Null hypothesis probability =   7.116717e-02

Photon flux (15-150 keV)    in 1.42 sec: 0.903340 ( -0.147315  0.14791 ) ph/cm2/s
Energy fluence (15-150 keV)             : 1.02674e-07 ( -1.73855e-08  1.75414e-08 ) ergs/cm2
Cutoff power-law model
Time interval is from   -0.108 sec. to    1.312 sec.
Spectral model in the cutoff power-law:
------------------------------------------------------------
Parameters  : value       lower 90%   higher 90%
Photon index: -2.37731     ( -0.105707   1.25753 )
Epeak [keV] : 129.270      (   )
Norm@50keV  : 2.16914E-03    (     )
------------------------------------------------------------
#Fit statistic : Chi-Squared =          71.66 using 59 PHA bins.
# Reduced chi-squared =          1.280 for     56 degrees of freedom
# Null hypothesis probability =   7.740103e-02

Photon flux (15-150 keV)    in 1.42 sec: 0.906435 ( -0.153185  0.147405 ) ph/cm2/s
Energy fluence (15-150 keV)             : 4.34279e-08 ( 0  0 ) ergs/cm2
1-s peak spectrum fit
Power-law model

Time interval is from    0.060 sec. to    1.060 sec.

Spectral model in power-law:
------------------------------------------------------------
Parameters  : value       lower 90%   higher 90%
Photon index: -1.49611     ( -0.343329   0.343048 )
Norm@50keV  : 8.06621E-03    ( -0.00141249   0.0013951 )
------------------------------------------------------------
#Fit statistic : Chi-Squared =          62.46 using 59 PHA bins.
# Reduced chi-squared =          1.096 for     57 degrees of freedom
# Null hypothesis probability =   2.885541e-01

Photon flux (15-150 keV)    in 1 sec: 1.00595 ( -0.178724  0.17914 ) ph/cm2/s
Energy fluence (15-150 keV)             : 7.65791e-08 ( -1.46977e-08  1.48743e-08 ) ergs/cm2
Cutoff power-law model
Time interval is from    0.060 sec. to    1.060 sec.
Spectral model in the cutoff power-law:
------------------------------------------------------------
Parameters  : value       lower 90%   higher 90%
Photon index: -1.50178     ( -0.338176   0.534942 )
Epeak [keV] : 9999.34      ( -9999.36 -9999.36 )
Norm@50keV  : 8.08025E-03    ( -0.00140146   0.00513177 )
------------------------------------------------------------
#Fit statistic : Chi-Squared =          62.47 using 59 PHA bins.
# Reduced chi-squared =          1.116 for     56 degrees of freedom
# Null hypothesis probability =   2.572095e-01

Photon flux (15-150 keV)    in 1 sec: 1.01211 ( -0.192969  0.18075 ) ph/cm2/s
Energy fluence (15-150 keV)             : 4.08075e-08 ( 0  0 ) ergs/cm2
Time-resolved spectra
Distribution
T90 vs. Hardness ratio plot
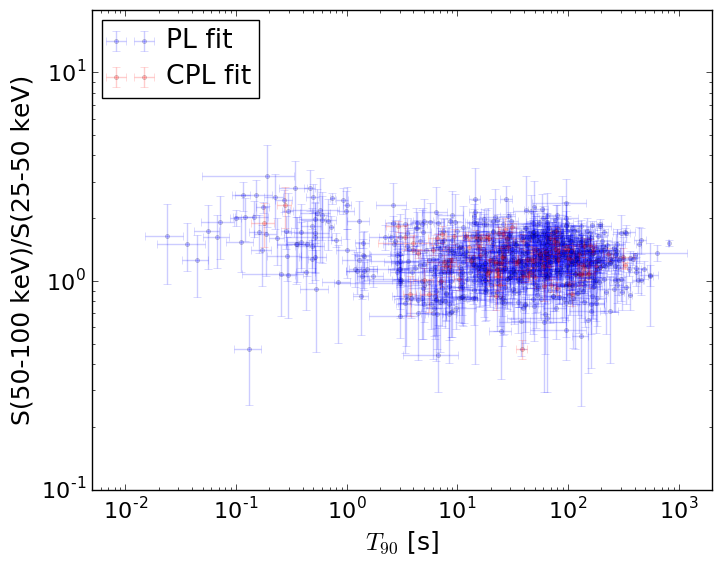
T90                                   = N/A sec.
Hardness ratio (energy fluence ratio) = N/A
S(15-50 keV) vs. S(50-150 keV) plot
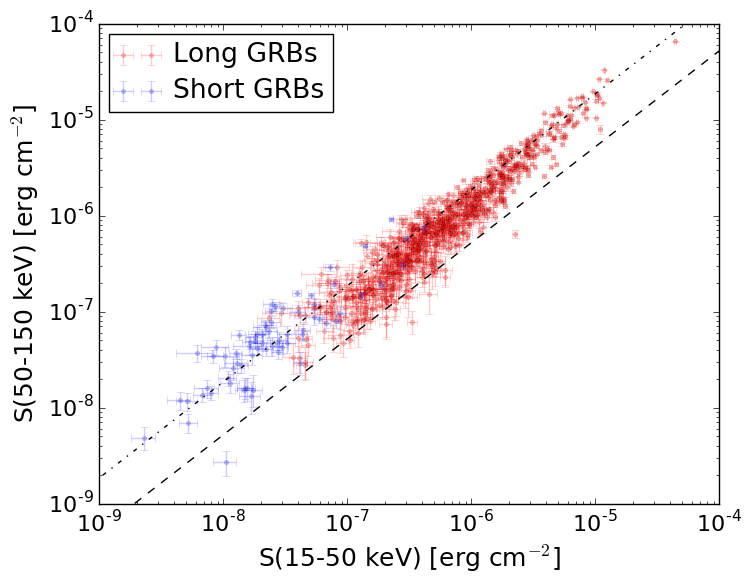
S(15-50 keV)  = N/A
S(50-150 keV) = N/A
The dash-dotted line and the dashed line traces the fluences calculated from the Band function with Epeak = 15 and 150 keV, respectively. Both lines assume a canonical values of alpha = -1 and beta = -2.5.
Mask shadow pattern
IMX = 4.943111119888717E-01, IMY = 5.898879147712979E-02
Spacecraft aspect plot
Bright source in the pre-burst/pre-slew/post-slew images
Pre-burst image of 15-350 keV band
Time interval of the image:
-239.632000 -0.108000

# RAcent  DECcent POSerr Theta    Phi  PeakCts   SNR AngSep     Name
#  [deg]    [deg]    ['] [deg]  [deg]                   [']
244.9815 -15.6519    0.4  25.9  -61.0   7.9477  27.7    0.7	Sco X-1
255.9840 -37.8460    0.6  16.5 -127.5   4.9251  18.6    0.2	4U 1700-377
256.4960 -36.4007    4.3  15.3 -124.2   0.6992   2.7    3.2	GX 349+2
263.0411 -24.8098    5.3   6.7  -67.7   0.5086   2.2    4.2	GX 1+4
264.7514 -44.3119   12.6  18.4 -158.0  -0.2166  -0.9    8.3	4U 1735-44
268.3111  -1.3095   10.6  25.3    4.8  -0.2723  -1.1    9.2	SW J1753.5-0127
270.2400 -25.0515    2.0   1.4    8.4   1.2766   5.7    2.9	GX 5-1
270.3891 -25.7602   12.6   0.7   17.9  -0.2113  -0.9    4.8	GRS 1758-258
273.9446 -14.0890    4.3  12.9   25.6   0.6217   2.7    4.8	GX 17+2
275.8382 -30.2302    2.7   6.2  138.0   0.9976   4.3    9.4	H1820-303
285.0226 -24.9190   50.7  13.4   95.9   0.0558   0.2    0.7	HT1900.1-2455
288.7756  10.9583    5.2  41.5   37.4   1.2804   2.2    1.5	GRS 1915+105
263.0482 -33.8784   13.9   9.7 -132.2   0.1953   0.8    3.9	GX 354-0
309.5729 -24.7786    3.9  35.3  105.5   2.0696   3.0 ------	UNKNOWN
299.6309 -53.5374    2.7  34.7  158.6   1.7306   4.2 ------	UNKNOWN
Pre-slew background subtracted image of 15-350 keV band
Time interval of the image:
-0.108000 1.312000

# RAcent  DECcent POSerr Theta    Phi  PeakCts   SNR AngSep     Name
#  [deg]    [deg]    ['] [deg]  [deg]                   [']
245.1380 -15.4939    0.0  25.8  -60.5   0.0315   1.8   12.7	Sco X-1
256.1643 -37.6965    0.0  16.3 -127.4  -0.0161  -1.1   12.2	4U 1700-377
256.2719 -36.5718    5.2  15.6 -124.3  -0.0336  -2.2   11.9	GX 349+2
263.1621 -24.6652    9.7   6.7  -66.3   0.0187   1.2    9.6	GX 1+4
264.9593 -44.5275    6.1  18.5 -158.7   0.0273   1.9   10.4	4U 1735-44
268.2254  -1.4234    8.5  25.1    4.6  -0.0223  -1.3    8.7	SW J1753.5-0127
270.2425 -24.9525   10.0   1.5    8.5  -0.0169  -1.2    7.9	GX 5-1
270.3859 -25.5786   10.8   0.9   16.0   0.0156   1.1   10.8	GRS 1758-258
274.0811 -13.9549    9.1  13.0   26.0   0.0194   1.3    6.6	GX 17+2
276.1302 -30.4815    0.0   6.5  138.5   0.0128   0.8   12.6	H1820-303
284.8767 -24.9608    6.2  13.2   96.0   0.0292   1.8    9.0	HT1900.1-2455
288.7205  11.0591    5.0  41.6   37.3  -0.0864  -2.3    8.2	GRS 1915+105
263.1337 -33.8179    6.3   9.6 -132.3  -0.0285  -1.8    7.3	GX 354-0
263.1339  -0.9350    1.1  26.5   -6.8   0.1646  10.7 ------	UNKNOWN
Post-slew image of 15-350 keV band
Time interval of the image:
64.868620 962.393500

# RAcent  DECcent POSerr Theta    Phi  PeakCts   SNR AngSep     Name
#  [deg]    [deg]    ['] [deg]  [deg]                   [']
244.9847 -15.6354    0.3  23.2 -125.5  31.6210  34.9    0.4	Sco X-1
254.6051  35.3460   12.0  37.1   -6.9  -0.8916  -1.0    7.2	Her X-1
255.9989 -37.8533    0.6  37.5 -165.9  18.3215  18.7    0.8	4U 1700-377
256.4714 -36.3187    3.9  35.9 -166.0   2.4999   2.9    6.5	GX 349+2
263.1003 -24.7124    4.4  23.8 -175.1   2.0461   2.6    5.4	GX 1+4
264.8253 -44.4224    6.3  43.5 -176.9   2.4053   1.8    3.9	4U 1735-44
268.2672  -1.5394    7.3   5.1  101.7  -1.1027  -1.6    8.0	SW J1753.5-0127
270.3146 -25.1016    1.7  25.1  169.4   5.3261   6.8    2.1	GX 5-1
270.1686 -25.9096    0.0  25.9  170.2   0.5926   0.8   12.3	GRS 1758-258
274.0107 -14.0855    2.8  17.0  146.1   3.1560   4.2    3.0	GX 17+2
275.9301 -30.3665   33.6  31.8  163.6   0.3445   0.3    0.3	H1820-303
285.1040 -25.0525    4.7  32.1  145.2  -2.8132  -2.4    8.7	HT1900.1-2455
288.7627  10.9936    2.0  28.1   69.0   7.0787   5.7    3.6	GRS 1915+105
263.0322 -33.8199    6.1  32.9 -175.0   1.7091   1.9    2.3	GX 354-0
258.2864  21.7636    3.4  23.2   -6.8   2.5656   3.4 ------	UNKNOWN
255.7856  37.9129    2.7  39.4   -4.4   4.4011   4.3 ------	UNKNOWN
250.4817  -3.9437    3.6  13.0  -98.8   2.4237   3.2 ------	UNKNOWN
237.2782  49.3450    3.5  55.0  -15.6   8.4006   3.3 ------	UNKNOWN
233.3310 -52.5038    2.6  57.3 -154.1  19.2646   4.4 ------	UNKNOWN
223.1332 -16.7944    3.0  42.5 -109.5  16.2361   3.8 ------	UNKNOWN