Analysis Summary
Notes:
- 1) No attempt has been made to eliminate the non-significant decimal places.
- 2) This batgrbproduct analysis is done using the HEASARC data.
- 3) This batgrbproduct analysis is using the flight position for the mask-weighting calculation.
======================================================================
BAT GRB EVENT DATA PROCESSING REPORT
Process Script Ver: batgrbproduct v2.46
Process Start Time: Sun Nov 20 15:08:57 EST 2016
Host Name: bat1
Current Working Dir: /local/data/bat1/alien/Swift_3rdBATcatalog/event/batevent_reproc/trigger716876
======================================================================
Trigger: 00716876 Segment: 000
BAT Trigger Time: 497858111.104 [s; MET]
Trigger Stop: 497858113.152 [s; MET]
UTC: 2016-10-11T05:54:54.113800 [includes UTCF correction]
Where From?: TDRSS position message
BAT
RA: 245.710556686154 Dec: 8.32611886348883 [deg; J2000]
Catalogged Source?: NO
Point Source?: YES
GRB Indicated?: YES [ by BAT flight software ]
Image S/N Ratio: 6.98
Image Trigger?: NO
Rate S/N Ratio: 11 [ if not an image trigger ]
Image S/N Ratio: 6.98
Analysis Position: [ source = BAT ]
RA: 245.710556686154 Dec: 8.32611886348883 [deg; J2000]
Refined Position: [ source = BAT pre-slew burst ]
RA: 245.693789924305 Dec: 8.31575136714363 [deg; J2000]
{ 16h 22m 46.5s , +08d 18' 56.7" }
+/- 2.44336594918023 [arcmin] (estimated 90% radius based on SNR)
+/- 1.27739164836744 [arcmin] (formal 1-sigma fit error)
SNR: 8.48885410623575
Angular difference between the analysis and refined position is 1.173796 arcmin
Partial Coding Fraction: 0.4375 [ including projection effects ]
Duration
T90: 4.27599990367889 +/- 1.26309465755692
Measured from: -0.119999945163727
to: 4.15599995851517 [s; relative to TRIGTIME]
T50: 1.89599990844727 +/- 1.38905434300434
Measured from: 0.79200005531311
to: 2.68799996376038 [s; relative to TRIGTIME]
Fluence
Peak Flux (peak 1 second)
Measured from: 1.36800003051758
to: 2.36800003051758 [s; relative to TRIGTIME]
Total Fluence
Measured from: -0.351999998092651
to: 4.51600003242493 [s; relative to TRIGTIME]
Band 1 Band 2 Band 3 Band 4
15-25 25-50 50-100 100-350 keV
Total 0.040202 0.119915 0.098891 0.028461
0.023297 0.021225 0.018025 0.014845 [error]
Peak 0.023920 0.039916 0.028940 0.002460
0.010607 0.009917 0.008308 0.006569 [error]
[ fluence units of on-axis counts / fully illuminated detector ]
======================================================================
====== Table of the duration information =============================
Value tstart tstop
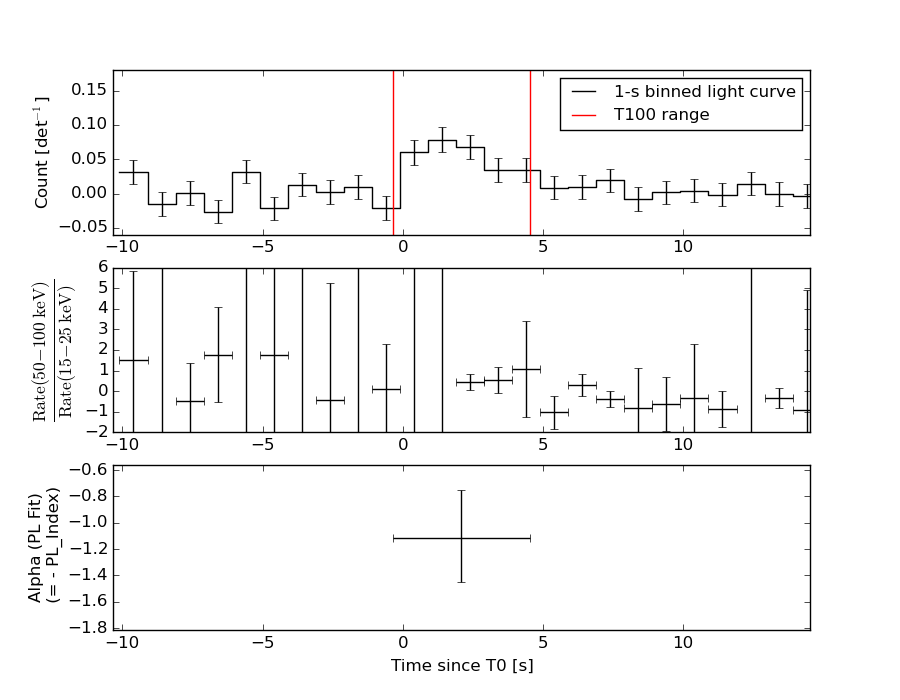
T100 4.868 -0.352 4.516
T90 4.276 -0.120 4.156
T50 1.896 0.792 2.688
Peak 1.000 1.368 2.368
====== Spectral Analysis Summary =====================================
Model : spectral model: simple power-law (PL) and cutoff power-law (CPL)
Ph_index : photon index: E^{Ph_index}
Ph_90err : 90% error of the photon index
Epeak : Epeak in keV
Epeak_90err: 90% error of Epeak
Norm : normalization at 50 keV in both the PL model and CPL model
Nomr_90err : 90% error of the normalization
chi2 : Chi-Squared
dof : degree of freedo
=== Time-averaged spectral analysis ===
(Best model with acceptable fit: PL)
Model Ph_index Ph_90err_low Ph_90err_hi Epeak Epeak_90err_low Epeak_90err_hi Norm Nomr_90err_low Norm_90err_hi chi2 dof
PL -1.116 -0.335 0.364 - - - 4.54e-03 -9.22e-04 9.02e-04 52.530 57
CPL -0.800 -5.531 1.476 222.842 N/A N/A 6.23e-03 N/A N/A 52.340 56
=== 1-s peak spectral analysis ===
(Best model with acceptable fit: PL)
Model Ph_index Ph_90err_low Ph_90err_hi Epeak Epeak_90err_low Epeak_90err_hi Norm Nomr_90err_low Norm_90err_hi chi2 dof
PL -1.540 -0.447 0.447 - - - 7.04e-03 -1.96e-03 1.96e-03 59.720 57
CPL 1.225 -2.514 5.276 58.201 -13.760 80.260 1.61e-01 -1.61e-01 3.93e+01 56.080 56
=== Fluence/Peak Flux Summary ===
Model Band1 Band2 Band3 Band4 Band5 Total
15-25 25-50 50-100 100-350 15-150 15-350 keV
Fluence PL 1.97e-08 4.59e-08 8.46e-08 3.74e-07 2.30e-07 5.24e-07 erg/cm2
90%_error_low -7.76e-09 -1.19e-08 -1.69e-08 -1.46e-07 -4.41e-08 -1.56e-07 erg/cm2
90%_error_hi 9.12e-09 1.17e-08 1.67e-08 2.09e-07 4.42e-08 2.08e-07 erg/cm2
Peak flux PL 3.01e-01 2.96e-01 2.03e-01 2.20e-01 8.89e-01 1.02e+00 ph/cm2/s
90%_error_low -1.32e-01 -9.17e-02 -6.60e-02 -1.14e-01 -2.59e-01 -2.83e-01 ph/cm2/s
90%_error_hi 1.54e-01 9.04e-02 6.56e-02 1.69e-01 2.63e-01 2.83e-01 ph/cm2/s
Fluence CPL 1.81e-08 4.67e-08 8.76e-08 2.54e-07 2.27e-07 4.06e-07 erg/cm2
90%_error_low -9.26e-09 -1.25e-08 -1.92e-08 -1.90e-07 -4.68e-08 -1.95e-07 erg/cm2
90%_error_hi 1.03e-08 1.28e-08 2.09e-08 1.68e-07 4.57e-08 2.13e-07 erg/cm2
Peak flux CPL 1.70e-01 3.51e-01 2.35e-01 3.25e-02 7.86e-01 7.89e-01 ph/cm2/s
90%_error_low -1.37e-01 -1.19e-01 -8.94e-02 -3.25e-02 -2.67e-01 -2.70e-01 ph/cm2/s
90%_error_hi 1.87e-01 1.22e-01 8.79e-02 1.47e-01 2.78e-01 2.94e-01 ph/cm2/s
======================================================================
Image
Pre-slew 15.0-350.0 keV image (Event data)
#   RAcent    DECcent   POSerr    Theta     Phi              Peak Cts       SNR   Name
  245.6938     8.3158   0.0228    42.1832   -29.3233         0.3291498      8.489 TRIG_00716876

Foreground time interval of the image:
 -0.352   4.516 (delta_t =   4.868 [sec])
Background time interval of the image:
-647.903 -627.573 (delta_t =  20.330 [sec])
-239.104  -0.352 (delta_t = 238.752 [sec])
Light Curves
Note: The mask-weighted lightcurves have units of either count/det or counts/sec/det, where a det is 0.4 x 0.4 = 0.16 sq cm.
Full-time range; 1 s binning
Other quick-look light curves:
- 64 ms binning (zoomed)
- 16 ms binning (zoomed)
- 8 ms binning (zoomed)
- 2 ms binning (zoomed)
- SN=5 or 10 s binning (full-time range)
- Raw light curve
Spectra
- 64 ms binning (zoomed)
- 16 ms binning (zoomed)
- 8 ms binning (zoomed)
- 2 ms binning (zoomed)
- SN=5 or 10 s binning (full-time range)
- Raw light curve
Spectra
Notes:
- 1) The fitting includes the systematic errors.
- 2) When the burst includes telescope slew time periods, the fitting uses an average response file made from multiple 5-s response files through out the slew time plus single time preiod for the non-slew times, and weighted by the total counts in the corresponding time period using addrmf. An average response file is needed becuase a spectral fit using the pre-slew DRM will introduce some errors in both a spectral shape and a normalization if the PHA file contains a lot of the slew/post-slew time interval.
- 3) For fits to more complicated models (e.g. a power-law over a cutoff power-law), the BAT team has decided to require a chi-square improvement of more than 6 for each extra dof.
Time averaged spectrum fit using the average DRM
Power-law model
Time interval is from   -0.352 sec. to    4.516 sec.

Spectral model in power-law:
------------------------------------------------------------
Parameters  : value       lower 90%   higher 90%
Photon index: -1.11647     ( -0.334535   0.364414 )
Norm@50keV  : 4.53950E-03    ( -0.000921896   0.000902101 )
------------------------------------------------------------
#Fit statistic : Chi-Squared =          52.53 using 59 PHA bins.
# Reduced chi-squared =         0.9215 for     57 degrees of freedom
# Null hypothesis probability =   6.433450e-01

Photon flux (15-150 keV)    in 4.868 sec: 0.527421 ( -0.112063  0.114508 ) ph/cm2/s
Energy fluence (15-150 keV)             : 2.29869e-07 ( -4.41353e-08  4.42195e-08 ) ergs/cm2
Cutoff power-law model
Time interval is from   -0.352 sec. to    4.516 sec.
Spectral model in the cutoff power-law:
------------------------------------------------------------
Parameters  : value       lower 90%   higher 90%
Photon index: -2.24228     ( -4.08961   2.91825 )
Epeak [keV] : 81.3130      (   )
Norm@50keV  : 4.43258E-04    (     )
------------------------------------------------------------
#Fit statistic : Chi-Squared =          52.11 using 59 PHA bins.
# Reduced chi-squared =         0.9305 for     56 degrees of freedom
# Null hypothesis probability =   6.229883e-01

Photon flux (15-150 keV)    in 4.868 sec: 0.519059 ( -0.115295  0.118528 ) ph/cm2/s
Energy fluence (15-150 keV)             : 2.26804e-07 ( -4.68048e-08  4.57236e-08 ) ergs/cm2
1-s peak spectrum fit
Power-law model
Time interval is from    1.368 sec. to    2.368 sec.

Spectral model in power-law:
------------------------------------------------------------
Parameters  : value       lower 90%   higher 90%
Photon index: -1.54011     ( -0.44659   0.447634 )
Norm@50keV  : 7.03846E-03    ( -0.00196313   0.0019591 )
------------------------------------------------------------
#Fit statistic : Chi-Squared =          59.72 using 59 PHA bins.
# Reduced chi-squared =          1.048 for     57 degrees of freedom
# Null hypothesis probability =   3.772078e-01

Photon flux (15-150 keV)    in 1 sec: 0.888608 ( -0.25866  0.262692 ) ph/cm2/s
Energy fluence (15-150 keV)             : 6.6359e-08 ( -1.9194e-08  1.94534e-08 ) ergs/cm2
Cutoff power-law model
Time interval is from    1.368 sec. to    2.368 sec.
Spectral model in the cutoff power-law:
------------------------------------------------------------
Parameters  : value       lower 90%   higher 90%
Photon index: 1.22453     ( -2.52642   5.26374 )
Epeak [keV] : 58.2009      ( -13.7119 80.3081 )
Norm@50keV  : 0.160884    ( -0.164031   39.3341 )
------------------------------------------------------------
#Fit statistic : Chi-Squared =          56.08 using 59 PHA bins.
# Reduced chi-squared =          1.001 for     56 degrees of freedom
# Null hypothesis probability =   4.717360e-01

Photon flux (15-150 keV)    in 1 sec: 0.785771 ( -0.267077  0.278309 ) ph/cm2/s
Energy fluence (15-150 keV)             : 5.68526e-08 ( -1.84279e-08  2.10138e-08 ) ergs/cm2
Time-resolved spectra
Distribution
T90 vs. Hardness ratio plot
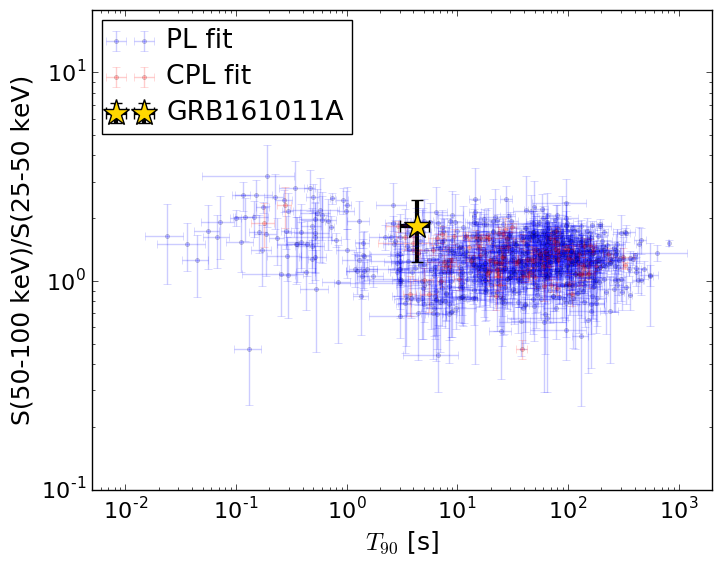
T90                                   = 4.276 sec.
Hardness ratio (energy fluence ratio) = 1.84493023333
S(15-50 keV) vs. S(50-150 keV) plot
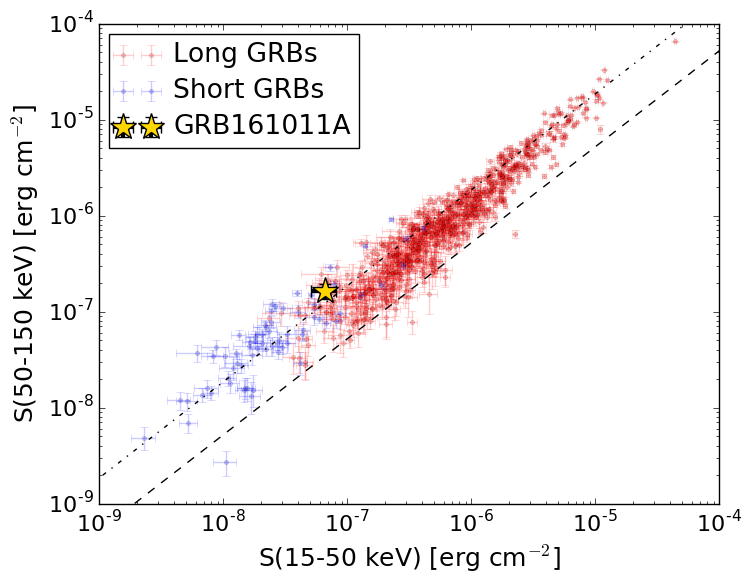
S(15-50 keV)  = 6.560335e-08
S(50-150 keV) = 1.6426443e-07
The dash-dotted line and the dashed line traces the fluences calculated from the Band function with Epeak = 15 and 150 keV, respectively. Both lines assume a canonical values of alpha = -1 and beta = -2.5.
Mask shadow pattern
IMX = 7.900976664613558E-01, IMY = 4.438040284216307E-01
Spacecraft aspect plot
Bright source in the pre-burst/pre-slew/post-slew images
Pre-burst image of 15-350 keV band
Time interval of the image:
-647.903410 -627.573100
-239.104000 -0.352000

# RAcent  DECcent POSerr Theta    Phi  PeakCts   SNR AngSep     Name
#  [deg]    [deg]    ['] [deg]  [deg]                   [']
244.9896 -15.6346    0.2  25.9  -61.9  15.7731  49.3    0.7	Sco X-1
255.9060 -37.8735    4.9  16.6 -128.3   0.5688   2.3    4.2	4U 1700-377
256.5363 -36.3963    4.2  15.3 -125.2   0.6885   2.7    5.1	GX 349+2
262.9271 -24.7419    4.8   6.9  -68.6   0.5783   2.4    4.5	GX 1+4
264.6377 -44.5069    5.5  18.6 -158.8   0.5309   2.1    5.7	4U 1735-44
268.3727  -1.4220    9.4  25.1    4.0  -0.3263  -1.2    1.9	SW J1753.5-0127
270.2727 -25.0642    2.0   1.4    7.9   1.3163   5.7    1.1	GX 5-1
270.4699 -25.7896  106.1   0.7   22.1   0.0253   0.1    9.5	GRS 1758-258
273.9923 -14.0390    2.9  12.9   24.8   0.9318   3.9    0.8	GX 17+2
275.8944 -30.3320    5.2   6.3  137.9   0.5000   2.2    2.6	H1820-303
285.1386 -24.8907    4.5  13.5   95.1   0.6720   2.6    5.9	HT1900.1-2455
288.6720  10.9688   26.6  41.5   36.4   0.2248   0.4    7.6	GRS 1915+105
263.1843 -33.9714   11.8   9.7 -134.0   0.2389   1.0   12.7	GX 354-0
291.6212  -0.4486    3.8  33.1   50.2   1.1997   3.0 ------	UNKNOWN
309.8263 -48.2332    2.1  37.6  144.5   2.3594   5.4 ------	UNKNOWN
327.2142 -65.0343    3.2  52.4  162.0   4.0539   3.7 ------	UNKNOWN
270.8806 -64.7451    2.4  38.3 -171.9   1.4474   4.7 ------	UNKNOWN
271.7389 -74.3099    2.3  47.9 -172.0   2.5663   5.0 ------	UNKNOWN
230.5493   3.0594    2.7  48.4  -50.1   4.5538   4.3 ------	UNKNOWN
219.5396 -42.6709    2.2  44.1 -116.5   5.3780   5.2 ------	UNKNOWN
Pre-slew background subtracted image of 15-350 keV band
Time interval of the image:
-0.352000 4.516000

# RAcent  DECcent POSerr Theta    Phi  PeakCts   SNR AngSep     Name
#  [deg]    [deg]    ['] [deg]  [deg]                   [']
244.9773 -15.6617  406.1  25.9  -61.9  -0.0008  -0.0    1.3	Sco X-1
256.0860 -37.8229    6.5  16.5 -128.5   0.0432   1.8    4.9	4U 1700-377
256.2578 -36.5698    0.0  15.6 -125.2   0.0498   2.1   12.3	GX 349+2
263.0594 -24.5914   17.6   6.8  -67.1  -0.0151  -0.7    9.6	GX 1+4
264.9318 -44.3672   11.7  18.4 -159.3  -0.0227  -1.0    9.5	4U 1735-44
268.2551  -1.6190    0.0  24.9    3.7  -0.0149  -0.6   12.1	SW J1753.5-0127
270.0993 -24.9720    5.0   1.5    1.9   0.0561   2.3   11.9	GX 5-1
270.1938 -25.8574    5.7   0.6    0.4  -0.0495  -2.0    9.0	GRS 1758-258
273.8589 -14.0732    8.4  12.8   24.3   0.0315   1.4    8.8	GX 17+2
276.0016 -30.2012    4.6   6.3  136.5   0.0584   2.5   10.7	H1820-303
284.8856 -24.8060    8.2  13.3   94.5   0.0350   1.4   10.7	HT1900.1-2455
288.7491  11.0590    8.7  41.6   36.4  -0.0670  -1.3    7.4	GRS 1915+105
263.1846 -33.9714    0.0   9.7 -134.0  -0.0020  -0.1   12.7	GX 354-0
245.6938   8.3158    1.4  42.2  -29.3   0.3291   8.5 ------	UNKNOWN
240.8524 -33.3290    2.5  26.3 -103.7   0.1585   4.6 ------	UNKNOWN
Post-slew image of 15-350 keV band
Time interval of the image:
99.396590 963.038900

# RAcent  DECcent POSerr Theta    Phi  PeakCts   SNR AngSep     Name
#  [deg]    [deg]    ['] [deg]  [deg]                   [']
244.9845 -15.6347    0.2  24.0 -161.8  54.0909  70.7    0.4	Sco X-1
254.5142  35.2031    3.7  28.1   31.9   2.4185   3.1    8.8	Her X-1
256.0975 -37.7871   14.1  47.1 -174.7   1.1323   0.8    6.3	4U 1700-377
256.4204 -36.4209   19.1  45.9 -175.5   0.7686   0.6    0.7	GX 349+2
263.1519 -24.8073    4.6  37.2  169.8   2.7370   2.5    8.6	GX 1+4
264.7685 -44.5262    8.7  55.6 -179.9  -4.7586  -1.3    4.7	4U 1735-44
268.3553  -1.3077    7.2  24.5  128.6  -1.2378  -1.6    8.7	SW J1753.5-0127
270.2821 -25.1454    3.6  41.1  161.6   4.8466   3.2    4.0	GX 5-1
270.2668 -25.6465    3.6  41.5  162.1   4.9688   3.2    6.1	GRS 1758-258
273.8814 -14.1011   11.9  35.8  145.0   1.2229   1.0    8.2	GX 17+2
275.9875 -30.1818    4.8  48.3  160.8   5.3044   2.4   11.6	H1820-303
285.1398 -24.8068    3.9  50.7  148.4 -11.0595  -3.0    8.9	HT1900.1-2455
263.1092 -33.7993    8.5  45.2  176.0   1.9499   1.4    6.4	GX 354-0
249.1672  41.8291    2.6  33.6   21.2   3.8968   4.5 ------	UNKNOWN
246.3125   3.1087    2.9   5.3 -170.1   2.8728   4.0 ------	UNKNOWN
206.4000  35.1252    3.4  44.8  -30.8   4.2620   3.3 ------	UNKNOWN