Analysis Summary
Notes:
- 1) No attempt has been made to eliminate the non-significant decimal places.
- 2) This batgrbproduct analysis is done using the HEASARC data.
- 3) This batgrbproduct analysis is using the flight position for the mask-weighting calculation.
======================================================================
                  BAT GRB EVENT DATA PROCESSING REPORT
    Process Script Ver: batgrbproduct v2.46
    Process Start Time: Mon Nov 14 22:10:48 EST 2016
             Host Name: bat1
   Current Working Dir: /local/data/bat1/alien/Swift_3rdBATcatalog/event/batevent_reproc/trigger717500
======================================================================

  Trigger: 00717500      Segment: 000

  BAT Trigger Time: 498141099.712   [s; MET]
      Trigger Stop: 498141101.12   [s; MET]
               UTC: 2016-10-14T12:31:22.705760    [includes UTCF correction]
       Where From?: TDRSS position message

  BAT
    RA: 332.628404737304   Dec: 7.48598860616531  [deg; J2000]

     Catalogged Source?: NO
     Point Source?:      YES
     GRB Indicated?:     YES    [ by BAT flight software ]
     Image S/N Ratio:    6.79
     Image Trigger?:     NO
     Rate S/N Ratio:     26.3818119165458  [ if not an image trigger ]
     Image S/N Ratio:    6.79

  Analysis Position:   [ source = BAT ]
    RA: 332.628404737304   Dec: 7.48598860616531  [deg; J2000]

  Refined Position:   [ source = BAT pre-slew burst ]
    RA: 332.628490794962   Dec: 7.46876764760558  [deg; J2000]
        { 22h 10m 30.8s , +07d 28' 07.6" }
         +/- 1.62273540755597 [arcmin] (estimated 90% radius based on SNR)
         +/- 0.582353443476894 [arcmin] (formal 1-sigma fit error)
    SNR: 15.2322656467254

  Angular difference between the analysis and refined position is 1.033270 arcmin

  Partial Coding Fraction: 0.1347656    [ including projection effects ]

  Duration
     T90: 23.00 +/- 4.47213595499958
        Measured from: -11.712
                   to: 11.288     [s; relative to TRIGTIME]
     T50: 9.00 +/- 2.23606797749979
        Measured from: -5.712
                   to: 3.288    [s; relative to TRIGTIME]

======================================================================


====== Table of the duration information =============================

        Value   tstart    tstop
T100   27.000  -14.712   12.288
T90    23.000  -11.712   11.288
T50     9.000   -5.712    3.288
Peak    1.000    0.288    1.288


====== Spectral Analysis Summary =====================================

Model      : spectral model: simple power-law (PL) and cutoff power-law (CPL)
Ph_index   : photon index: E^{Ph_index}
Ph_90err   : 90% error of the photon index
Epeak      : Epeak in keV
Epeak_90err: 90% error of Epeak
Norm       : normalization at 50 keV in both the PL model and CPL model
Nomr_90err : 90% error of the normalization
chi2       : Chi-Squared
dof        : degree of freedo

=== Time-averaged spectral analysis ===
(Best model with acceptable fit: PL)

Model Ph_index Ph_90err_low Ph_90err_hi  Epeak  Epeak_90err_low  Epeak_90err_hi  Norm       Nomr_90err_low    Norm_90err_hi    chi2    dof
PL      -1.443    -0.151      0.151       -           -               -         8.53e-03     -7.37e-04          7.37e-04      59.120   57
CPL     -1.182    -0.338      0.657      175.218    -175.218      -175.218      1.13e-02     -3.34e-03          1.08e-02      58.550   56


=== 1-s peak spectral analysis ===
(Best model with acceptable fit: N/A)

Model Ph_index Ph_90err_low Ph_90err_hi  Epeak  Epeak_90err_low  Epeak_90err_hi  Norm       Nomr_90err_low    Norm_90err_hi    chi2    dof
PL      -1.793     -0.287     0.265       -           -               -         1.95e-02     -4.07e-03          4.03e-03      74.300   57
CPL      1.532     -1.813     3.185       61.873      -8.551         9.476      6.06e-01     -6.06e-01          8.17e+00      62.380   56


=== Fluence/Peak Flux Summary ===

              Model    Band1     Band2     Band3     Band4     Band5     Total
                       15-25     25-50    50-100    100-350    15-150    15-350    keV
Fluence         PL   2.79e-07  5.31e-07  7.81e-07  2.46e-06  2.21e-06  4.05e-06   erg/cm2
      90%_error_low -4.44e-08 -5.25e-08 -8.13e-08 -5.20e-07 -2.01e-07 -5.79e-07   erg/cm2
      90%_error_hi   4.67e-08  5.19e-08  8.04e-08  6.05e-07  2.02e-07  6.44e-07   erg/cm2
Peak flux       PL   1.06e+00  9.00e-01  5.20e-01  4.47e-01  2.68e+00  2.93e+00   ph/cm2/s
      90%_error_low -2.94e-01 -1.85e-01 -1.28e-01 -1.75e-01 -5.51e-01 -5.86e-01   ph/cm2/s
      90%_error_hi   3.14e-01  1.85e-01  1.26e-01  2.11e-01  5.52e-01  5.86e-01   ph/cm2/s

Fluence        CPL   2.15e-07  2.97e-07  3.17e-07  7.71e-07  1.04e-06  1.60e-06   erg/cm2
      90%_error_low -3.87e-08 -1.42e-07 -9.73e-08 -1.46e-07 -3.23e-07 -4.28e-07   erg/cm2
      90%_error_hi   3.77e-08  3.52e-08  8.05e-08  1.15e-07  2.76e-07  3.22e-07   erg/cm2
Peak flux      CPL   4.65e-01  1.12e+00  8.65e-01  1.31e-01  2.57e+00  2.58e+00   ph/cm2/s
      90%_error_low -4.65e-01 -2.98e-01 -2.37e-01 -7.47e-02 -5.82e-01 -5.91e-01   ph/cm2/s
      90%_error_hi   4.22e-01  2.56e-01  2.72e-01  1.15e-01  5.75e-01  5.85e-01   ph/cm2/s

======================================================================
Image
Pre-slew 15.0-350.0 keV image (Event data)

#   RAcent    DECcent   POSerr    Theta     Phi              Peak Cts       SNR   Name
  332.6285     7.4688   0.0126    48.4925   156.9817         3.1135614     15.232 TRIG_00717500

Foreground time interval of the image:
 -6.532  23.189 (delta_t =  29.721 [sec])
Background time interval of the image:
-768.111 -750.032 (delta_t =  18.079 [sec])
-239.712  -6.532 (delta_t = 233.180 [sec])
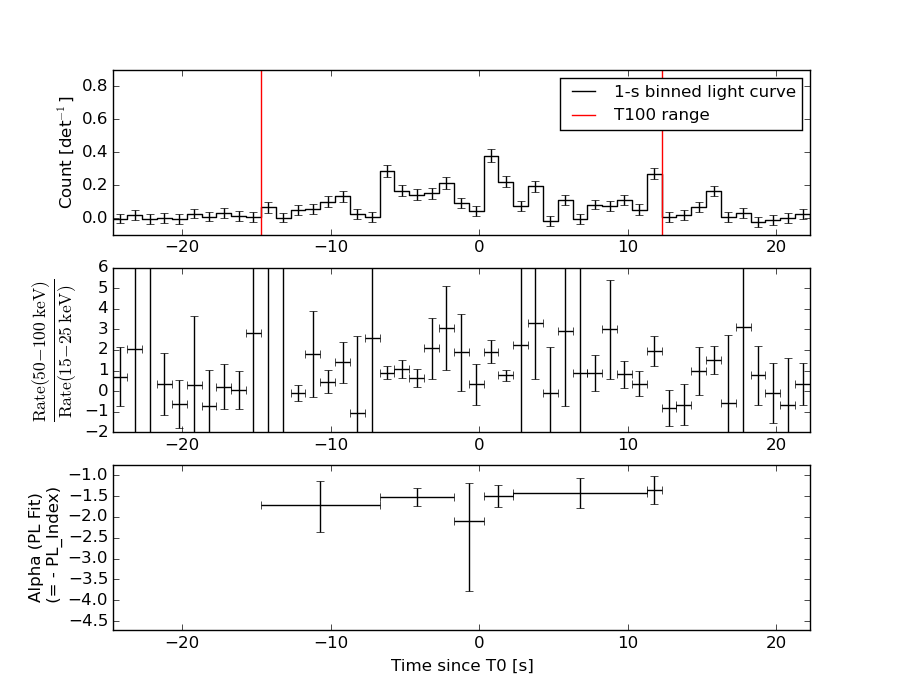
Light Curves
Note: The mask-weighted lightcurves have units of either count/det or counts/sec/det, where a det is 0.4 x 0.4 = 0.16 sq cm.
Full-time range; 1 s binning
Other quick-look light curves:
- 64 ms binning (zoomed)
- 16 ms binning (zoomed)
- 8 ms binning (zoomed)
- 2 ms binning (zoomed)
- SN=5 or 10 s binning (full-time range)
- Raw light curve
Spectra
- 64 ms binning (zoomed)
- 16 ms binning (zoomed)
- 8 ms binning (zoomed)
- 2 ms binning (zoomed)
- SN=5 or 10 s binning (full-time range)
- Raw light curve
Spectra
Notes:
- 1) The fitting includes the systematic errors.
- 2) When the burst includes telescope slew time periods, the fitting uses an average response file made from multiple 5-s response files through out the slew time plus single time preiod for the non-slew times, and weighted by the total counts in the corresponding time period using addrmf. An average response file is needed becuase a spectral fit using the pre-slew DRM will introduce some errors in both a spectral shape and a normalization if the PHA file contains a lot of the slew/post-slew time interval.
- 3) For fits to more complicated models (e.g. a power-law over a cutoff power-law), the BAT team has decided to require a chi-square improvement of more than 6 for each extra dof.
Time averaged spectrum fit using the average DRM
Power-law model
Time interval is from  -14.712 sec. to   12.288 sec.

Spectral model in power-law:
------------------------------------------------------------
Parameters  : value       lower 90%   higher 90%
Photon index: -1.44255     ( -0.150702   0.150998 )
Norm@50keV  : 8.53269E-03    ( -0.000736701   0.000736651 )
------------------------------------------------------------
#Fit statistic : Chi-Squared =          59.12 using 59 PHA bins.
# Reduced chi-squared =          1.037 for     57 degrees of freedom
# Null hypothesis probability =   3.981323e-01

Photon flux (15-150 keV)    in 27 sec: 1.04963 ( -0.097561  0.09797 ) ph/cm2/s
Energy fluence (15-150 keV)             : 2.20792e-06 ( -2.01078e-07  2.01893e-07 ) ergs/cm2
Cutoff power-law model
Time interval is from  -14.712 sec. to   12.288 sec.
Spectral model in the cutoff power-law:
------------------------------------------------------------
Parameters  : value       lower 90%   higher 90%
Photon index: -1.18223     ( -0.337651   0.656813 )
Epeak [keV] : 175.218      ( -175.215 -175.215 )
Norm@50keV  : 1.12501E-02    ( -0.00333548   0.0107644 )
------------------------------------------------------------
#Fit statistic : Chi-Squared =          58.55 using 59 PHA bins.
# Reduced chi-squared =          1.046 for     56 degrees of freedom
# Null hypothesis probability =   3.819440e-01

Photon flux (15-150 keV)    in 27 sec: 1.03595 ( -0.102271  0.10251 ) ph/cm2/s
Energy fluence (15-150 keV)             : 1.0367e-06 ( -3.23104e-07  2.76386e-07 ) ergs/cm2
1-s peak spectrum fit
Power-law model
Time interval is from    0.100 sec. to    1.100 sec.

Spectral model in power-law:
------------------------------------------------------------
Parameters  : value       lower 90%   higher 90%
Photon index: -1.79265     ( -0.286538   0.264904 )
Norm@50keV  : 1.94843E-02    ( -0.00406971   0.00402973 )
------------------------------------------------------------
#Fit statistic : Chi-Squared =          74.30 using 59 PHA bins.
# Reduced chi-squared =          1.304 for     57 degrees of freedom
# Null hypothesis probability =   6.157380e-02

Photon flux (15-150 keV)    in 1 sec: 2.67750 ( -0.55071  0.55203 ) ph/cm2/s
Energy fluence (15-150 keV)             : 1.79444e-07 ( -3.77146e-08  3.77761e-08 ) ergs/cm2
Cutoff power-law model

Time interval is from    0.100 sec. to    1.100 sec.
Spectral model in the cutoff power-law:
------------------------------------------------------------
Parameters  : value       lower 90%   higher 90%
Photon index: 1.53209     ( -1.82652   3.17133 )
Epeak [keV] : 61.8734      ( -8.56466 9.46259 )
Norm@50keV  : 0.606419    ( -0.617995   8.15637 )
------------------------------------------------------------
#Fit statistic : Chi-Squared =          62.38 using 59 PHA bins.
# Reduced chi-squared =          1.114 for     56 degrees of freedom
# Null hypothesis probability =   2.598710e-01

Photon flux (15-150 keV)    in 1 sec: 2.56754 ( -0.58156  0.57518 ) ph/cm2/s
Energy fluence (15-150 keV)             : 1.97224e-07 ( -3.85302e-08  3.87314e-08 ) ergs/cm2
Time-resolved spectra
Distribution
T90 vs. Hardness ratio plot
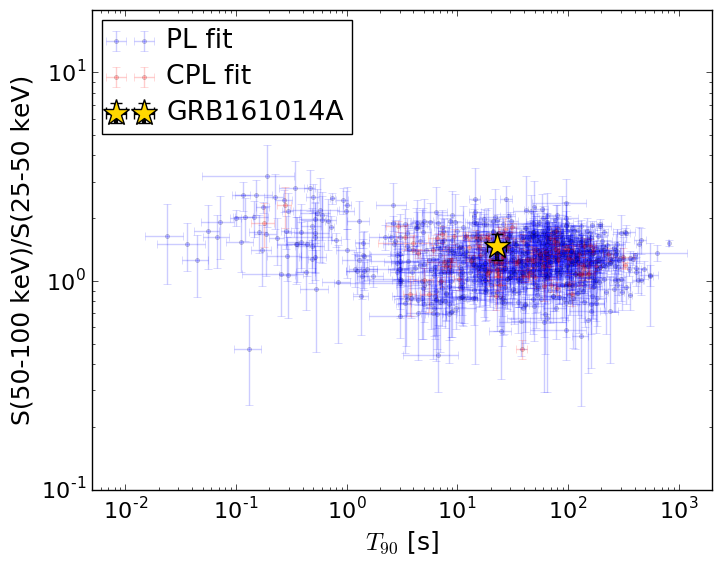
T90                                   = 23.0 sec.
Hardness ratio (energy fluence ratio) = 1.47170259061
S(15-50 keV) vs. S(50-150 keV) plot
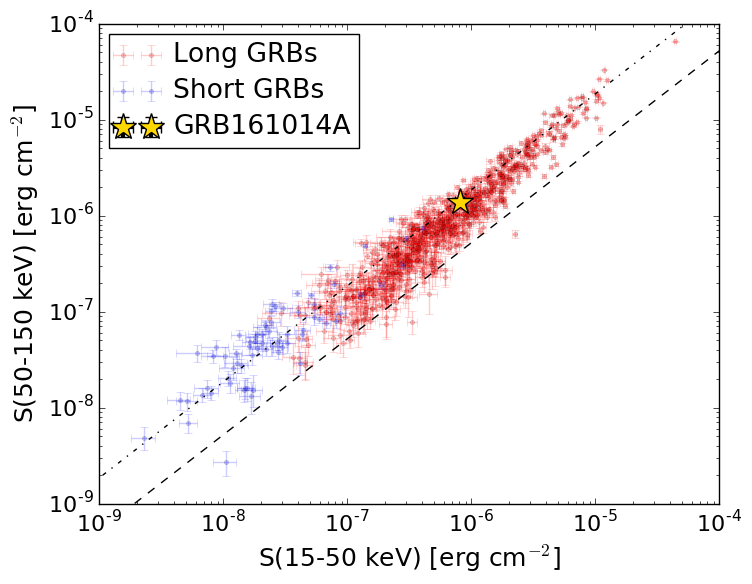
S(15-50 keV)  = 8.093026e-07
S(50-150 keV) = 1.3986438e-06
The dash-dotted line and the dashed line traces the fluences calculated from the Band function with Epeak = 15 and 150 keV, respectively. Both lines assume a canonical values of alpha = -1 and beta = -2.5.
Mask shadow pattern
IMX = -1.040027215880981E+00, IMY = -4.418580807368009E-01
Spacecraft aspect plot
Bright source in the pre-burst/pre-slew/post-slew images
Pre-burst image of 15-350 keV band
Time interval of the image:
-768.111420 -750.032000
-239.712000 -6.532000

# RAcent  DECcent POSerr Theta    Phi  PeakCts   SNR AngSep     Name
#  [deg]    [deg]    ['] [deg]  [deg]                   [']
299.5964  35.2232    1.1  48.1 -147.0   6.0271  10.6    1.3	Cyg X-1
308.1133  40.9517    2.0  39.3 -145.4   1.8644   5.9    0.1	Cyg X-3
326.2312  38.2794    7.2  28.7 -162.4   0.3556   1.6    3.8	Cyg X-2
 13.3766  10.3738    2.9  38.8   98.6   2.7892   3.9 ------	UNKNOWN
 59.3797  40.1376    3.4  39.9   14.3   1.0054   3.4 ------	UNKNOWN
317.4091   7.8397    3.2  56.1  173.5   4.0090   3.6 ------	UNKNOWN
 97.6990  57.2331    2.9  53.0  -23.5   2.3882   4.0 ------	UNKNOWN
Pre-slew background subtracted image of 15-350 keV band
Time interval of the image:
-6.532000 23.188600

# RAcent  DECcent POSerr Theta    Phi  PeakCts   SNR AngSep     Name
#  [deg]    [deg]    ['] [deg]  [deg]                   [']
299.4677  35.3168    3.8  48.1 -146.8   0.5049   3.1    9.2	Cyg X-1
308.1990  40.7483    9.9  39.4 -145.7  -0.1083  -1.2   12.9	Cyg X-3
326.3387  38.2732    8.4  28.6 -162.5  -0.0790  -1.4    8.4	Cyg X-2
 25.5968  17.8206    2.9  35.3   75.9   0.5086   3.9 ------	UNKNOWN
  5.5894  14.5066    2.3  33.8  110.6   0.5740   5.0 ------	UNKNOWN
332.6285   7.4688    0.8  48.5  157.0   3.1132  15.3 ------	UNKNOWN
 93.3028  45.2555    2.2  57.8   -9.7   1.4999   5.3 ------	UNKNOWN
305.8413  22.6002    2.0  52.1 -164.1   0.9503   5.8 ------	UNKNOWN
Post-slew image of 15-350 keV band
Time interval of the image:
106.788600 902.588600

# RAcent  DECcent POSerr Theta    Phi  PeakCts   SNR AngSep     Name
#  [deg]    [deg]    ['] [deg]  [deg]                   [']
299.6024  35.2197    0.5  40.9  -37.9  19.6848  25.3    1.2	Cyg X-1
308.0992  40.9932    1.7  39.9  -24.4   4.4138   6.6    2.5	Cyg X-3
326.0227  38.2538    4.3  31.2   -5.2   1.3534   2.7    8.1	Cyg X-2
346.3075 -46.9463    4.1  55.9  173.6   8.5606   2.8 ------	UNKNOWN