Analysis Summary
Notes:
- 1) No attempt has been made to eliminate the non-significant decimal places.
- 2) This batgrbproduct analysis is done using the HEASARC data.
- 3) This batgrbproduct analysis is using the flight position for the mask-weighting calculation.
======================================================================
                  BAT GRB EVENT DATA PROCESSING REPORT
    Process Script Ver: batgrbproduct v2.46
    Process Start Time: Thu Nov 17 12:16:07 EST 2016
             Host Name: bat1
   Current Working Dir: /local/data/bat1/alien/Swift_3rdBATcatalog/event/batevent_reproc/trigger718655
======================================================================

  Trigger: 00718655      Segment: 000

  BAT Trigger Time: 498797037.184   [s; MET]
      Trigger Stop: 498797045.376   [s; MET]
               UTC: 2016-10-22T02:43:40.140580    [includes UTCF correction]
       Where From?: TDRSS position message

  BAT
    RA: 128.967479986496   Dec: 54.3649243512647  [deg; J2000]

     Catalogged Source?: NO
     Point Source?:      YES
     GRB Indicated?:     YES    [ by BAT flight software ]
     Image S/N Ratio:    7.95
     Image Trigger?:     NO
     Rate S/N Ratio:     15.6524758424985  [ if not an image trigger ]
     Image S/N Ratio:    7.95

  Analysis Position:   [ source = BAT ]
    RA: 128.967479986496   Dec: 54.3649243512647  [deg; J2000]

  Refined Position:   [ source = BAT pre-slew burst ]
    RA: 128.989431309067   Dec: 54.3671841600484  [deg; J2000]
        { 08h 35m 57.5s , +54d 22' 01.9" }
         +/- 2.06953429159865 [arcmin] (estimated 90% radius based on SNR)
         +/- 1.16881990036662 [arcmin] (formal 1-sigma fit error)
    SNR: 10.7614742310809

  Angular difference between the analysis and refined position is 0.779224 arcmin

  Partial Coding Fraction: 0.1445312    [ including projection effects ]

  Duration
     T90: 7.24800002574921 +/- 1.06948960555395
        Measured from: 0.791999995708466
                   to: 8.04000002145767     [s; relative to TRIGTIME]
     T50: 4.16000002622604 +/- 0.861180577223804
        Measured from: 2.13599997758865
                   to: 6.2960000038147     [s; relative to TRIGTIME]


  Fluence
     Peak Flux  (peak 1 second)
        Measured from: 2.1240000128746
                   to: 3.1240000128746     [s; relative to TRIGTIME]
     Total Fluence
        Measured from: 0.551999986171722
                   to: 8.23199999332428     [s; relative to TRIGTIME]

             Band 1     Band 2     Band 3     Band 4
              15-25      25-50     50-100    100-350     keV
 Total     0.163769   0.336754   0.385943   0.081444
           0.043265   0.046261   0.041545   0.034640 [error]
 Peak      0.041673   0.043731   0.105958   0.022218
           0.015390   0.016863   0.016391   0.012793 [error]

     [ fluence units of on-axis counts / fully illuminated detector ]

======================================================================


====== Table of the duration information =============================

        Value   tstart    tstop
T100    7.680    0.552    8.232
T90     7.248    0.792    8.040
T50     4.160    2.136    6.296
Peak    1.000    2.124    3.124


====== Spectral Analysis Summary =====================================

Model      : spectral model: simple power-law (PL) and cutoff power-law (CPL)
Ph_index   : photon index: E^{Ph_index}
Ph_90err   : 90% error of the photon index
Epeak      : Epeak in keV
Epeak_90err: 90% error of Epeak
Norm       : normalization at 50 keV in both the PL model and CPL model
Nomr_90err : 90% error of the normalization
chi2       : Chi-Squared
dof        : degree of freedo

=== Time-averaged spectral analysis ===
(Best model with acceptable fit: PL)

Model Ph_index Ph_90err_low Ph_90err_hi  Epeak  Epeak_90err_low  Epeak_90err_hi  Norm       Nomr_90err_low    Norm_90err_hi    chi2    dof
PL      -1.141    -0.209      0.219       -           -               -         9.34e-03     -1.27e-03          1.26e-03      66.430   57
CPL      0.309    -1.063      1.421       90.783     -20.108        89.468      4.12e-02     -4.12e-02          1.20e-01      60.580   56


=== 1-s peak spectral analysis ===
(Best model with acceptable fit: PL)

Model Ph_index Ph_90err_low Ph_90err_hi  Epeak  Epeak_90err_low  Epeak_90err_hi  Norm       Nomr_90err_low    Norm_90err_hi    chi2    dof
PL      -1.384     -0.348     0.355       -           -               -         1.34e-02     -3.27e-03          3.25e-03      57.780   57
CPL      1.828     -2.563     5.342       77.184     -13.456        47.875      2.35e-01     -2.35e-01          1.56e+01      52.710   56


=== Fluence/Peak Flux Summary ===

              Model    Band1     Band2     Band3     Band4     Band5     Total
                       15-25     25-50    50-100    100-350    15-150    15-350    keV
Fluence         PL   6.55e-08  1.50e-07  2.72e-07  1.17e-06  7.41e-07  1.66e-06   erg/cm2
      90%_error_low -1.65e-08 -2.48e-08 -3.82e-08 -3.19e-07 -9.99e-08 -3.45e-07   erg/cm2
      90%_error_hi   1.80e-08  2.45e-08  3.79e-08  3.93e-07  1.00e-07  4.04e-07   erg/cm2
Peak flux       PL   4.92e-01  5.31e-01  4.06e-01  5.09e-01  1.62e+00  1.94e+00   ph/cm2/s
      90%_error_low -1.99e-01 -1.55e-01 -1.03e-01 -2.11e-01 -4.29e-01 -4.68e-01   ph/cm2/s
      90%_error_hi   2.28e-01  1.53e-01  1.02e-01  2.62e-01  4.34e-01  4.69e-01   ph/cm2/s

Fluence        CPL   4.56e-08  1.64e-07  3.14e-07  3.02e-07  7.01e-07  8.26e-07   erg/cm2
      90%_error_low -1.94e-08 -2.96e-08 -4.90e-08 -1.70e-07 -1.08e-07 -1.94e-07   erg/cm2
      90%_error_hi   2.21e-08  3.01e-08  5.06e-08  4.47e-07  1.07e-07  4.36e-07   erg/cm2
Peak flux      CPL   1.59e-01  5.22e-01  6.16e-01  1.68e-01  1.44e+00  1.47e+00   ph/cm2/s
      90%_error_low -1.59e-01 -2.53e-01 -1.91e-01 -1.17e-01 -4.31e-01 -4.54e-01   ph/cm2/s
      90%_error_hi   3.16e-01  2.13e-01  2.00e-01  2.15e-01  4.71e-01  5.17e-01   ph/cm2/s

======================================================================
Image
Pre-slew 15.0-350.0 keV image (Event data)
#   RAcent    DECcent   POSerr    Theta     Phi              Peak Cts       SNR   Name
  128.9894    54.3672   0.0178    45.1586   143.9563         1.0741530     10.761 TRIG_00718655

Foreground time interval of the image:
  0.552   8.232 (delta_t =   7.680 [sec])
Background time interval of the image:
-123.283   0.552 (delta_t = 123.835 [sec])
Light Curves
Note: The mask-weighted lightcurves have units of either count/det or counts/sec/det, where a det is 0.4 x 0.4 = 0.16 sq cm.
Full-time range; 1 s binning
Other quick-look light curves:
- 64 ms binning (zoomed)
- 16 ms binning (zoomed)
- 8 ms binning (zoomed)
- 2 ms binning (zoomed)
- SN=5 or 10 s binning (full-time range)
- Raw light curve
Spectra
- 64 ms binning (zoomed)
- 16 ms binning (zoomed)
- 8 ms binning (zoomed)
- 2 ms binning (zoomed)
- SN=5 or 10 s binning (full-time range)
- Raw light curve
Spectra
Notes:
- 1) The fitting includes the systematic errors.
- 2) When the burst includes telescope slew time periods, the fitting uses an average response file made from multiple 5-s response files through out the slew time plus single time preiod for the non-slew times, and weighted by the total counts in the corresponding time period using addrmf. An average response file is needed becuase a spectral fit using the pre-slew DRM will introduce some errors in both a spectral shape and a normalization if the PHA file contains a lot of the slew/post-slew time interval.
- 3) For fits to more complicated models (e.g. a power-law over a cutoff power-law), the BAT team has decided to require a chi-square improvement of more than 6 for each extra dof.
Time averaged spectrum fit using the average DRM
Power-law model
Time interval is from    0.552 sec. to    8.232 sec.

Spectral model in power-law:
------------------------------------------------------------
Parameters  : value       lower 90%   higher 90%
Photon index: -1.14081     ( -0.209325   0.218629 )
Norm@50keV  : 9.34407E-03    ( -0.00126638   0.00125874 )
------------------------------------------------------------
#Fit statistic : Chi-Squared =          66.43 using 59 PHA bins.
# Reduced chi-squared =          1.166 for     57 degrees of freedom
# Null hypothesis probability =   1.838651e-01

Photon flux (15-150 keV)    in 7.68 sec: 1.08857 ( -0.154781  0.15609 ) ph/cm2/s
Energy fluence (15-150 keV)             : 7.40886e-07 ( -9.98661e-08  1.00067e-07 ) ergs/cm2
Cutoff power-law model
Time interval is from    0.552 sec. to    8.232 sec.
Spectral model in the cutoff power-law:
------------------------------------------------------------
Parameters  : value       lower 90%   higher 90%
Photon index: 0.309463     ( -1.06303   1.42084 )
Epeak [keV] : 90.7828      ( -20.1077 89.4682 )
Norm@50keV  : 4.12240E-02    ( -0.041224   0.119551 )
------------------------------------------------------------
#Fit statistic : Chi-Squared =          60.58 using 59 PHA bins.
# Reduced chi-squared =          1.082 for     56 degrees of freedom
# Null hypothesis probability =   3.142971e-01

Photon flux (15-150 keV)    in 7.68 sec: 1.03071 ( -0.159927  0.16161 ) ph/cm2/s
Energy fluence (15-150 keV)             : 7.00989e-07 ( -1.07584e-07  1.06862e-07 ) ergs/cm2
1-s peak spectrum fit
Power-law model
Time interval is from    2.124 sec. to    3.124 sec.

Spectral model in power-law:
------------------------------------------------------------
Parameters  : value       lower 90%   higher 90%
Photon index: -1.3844     ( -0.347876   0.354695 )
Norm@50keV  : 1.33603E-02    ( -0.00327103   0.003255 )
------------------------------------------------------------
#Fit statistic : Chi-Squared =          57.78 using 59 PHA bins.
# Reduced chi-squared =          1.014 for     57 degrees of freedom
# Null hypothesis probability =   4.464076e-01

Photon flux (15-150 keV)    in 1 sec: 1.62141 ( -0.42854  0.43356 ) ph/cm2/s
Energy fluence (15-150 keV)             : 1.2953e-07 ( -3.15314e-08  3.14864e-08 ) ergs/cm2
Cutoff power-law model
Time interval is from    2.124 sec. to    3.124 sec.
Spectral model in the cutoff power-law:
------------------------------------------------------------
Parameters  : value       lower 90%   higher 90%
Photon index: 1.82848     ( -2.57978   5.32565 )
Epeak [keV] : 77.1842      ( -13.3984 47.9323 )
Norm@50keV  : 0.235355    ( -0.240845   15.601 )
------------------------------------------------------------
#Fit statistic : Chi-Squared =          52.71 using 59 PHA bins.
# Reduced chi-squared =         0.9413 for     56 degrees of freedom
# Null hypothesis probability =   6.000760e-01

Photon flux (15-150 keV)    in 1 sec: 1.43840 ( -0.43141  0.4707 ) ph/cm2/s
Energy fluence (15-150 keV)             : 1.32608e-07 ( -3.35818e-08  3.27252e-08 ) ergs/cm2
Time-resolved spectra
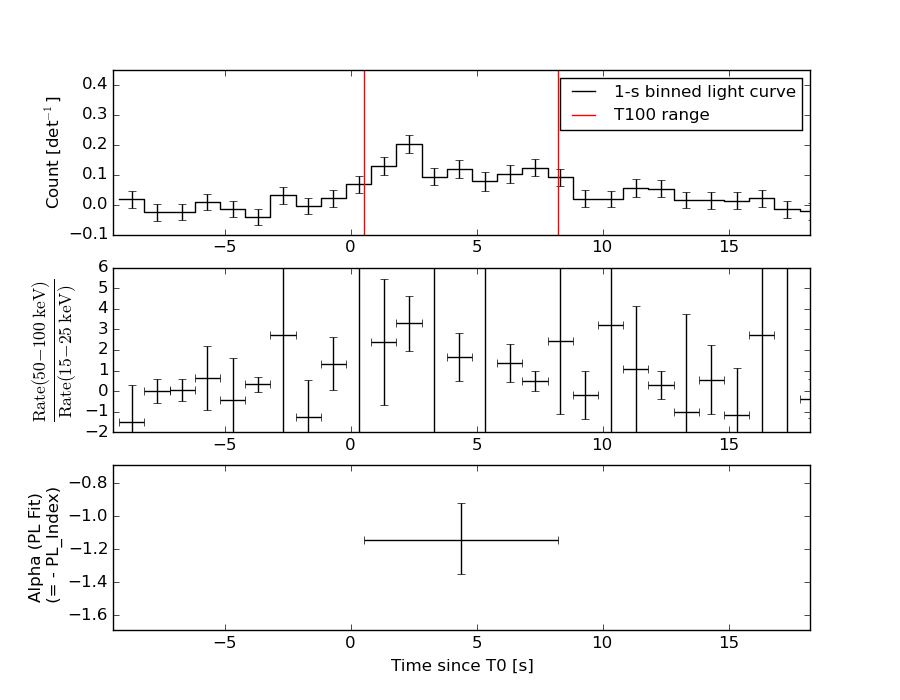
Distribution
T90 vs. Hardness ratio plot
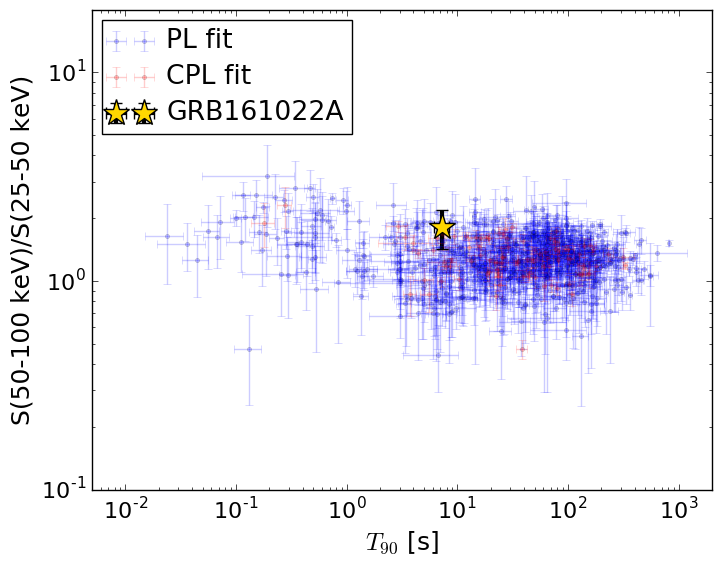
T90                                   = 7.248 sec.
Hardness ratio (energy fluence ratio) = 1.81392754209
S(15-50 keV) vs. S(50-150 keV) plot
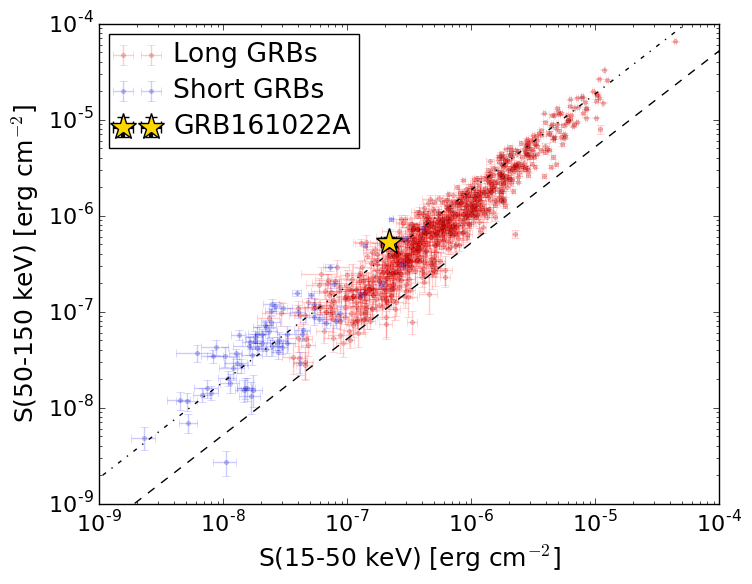
S(15-50 keV)  = 2.1565844e-07
S(50-150 keV) = 5.252229e-07
The dash-dotted line and the dashed line traces the fluences calculated from the Band function with Epeak = 15 and 150 keV, respectively. Both lines assume a canonical values of alpha = -1 and beta = -2.5.
Mask shadow pattern
IMX = -8.130564012112050E-01, IMY = -5.916677170269237E-01
Spacecraft aspect plot
Bright source in the pre-burst/pre-slew/post-slew images
Pre-burst image of 15-350 keV band
Time interval of the image:
-123.283390 0.552000

# RAcent  DECcent POSerr Theta    Phi  PeakCts   SNR AngSep     Name
#  [deg]    [deg]    ['] [deg]  [deg]                   [']
154.4150   6.9102    2.7   7.4   -6.9   0.5018   4.2 ------	UNKNOWN
161.6559  26.0163    2.6  13.2 -169.2   0.5271   4.4 ------	UNKNOWN
172.9176  39.7415    2.5  29.8 -166.9   0.6192   4.6 ------	UNKNOWN
172.1501 -40.4638    3.0  56.8  -29.8   2.9773   3.8 ------	UNKNOWN
200.4556  25.5201    2.1  43.6 -126.9   1.9729   5.4 ------	UNKNOWN
198.3215  11.5034    2.3  41.9 -106.1   2.8190   5.0 ------	UNKNOWN
Pre-slew background subtracted image of 15-350 keV band
Time interval of the image:
0.552000 8.232000

# RAcent  DECcent POSerr Theta    Phi  PeakCts   SNR AngSep     Name
#  [deg]    [deg]    ['] [deg]  [deg]                   [']
128.9894  54.3671    1.1  45.2  144.0   1.0743  10.8 ------	UNKNOWN
135.5425  37.1721    2.0  29.0  131.4   0.2251   5.7 ------	UNKNOWN
Post-slew image of 15-350 keV band
Time interval of the image:
117.316590 962.950400

# RAcent  DECcent POSerr Theta    Phi  PeakCts   SNR AngSep     Name
#  [deg]    [deg]    ['] [deg]  [deg]                   [']
 74.6491  36.8693    2.7  40.6   71.5   8.2096   4.3 ------	UNKNOWN
 56.5946  63.6475    4.6  36.2  118.4   2.7257   2.5 ------	UNKNOWN
114.8285  61.5003    2.4  10.3  123.6   2.0397   4.9 ------	UNKNOWN
238.1217  53.6398    4.0  57.2 -154.1  10.9157   2.9 ------	UNKNOWN
142.9362   1.2452    5.0  54.3  -33.2   6.8041   2.3 ------	UNKNOWN
206.3652  45.6079    3.4  48.0 -129.1   9.2241   3.4 ------	UNKNOWN