Analysis Summary
Notes:
- 1) No attempt has been made to eliminate the non-significant decimal places.
- 2) This batgrbproduct analysis is done using the HEASARC data.
- 3) This batgrbproduct analysis is using the flight position for the mask-weighting calculation.
======================================================================
                  BAT GRB EVENT DATA PROCESSING REPORT
    Process Script Ver: batgrbproduct v2.46
    Process Start Time: Sun Dec  4 15:38:07 EST 2016
             Host Name: bat1
   Current Working Dir: /local/data/bat1/alien/Swift_3rdBATcatalog/event/batevent_reproc/trigger720697
======================================================================

  Trigger: 00720697      Segment: 000

  BAT Trigger Time: 500014399.488   [s; MET]
      Trigger Stop: 500014400.512   [s; MET]
               UTC: 2016-11-05T04:53:02.375560    [includes UTCF correction]
       Where From?: TDRSS position message

  BAT
    RA: 120.162953074002   Dec: -44.7796477196195  [deg; J2000]

     Catalogged Source?: NO
     Point Source?:      YES
     GRB Indicated?:     YES    [ by BAT flight software ]
     Image S/N Ratio:    10.86
     Image Trigger?:     NO
     Rate S/N Ratio:     17.058722109232  [ if not an image trigger ]
     Image S/N Ratio:    10.86

  Analysis Position:   [ source = BAT ]
    RA: 120.162953074002   Dec: -44.7796477196195  [deg; J2000]

  Refined Position:   [ source = BAT pre-slew burst ]
    RA: 120.190331587209   Dec: -44.7647100034937  [deg; J2000]
        { 08h 00m 45.7s , -44d 45' 53.0" }
         +/- 1.09878569975036 [arcmin] (estimated 90% radius based on SNR)
         +/- 0.481269284568821 [arcmin] (formal 1-sigma fit error)
    SNR: 26.5871165325324

  Angular difference between the analysis and refined position is 1.470805 arcmin

  Partial Coding Fraction: 0.859375    [ including projection effects ]

  Duration
     T90: 177.695999979973 +/- 25.073484405906
        Measured from: -57.555999994278
                   to: 120.139999985695     [s; relative to TRIGTIME]
     T50: 62.8199999928474 +/- 2.38097120413656
        Measured from: 1.20800000429153
                   to: 64.027999997139     [s; relative to TRIGTIME]


  Fluence
     Peak Flux  (peak 1 second)
        Measured from: 0.632000029087067
                   to: 1.63200002908707     [s; relative to TRIGTIME]
     Total Fluence
        Measured from: -87.039999961853
                   to: 161.076000034809     [s; relative to TRIGTIME]

             Band 1     Band 2     Band 3     Band 4
              15-25      25-50     50-100    100-350     keV
 Total     2.177770   3.652139   2.902598   0.709829
           0.095559   0.098600   0.085292   0.071391 [error]
 Peak      0.019616   0.071887   0.068376   0.035142
           0.006566   0.007143   0.006683   0.005194 [error]

     [ fluence units of on-axis counts / fully illuminated detector ]

======================================================================


====== Table of the duration information =============================

        Value   tstart    tstop
T100  248.116  -87.040  161.076
T90   177.696  -57.556  120.140
T50    62.820    1.208   64.028
Peak    1.000    0.632    1.632


====== Spectral Analysis Summary =====================================

Model      : spectral model: simple power-law (PL) and cutoff power-law (CPL)
Ph_index   : photon index: E^{Ph_index}
Ph_90err   : 90% error of the photon index
Epeak      : Epeak in keV
Epeak_90err: 90% error of Epeak
Norm       : normalization at 50 keV in both the PL model and CPL model
Nomr_90err : 90% error of the normalization
chi2       : Chi-Squared
dof        : degree of freedo

=== Time-averaged spectral analysis ===
(Best model with acceptable fit: PL)

Model Ph_index Ph_90err_low Ph_90err_hi  Epeak  Epeak_90err_low  Epeak_90err_hi  Norm       Nomr_90err_low    Norm_90err_hi    chi2    dof
PL      -1.349    -0.058      0.059       -           -               -         2.54e-03     -8.11e-05          8.10e-05      60.070   57
CPL     -1.052    -0.231      0.244      172.337     -54.035       361.581      3.50e-03     -7.53e-04          1.02e-03      55.180   56


=== 1-s peak spectral analysis ===
(Best model with acceptable fit: PL)

Model Ph_index Ph_90err_low Ph_90err_hi  Epeak  Epeak_90err_low  Epeak_90err_hi  Norm       Nomr_90err_low    Norm_90err_hi    chi2    dof
PL      -0.749     -0.185     0.195       -           -               -         1.26e-02     -1.47e-03          1.44e-03      62.000   57
CPL     -0.342     -0.515     0.847      253.383    -253.383      -253.383      1.85e-02     -6.96e-03          2.09e-02      61.090   56


=== Fluence/Peak Flux Summary ===

              Model    Band1     Band2     Band3     Band4     Band5     Total
                       15-25     25-50    50-100    100-350    15-150    15-350    keV
Fluence         PL   6.99e-07  1.41e-06  2.21e-06  7.68e-06  6.16e-06  1.20e-05   erg/cm2
      90%_error_low -4.40e-08 -5.26e-08 -8.48e-08 -6.51e-07 -2.11e-07 -7.00e-07   erg/cm2
      90%_error_hi   4.50e-08  5.24e-08  8.46e-08  6.93e-07  2.11e-07  7.35e-07   erg/cm2
Peak flux       PL   2.54e-01  4.01e-01  4.77e-01  1.10e+00  1.45e+00  2.24e+00   ph/cm2/s
      90%_error_low -6.03e-02 -6.18e-02 -5.04e-02 -2.35e-01 -1.61e-01 -2.61e-01   ph/cm2/s
      90%_error_hi   6.66e-02  6.13e-02  5.03e-02  2.77e-01  1.61e-01  2.75e-01   ph/cm2/s

Fluence        CPL   6.54e-07  1.44e-06  2.26e-06  5.09e-06  6.03e-06  9.45e-06   erg/cm2
      90%_error_low -5.46e-08 -5.83e-08 -9.48e-08 -1.32e-06 -2.34e-07 -1.32e-06   erg/cm2
      90%_error_hi   5.57e-08  5.88e-08  9.56e-08  1.89e-06  2.33e-07  1.87e-06   erg/cm2
Peak flux      CPL   2.23e-01  4.05e-01  5.03e-01  7.68e-01  1.43e+00  1.90e+00   ph/cm2/s
      90%_error_low -7.56e-02 -6.53e-02 -6.60e-02 -3.49e-01 -1.64e-01 -3.90e-01   ph/cm2/s
      90%_error_hi   8.18e-02  6.53e-02  6.81e-02  4.35e-01  1.65e-01  4.77e-01   ph/cm2/s

======================================================================
Image
Pre-slew 15.0-350.0 keV image (Event data)
#   RAcent    DECcent   POSerr    Theta     Phi              Peak Cts       SNR   Name
  120.1903   -44.7647   0.0073    24.4252    20.8951         3.9543504     26.587 TRIG_00720697

Foreground time interval of the image:
-87.040  11.413 (delta_t =  98.453 [sec])
Background time interval of the image:
-495.087 -476.441 (delta_t =  18.647 [sec])
-239.488 -87.040 (delta_t = 152.448 [sec])
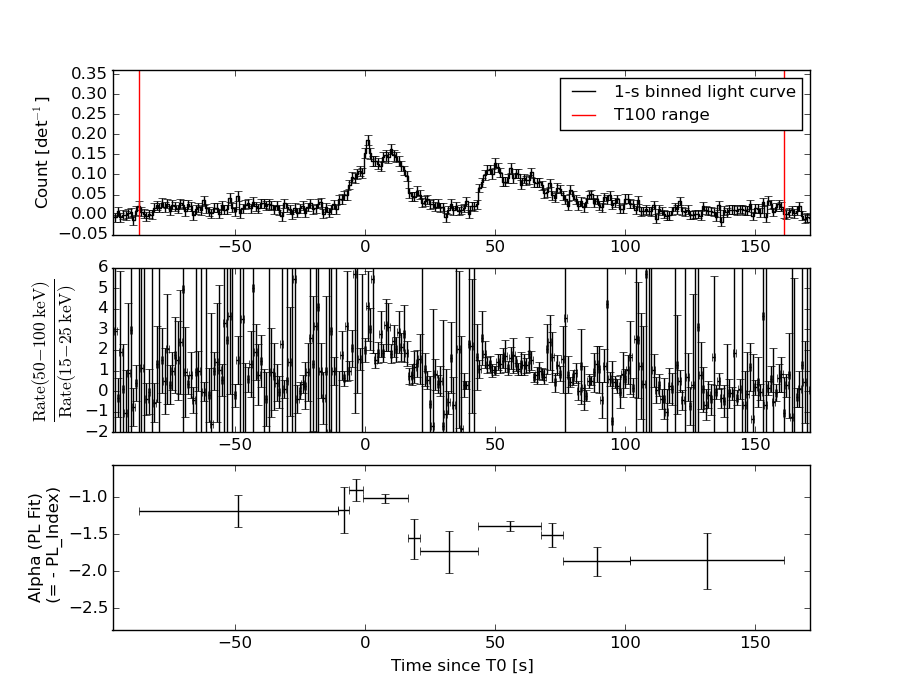
Light Curves
Note: The mask-weighted lightcurves have units of either count/det or counts/sec/det, where a det is 0.4 x 0.4 = 0.16 sq cm.
Full-time range; 1 s binning
Other quick-look light curves:
- 64 ms binning (zoomed)
- 16 ms binning (zoomed)
- 8 ms binning (zoomed)
- 2 ms binning (zoomed)
- SN=5 or 10 s binning (full-time range)
- Raw light curve
Spectra
- 64 ms binning (zoomed)
- 16 ms binning (zoomed)
- 8 ms binning (zoomed)
- 2 ms binning (zoomed)
- SN=5 or 10 s binning (full-time range)
- Raw light curve
Spectra
Notes:
- 1) The fitting includes the systematic errors.
- 2) When the burst includes telescope slew time periods, the fitting uses an average response file made from multiple 5-s response files through out the slew time plus single time preiod for the non-slew times, and weighted by the total counts in the corresponding time period using addrmf. An average response file is needed becuase a spectral fit using the pre-slew DRM will introduce some errors in both a spectral shape and a normalization if the PHA file contains a lot of the slew/post-slew time interval.
- 3) For fits to more complicated models (e.g. a power-law over a cutoff power-law), the BAT team has decided to require a chi-square improvement of more than 6 for each extra dof.
Time averaged spectrum fit using the average DRM
Power-law model
Time interval is from  -87.040 sec. to  161.076 sec.

Spectral model in power-law:
------------------------------------------------------------
Parameters  : value       lower 90%   higher 90%
Photon index: -1.34878     ( -0.0583366   0.0585581 )
Norm@50keV  : 2.54032E-03    ( -8.10466e-05   8.10457e-05 )
------------------------------------------------------------
#Fit statistic : Chi-Squared =          60.07 using 59 PHA bins.
# Reduced chi-squared =          1.054 for     57 degrees of freedom
# Null hypothesis probability =   3.652019e-01

Photon flux (15-150 keV)    in 248.1 sec: 0.305962 ( -0.010476  0.0105 ) ph/cm2/s
Energy fluence (15-150 keV)             : 6.15797e-06 ( -2.10845e-07  2.11261e-07 ) ergs/cm2
Cutoff power-law model
Time interval is from  -87.040 sec. to  161.076 sec.
Spectral model in the cutoff power-law:
------------------------------------------------------------
Parameters  : value       lower 90%   higher 90%
Photon index: -1.05194     ( -0.230819   0.243665 )
Epeak [keV] : 172.337      ( -54.0354 361.58 )
Norm@50keV  : 3.49868E-03    ( -0.000752747   0.00102037 )
------------------------------------------------------------
#Fit statistic : Chi-Squared =          55.18 using 59 PHA bins.
# Reduced chi-squared =         0.9854 for     56 degrees of freedom
# Null hypothesis probability =   5.057373e-01

Photon flux (15-150 keV)    in 248.1 sec: 0.300546 ( -0.011227  0.011248 ) ph/cm2/s
Energy fluence (15-150 keV)             : 6.03054e-06 ( -2.3443e-07  2.33386e-07 ) ergs/cm2
1-s peak spectrum fit
Power-law model
Time interval is from    0.632 sec. to    1.632 sec.

Spectral model in power-law:
------------------------------------------------------------
Parameters  : value       lower 90%   higher 90%
Photon index: -0.748826     ( -0.184727   0.195106 )
Norm@50keV  : 1.26117E-02    ( -0.00146579   0.00144 )
------------------------------------------------------------
#Fit statistic : Chi-Squared =          62.00 using 59 PHA bins.
# Reduced chi-squared =          1.088 for     57 degrees of freedom
# Null hypothesis probability =   3.023858e-01

Photon flux (15-150 keV)    in 1 sec: 1.45293 ( -0.16059  0.16134 ) ph/cm2/s
Energy fluence (15-150 keV)             : 1.50664e-07 ( -1.63999e-08  1.64335e-08 ) ergs/cm2
Cutoff power-law model
Time interval is from    0.632 sec. to    1.632 sec.
Spectral model in the cutoff power-law:
------------------------------------------------------------
Parameters  : value       lower 90%   higher 90%
Photon index: -0.341657     ( -0.515481   0.847454 )
Epeak [keV] : 253.383      ( -253.387 -253.387 )
Norm@50keV  : 1.85105E-02    ( -0.00695557   0.0208913 )
------------------------------------------------------------
#Fit statistic : Chi-Squared =          61.09 using 59 PHA bins.
# Reduced chi-squared =          1.091 for     56 degrees of freedom
# Null hypothesis probability =   2.982625e-01

Photon flux (15-150 keV)    in 1 sec: 1.43317 ( -0.16376  0.16477 ) ph/cm2/s
Energy fluence (15-150 keV)             : 1.48977e-07 ( -1.71179e-08  1.689e-08 ) ergs/cm2
Time-resolved spectra
Distribution
T90 vs. Hardness ratio plot
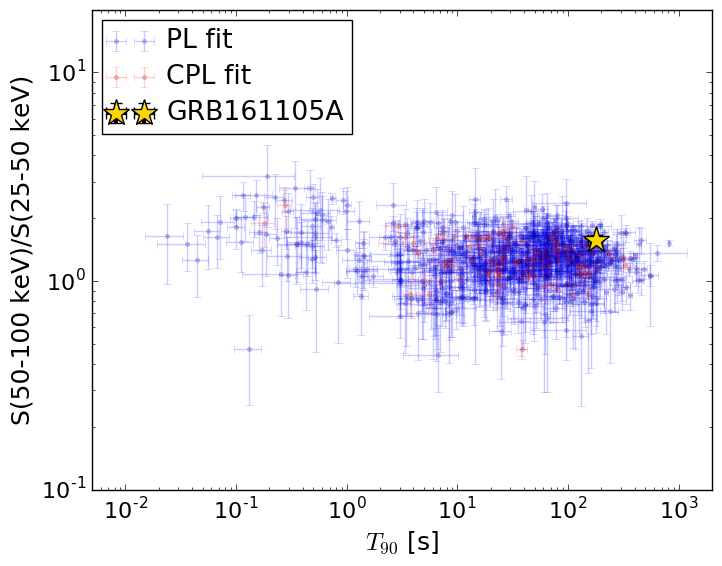
T90                                   = 177.696 sec.
Hardness ratio (energy fluence ratio) = 1.57050792693
S(15-50 keV) vs. S(50-150 keV) plot
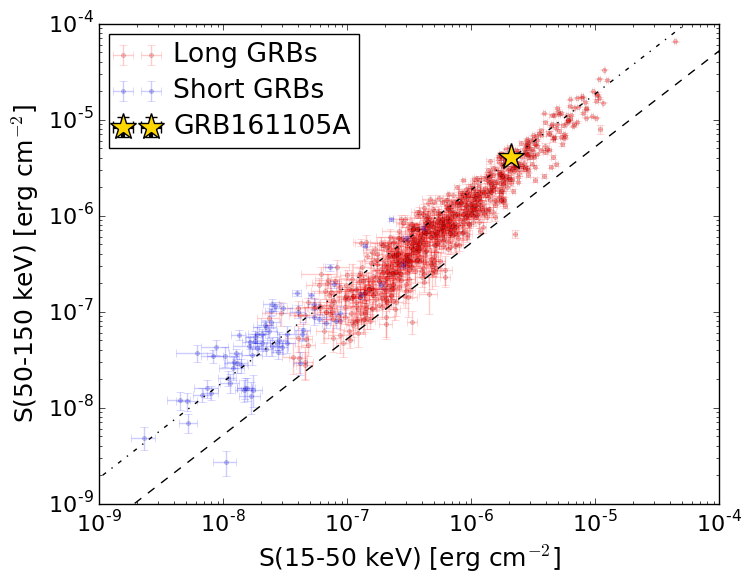
S(15-50 keV)  = 2.1067077e-06
S(50-150 keV) = 4.051249e-06
The dash-dotted line and the dashed line traces the fluences calculated from the Band function with Epeak = 15 and 150 keV, respectively. Both lines assume a canonical values of alpha = -1 and beta = -2.5.
Mask shadow pattern
IMX = 4.242829305703341E-01, IMY = -1.619759500832458E-01
Spacecraft aspect plot
Bright source in the pre-burst/pre-slew/post-slew images
Pre-burst image of 15-350 keV band
Time interval of the image:
-495.087400 -476.440600
-239.488000 -87.040000

# RAcent  DECcent POSerr Theta    Phi  PeakCts   SNR AngSep     Name
#  [deg]    [deg]    ['] [deg]  [deg]                   [']
135.3829 -40.5993    3.8  15.7   -3.5   0.6241   3.1    7.2	Vela X-1
170.0742 -60.7080   16.4  41.9  -33.6   0.2278   0.7    8.7	Cen X-3
186.8501 -62.6298    4.8  49.5  -37.7   1.5266   2.4   10.0	GX 301-2
 97.0640 -26.2328    2.8  36.7   68.4   1.8760   4.1 ------	UNKNOWN
162.1094  27.6478    2.1  57.6 -165.2   6.5017   5.5 ------	UNKNOWN
Pre-slew background subtracted image of 15-350 keV band
Time interval of the image:
-87.040000 11.412630

# RAcent  DECcent POSerr Theta    Phi  PeakCts   SNR AngSep     Name
#  [deg]    [deg]    ['] [deg]  [deg]                   [']
135.4391 -40.3872   10.5  15.5   -3.6   0.1497   1.1   10.8	Vela X-1
170.2997 -60.4776   14.0  41.9  -33.9  -0.2020  -0.8    8.7	Cen X-3
186.4798 -62.9431    5.2  49.5  -37.3   0.9953   2.2   11.4	GX 301-2
 95.8445 -18.5986    2.6  39.4   80.1   2.3831   4.4 ------	UNKNOWN
112.0972 -26.7455    1.7  23.3   69.4   1.1204   6.7 ------	UNKNOWN
123.2993   1.4618    2.2  30.0  139.1   1.0397   5.3 ------	UNKNOWN
120.1903 -44.7647    0.4  24.4   20.9   3.9520  26.5 ------	UNKNOWN
165.0034  19.6561    2.5  51.8 -157.6   1.9891   4.6 ------	UNKNOWN
165.6374   9.9596    2.2  44.2 -149.5   1.4479   5.3 ------	UNKNOWN
Post-slew image of 15-350 keV band
Time interval of the image:
57.012600 962.635700

# RAcent  DECcent POSerr Theta    Phi  PeakCts   SNR AngSep     Name
#  [deg]    [deg]    ['] [deg]  [deg]                   [']
135.5535 -40.5848    3.2  12.0 -123.5   2.6033   3.6    2.1	Vela X-1
170.5714 -60.6288   85.3  33.3  -61.9   0.1551   0.1    7.5	Cen X-3
186.5647 -62.9727   48.5  40.8  -58.0   0.4631   0.2   12.4	GX 301-2
 62.8209 -38.0032    2.5  42.7   59.9  11.0826   4.5 ------	UNKNOWN
 91.5612 -18.3096    3.1  35.6  110.3   6.3556   3.7 ------	UNKNOWN
120.4643   7.6046    3.9  52.4  162.0  10.1724   3.0 ------	UNKNOWN
 55.5227 -67.3936    2.6  39.9   14.4   4.4207   4.5 ------	UNKNOWN
125.8275 -32.6628    3.2  12.9 -176.6   2.3361   3.6 ------	UNKNOWN
 84.3144 -76.5154    2.7  35.0   -4.6   3.9546   4.2 ------	UNKNOWN
138.1898   8.4758    5.0  55.7 -176.7   7.8719   2.3 ------	UNKNOWN
144.7974 -65.8846    3.3  25.0  -42.2   3.0653   3.6 ------	UNKNOWN
156.5962 -68.1694    2.8  30.0  -44.6   3.6087   4.1 ------	UNKNOWN