Analysis Summary
Notes:
- 1) No attempt has been made to eliminate the non-significant decimal places.
- 2) This batgrbproduct analysis is done using the HEASARC data.
- 3) This batgrbproduct analysis is using the flight position for the mask-weighting calculation.
======================================================================
                  BAT GRB EVENT DATA PROCESSING REPORT
    Process Script Ver: batgrbproduct v2.46
    Process Start Time: Sun Dec  4 15:33:31 EST 2016
             Host Name: bat1
   Current Working Dir: /local/data/bat1/alien/Swift_3rdBATcatalog/event/batevent_reproc/trigger721234
======================================================================

  Trigger: 00721234      Segment: 000

  BAT Trigger Time: 500268770.304   [s; MET]
      Trigger Stop: 500268774.4   [s; MET]
               UTC: 2016-11-08T03:32:33.177140    [includes UTCF correction]
       Where From?: TDRSS position message

  BAT
    RA: 180.783723776048   Dec: 24.8691396176327  [deg; J2000]

     Catalogged Source?: NO
     Point Source?:      YES
     GRB Indicated?:     YES    [ by BAT flight software ]
     Image S/N Ratio:    7.76
     Image Trigger?:     NO
     Rate S/N Ratio:     10.5830052442584  [ if not an image trigger ]
     Image S/N Ratio:    7.76

  Analysis Position:   [ source = BAT ]
    RA: 180.783723776048   Dec: 24.8691396176327  [deg; J2000]

  Refined Position:   [ source = BAT pre-slew burst ]
    RA: 180.780036135262   Dec: 24.9049778897337  [deg; J2000]
        { 12h 03m 07.2s , +24d 54' 17.9" }
         +/- 1.85186791844804 [arcmin] (estimated 90% radius based on SNR)
         +/- 1.31608467197713 [arcmin] (formal 1-sigma fit error)
    SNR: 12.6129992073679

  Angular difference between the analysis and refined position is 2.159643 arcmin

  Partial Coding Fraction: 0.953125    [ including projection effects ]

  Duration
     T90: 115.835999906063 +/- 11.6600351623619
        Measured from: -0.495999991893768
                   to: 115.339999914169     [s; relative to TRIGTIME]
     T50: 79.4799999594688 +/- 11.3451261957804
        Measured from: 7.27599996328354
                   to: 86.7559999227524     [s; relative to TRIGTIME]


  Fluence
     Peak Flux  (peak 1 second)
        Measured from: -1.80400002002716
                   to: -0.804000020027161     [s; relative to TRIGTIME]
     Total Fluence
        Measured from: -1.90400004386902
                   to: 126.755999982357     [s; relative to TRIGTIME]

             Band 1     Band 2     Band 3     Band 4
              15-25      25-50     50-100    100-350     keV
 Total     0.720930   0.739977   0.483102   0.039515
           0.060149   0.062129   0.052665   0.044194 [error]
 Peak      0.031894   0.032535   0.008618   0.000440
           0.005509   0.005725   0.004723   0.003849 [error]

     [ fluence units of on-axis counts / fully illuminated detector ]

======================================================================


====== Table of the duration information =============================

        Value   tstart    tstop
T100  128.660   -1.904  126.756
T90   115.836   -0.496  115.340
T50    79.480    7.276   86.756
Peak    1.000   -1.804   -0.804


====== Spectral Analysis Summary =====================================

Model      : spectral model: simple power-law (PL) and cutoff power-law (CPL)
Ph_index   : photon index: E^{Ph_index}
Ph_90err   : 90% error of the photon index
Epeak      : Epeak in keV
Epeak_90err: 90% error of Epeak
Norm       : normalization at 50 keV in both the PL model and CPL model
Nomr_90err : 90% error of the normalization
chi2       : Chi-Squared
dof        : degree of freedo

=== Time-averaged spectral analysis ===
(Best model with acceptable fit: PL)

Model Ph_index Ph_90err_low Ph_90err_hi  Epeak  Epeak_90err_low  Epeak_90err_hi  Norm       Nomr_90err_low    Norm_90err_hi    chi2    dof
PL      -1.785    -0.163      0.158       -           -               -         9.26e-04     -9.56e-05          9.40e-05      46.500   57
CPL     -1.312    -0.560      0.677       65.124     -17.764       -65.124      1.69e-03     -8.14e-04          2.23e-03      44.620   56


=== 1-s peak spectral analysis ===
(Best model with acceptable fit: PL)

Model Ph_index Ph_90err_low Ph_90err_hi  Epeak  Epeak_90err_low  Epeak_90err_hi  Norm       Nomr_90err_low    Norm_90err_hi    chi2    dof
PL      -2.072     -0.407     0.357       -           -               -         3.88e-03     -1.12e-03          1.09e-03      59.950   57
CPL      0.048     -2.040     3.268       35.961     -16.204        18.499      7.86e-02     -7.86e-02          8.16e+00      56.840   56


=== Fluence/Peak Flux Summary ===

              Model    Band1     Band2     Band3     Band4     Band5     Total
                       15-25     25-50    50-100    100-350    15-150    15-350    keV
Fluence         PL   1.99e-07  3.08e-07  3.57e-07  7.97e-07  1.10e-06  1.66e-06   erg/cm2
      90%_error_low -2.60e-08 -2.70e-08 -4.97e-08 -2.04e-07 -1.15e-07 -2.58e-07   erg/cm2
      90%_error_hi   2.67e-08  2.71e-08  5.01e-08  2.47e-07  1.17e-07  2.92e-07   erg/cm2
Peak flux       PL   2.78e-01  2.00e-01  9.50e-02  6.37e-02  6.03e-01  6.36e-01   ph/cm2/s
      90%_error_low -7.22e-02 -4.27e-02 -3.41e-02 -3.44e-02 -1.25e-01 -1.35e-01   ph/cm2/s
      90%_error_hi   7.45e-02  4.23e-02  3.61e-02  5.23e-02  1.25e-01  1.36e-01   ph/cm2/s

Fluence        CPL   1.89e-07  3.25e-07  3.58e-07  3.68e-07  1.05e-06  1.24e-06   erg/cm2
      90%_error_low -2.97e-08 -3.48e-08 -5.40e-08 -2.17e-07 -1.27e-07 -2.57e-07   erg/cm2
      90%_error_hi   2.97e-08  3.58e-08  5.37e-08  5.02e-07  1.31e-07  5.35e-07   erg/cm2
Peak flux      CPL   2.46e-01  2.54e-01  7.65e-02  4.45e-03  5.80e-01  5.80e-01   ph/cm2/s
      90%_error_low -8.83e-02 -6.67e-02 -4.28e-02 -4.45e-03 -1.23e-01 -1.23e-01   ph/cm2/s
      90%_error_hi   8.50e-02  6.91e-02  4.72e-02  5.22e-02  1.24e-01  1.25e-01   ph/cm2/s

======================================================================
Image
Pre-slew 15.0-350.0 keV image (Event data)
#   RAcent    DECcent   POSerr    Theta     Phi              Peak Cts       SNR   Name
  180.7800    24.9050   0.0153    12.3519    54.5992         0.7910670     12.613 TRIG_00721234

Foreground time interval of the image:
 -1.904  35.797 (delta_t =  37.701 [sec])
Background time interval of the image:
-239.304  -1.904 (delta_t = 237.400 [sec])
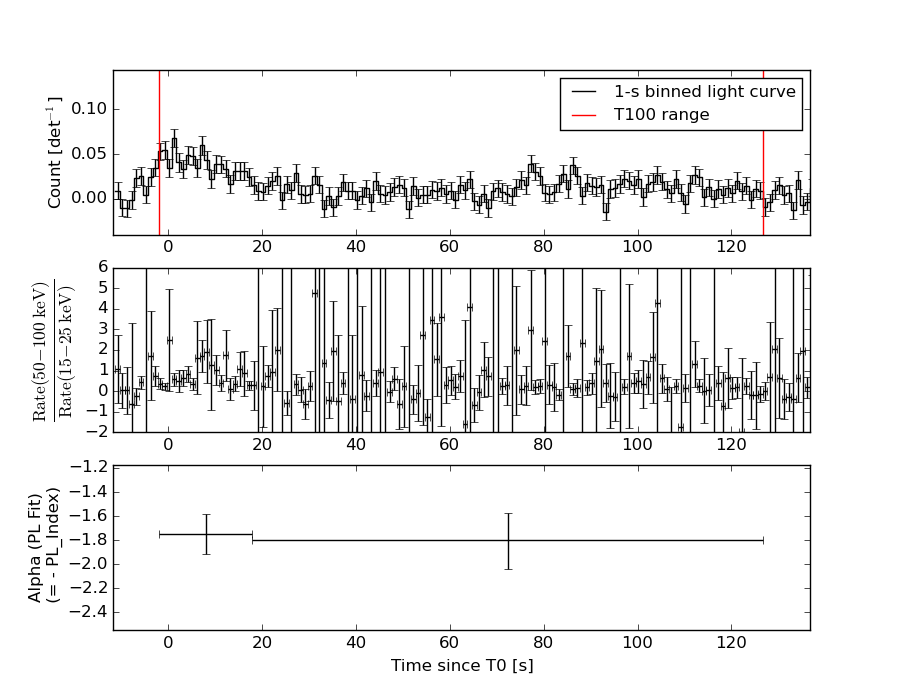
Light Curves
Note: The mask-weighted lightcurves have units of either count/det or counts/sec/det, where a det is 0.4 x 0.4 = 0.16 sq cm.
Full-time range; 1 s binning
Other quick-look light curves:
- 64 ms binning (zoomed)
- 16 ms binning (zoomed)
- 8 ms binning (zoomed)
- 2 ms binning (zoomed)
- SN=5 or 10 s binning (full-time range)
- Raw light curve
Spectra
- 64 ms binning (zoomed)
- 16 ms binning (zoomed)
- 8 ms binning (zoomed)
- 2 ms binning (zoomed)
- SN=5 or 10 s binning (full-time range)
- Raw light curve
Spectra
Notes:
- 1) The fitting includes the systematic errors.
- 2) When the burst includes telescope slew time periods, the fitting uses an average response file made from multiple 5-s response files through out the slew time plus single time preiod for the non-slew times, and weighted by the total counts in the corresponding time period using addrmf. An average response file is needed becuase a spectral fit using the pre-slew DRM will introduce some errors in both a spectral shape and a normalization if the PHA file contains a lot of the slew/post-slew time interval.
- 3) For fits to more complicated models (e.g. a power-law over a cutoff power-law), the BAT team has decided to require a chi-square improvement of more than 6 for each extra dof.
Time averaged spectrum fit using the average DRM
Power-law model
Time interval is from   -1.904 sec. to  126.756 sec.

Spectral model in power-law:
------------------------------------------------------------
Parameters  : value       lower 90%   higher 90%
Photon index: -1.78538     ( -0.163376   0.158192 )
Norm@50keV  : 9.26392E-04    ( -9.55836e-05   9.4012e-05 )
------------------------------------------------------------
#Fit statistic : Chi-Squared =          46.50 using 59 PHA bins.
# Reduced chi-squared =         0.8157 for     57 degrees of freedom
# Null hypothesis probability =   8.384547e-01

Photon flux (15-150 keV)    in 128.7 sec: 0.126945 ( -0.011231  0.011235 ) ph/cm2/s
Energy fluence (15-150 keV)             : 1.0984e-06 ( -1.1509e-07  1.17031e-07 ) ergs/cm2
Cutoff power-law model
Time interval is from   -1.904 sec. to  126.756 sec.
Spectral model in the cutoff power-law:
------------------------------------------------------------
Parameters  : value       lower 90%   higher 90%
Photon index: -1.31245     ( -0.560203   0.676887 )
Epeak [keV] : 65.1245      ( -17.7633 -65.1243 )
Norm@50keV  : 1.68831E-03    ( -0.000813865   0.0022343 )
------------------------------------------------------------
#Fit statistic : Chi-Squared =          44.62 using 59 PHA bins.
# Reduced chi-squared =         0.7968 for     56 degrees of freedom
# Null hypothesis probability =   8.629685e-01

Photon flux (15-150 keV)    in 128.7 sec: 0.124520 ( -0.011622  0.011618 ) ph/cm2/s
Energy fluence (15-150 keV)             : 1.04995e-06 ( -1.26914e-07  1.3053e-07 ) ergs/cm2
1-s peak spectrum fit
Power-law model
Time interval is from   -1.804 sec. to   -0.804 sec.

Spectral model in power-law:
------------------------------------------------------------
Parameters  : value       lower 90%   higher 90%
Photon index: -2.07186     ( -0.407558   0.356825 )
Norm@50keV  : 3.88411E-03    ( -0.00112305   0.00108889 )
------------------------------------------------------------
#Fit statistic : Chi-Squared =          59.95 using 59 PHA bins.
# Reduced chi-squared =          1.052 for     57 degrees of freedom
# Null hypothesis probability =   3.691385e-01

Photon flux (15-150 keV)    in 1 sec: 0.602773 ( -0.124739  0.124788 ) ph/cm2/s
Energy fluence (15-150 keV)             : 3.60048e-08 ( -9.23717e-09  9.71665e-09 ) ergs/cm2
Cutoff power-law model
Time interval is from   -1.804 sec. to   -0.804 sec.
Spectral model in the cutoff power-law:
------------------------------------------------------------
Parameters  : value       lower 90%   higher 90%
Photon index: 0.048462     ( -2.09925   3.20872 )
Epeak [keV] : 35.9612      ( -16.2287 18.4743 )
Norm@50keV  : 7.85554E-02    ( -0.0913179   8.14385 )
------------------------------------------------------------
#Fit statistic : Chi-Squared =          56.84 using 59 PHA bins.
# Reduced chi-squared =          1.015 for     56 degrees of freedom
# Null hypothesis probability =   4.435280e-01

Photon flux (15-150 keV)    in 1 sec: 0.579797 ( -0.122775  0.124235 ) ph/cm2/s
Energy fluence (15-150 keV)             : 3.04586e-08 ( -7.56205e-09  9.9543e-09 ) ergs/cm2
Time-resolved spectra
Distribution
T90 vs. Hardness ratio plot
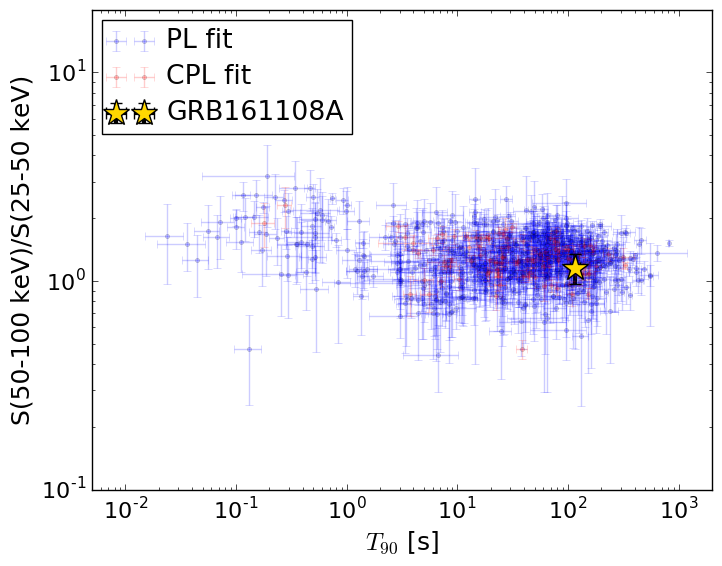
T90                                   = 115.836 sec.
Hardness ratio (energy fluence ratio) = 1.16043290159
S(15-50 keV) vs. S(50-150 keV) plot
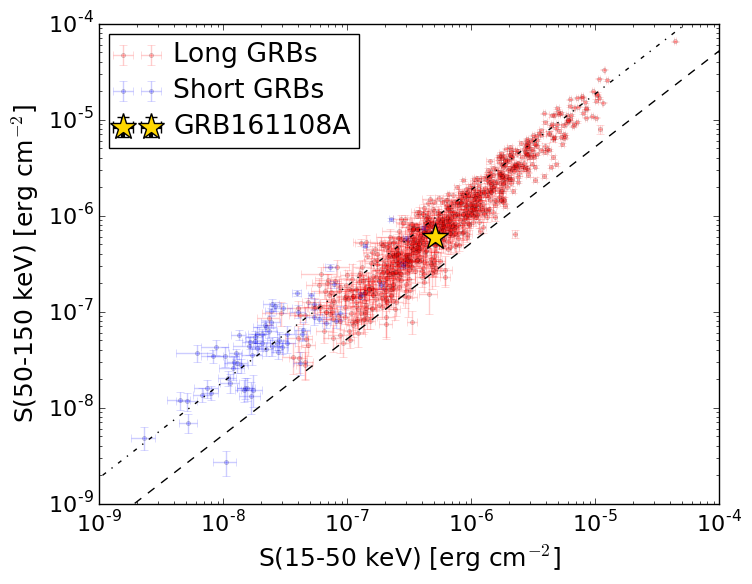
S(15-50 keV)  = 5.067158e-07
S(50-150 keV) = 5.916887e-07
The dash-dotted line and the dashed line traces the fluences calculated from the Band function with Epeak = 15 and 150 keV, respectively. Both lines assume a canonical values of alpha = -1 and beta = -2.5.
Mask shadow pattern
IMX = 1.268561399116442E-01, IMY = -1.784983442442110E-01
Spacecraft aspect plot
Bright source in the pre-burst/pre-slew/post-slew images
Pre-burst image of 15-350 keV band
Time interval of the image:
-239.304000 -1.904000

# RAcent  DECcent POSerr Theta    Phi  PeakCts   SNR AngSep     Name
#  [deg]    [deg]    ['] [deg]  [deg]                   [']
254.4621  35.3399   37.0  52.6 -158.4  -0.1958  -0.3    0.3	Her X-1
180.8209  24.9021    2.5  12.3   54.6   0.7811   4.6 ------	UNKNOWN
158.6011 -22.6547    3.6  58.3   -2.0   3.6556   3.2 ------	UNKNOWN
254.4481  42.2476    2.6  52.2 -167.1   2.4416   4.5 ------	UNKNOWN
238.8435   9.4132    2.4  44.9 -119.9   4.0502   4.8 ------	UNKNOWN
239.7038  10.0833    2.3  45.4 -121.3   4.1658   5.1 ------	UNKNOWN
Pre-slew background subtracted image of 15-350 keV band
Time interval of the image:
-1.904000 35.796600

# RAcent  DECcent POSerr Theta    Phi  PeakCts   SNR AngSep     Name
#  [deg]    [deg]    ['] [deg]  [deg]                   [']
254.4914  35.3484   17.0  52.6 -158.4   0.1444   0.7    1.7	Her X-1
180.7799  24.9048    0.9  12.4   54.6   0.7934  12.7 ------	UNKNOWN
249.9585  51.4296    2.4  50.1 -179.2   0.8707   4.9 ------	UNKNOWN
Post-slew image of 15-350 keV band
Time interval of the image:
68.996600 780.196600

# RAcent  DECcent POSerr Theta    Phi  PeakCts   SNR AngSep     Name
#  [deg]    [deg]    ['] [deg]  [deg]                   [']
186.1948  28.9228    2.6   6.3 -171.6   1.6136   4.5 ------	UNKNOWN
162.7678 -22.9385    3.4  50.9  -18.7   2.9641   3.4 ------	UNKNOWN
210.9585   0.8772    3.9  37.7  -95.4   4.0122   2.9 ------	UNKNOWN
207.6946  -6.7121    2.4  41.0  -83.4   8.6263   4.8 ------	UNKNOWN