Analysis Summary
Notes:
- 1) No attempt has been made to eliminate the non-significant decimal places.
- 2) This batgrbproduct analysis is done using the HEASARC data.
- 3) This batgrbproduct analysis is using the flight position for the mask-weighting calculation.
======================================================================
BAT GRB EVENT DATA PROCESSING REPORT
Process Script Ver: batgrbproduct v2.46
Process Start Time: Sun Dec 4 15:20:02 EST 2016
Host Name: bat1
Current Working Dir: /local/data/bat1/alien/Swift_3rdBATcatalog/event/batevent_reproc/trigger722642
======================================================================
Trigger: 00722642 Segment: 000
BAT Trigger Time: 501069000.896 [s; MET]
Trigger Stop: 501069001.92 [s; MET]
UTC: 2016-11-17T09:49:43.723760 [includes UTCF correction]
Where From?: TDRSS position message
BAT
RA: 298.855450845301 Dec: -67.7066746073387 [deg; J2000]
Catalogged Source?: NO
Point Source?: YES
GRB Indicated?: YES [ by BAT flight software ]
Image S/N Ratio: 10.7
Image Trigger?: NO
Rate S/N Ratio: 22.293496809608 [ if not an image trigger ]
Image S/N Ratio: 10.7
Analysis Position: [ source = BAT ]
RA: 298.855450845301 Dec: -67.7066746073387 [deg; J2000]
Refined Position: [ source = BAT pre-slew burst ]
RA: 298.818708995281 Dec: -67.6726806312609 [deg; J2000]
{ 19h 55m 16.5s , -67d 40' 21.7" }
+/- 1.53888479174843 [arcmin] (estimated 90% radius based on SNR)
+/- 0.595643142058021 [arcmin] (formal 1-sigma fit error)
SNR: 16.4316465024152
Angular difference between the analysis and refined position is 2.204654 arcmin
Partial Coding Fraction: 0.4375 [ including projection effects ]
Duration
T90: 152.311999976635 +/- 3.15355295925813
Measured from: -0.90800005197525
to: 151.40399992466 [s; relative to TRIGTIME]
T50: 34.7319999933243 +/- 0.924173132036283
Measured from: 101.563999950886
to: 136.29599994421 [s; relative to TRIGTIME]
Fluence
Peak Flux (peak 1 second)
Measured from: 134.083999991417
to: 135.083999991417 [s; relative to TRIGTIME]
Total Fluence
Measured from: -6.45600003004074
to: 157.443999946117 [s; relative to TRIGTIME]
Band 1 Band 2 Band 3 Band 4
15-25 25-50 50-100 100-350 keV
Total 4.555942 4.691352 2.290992 0.276877
0.089018 0.092427 0.079369 0.069098 [error]
Peak 0.244415 0.285025 0.106547 0.004258
0.009245 0.009806 0.007085 0.004907 [error]
[ fluence units of on-axis counts / fully illuminated detector ]
======================================================================
====== Table of the duration information =============================
Value tstart tstop
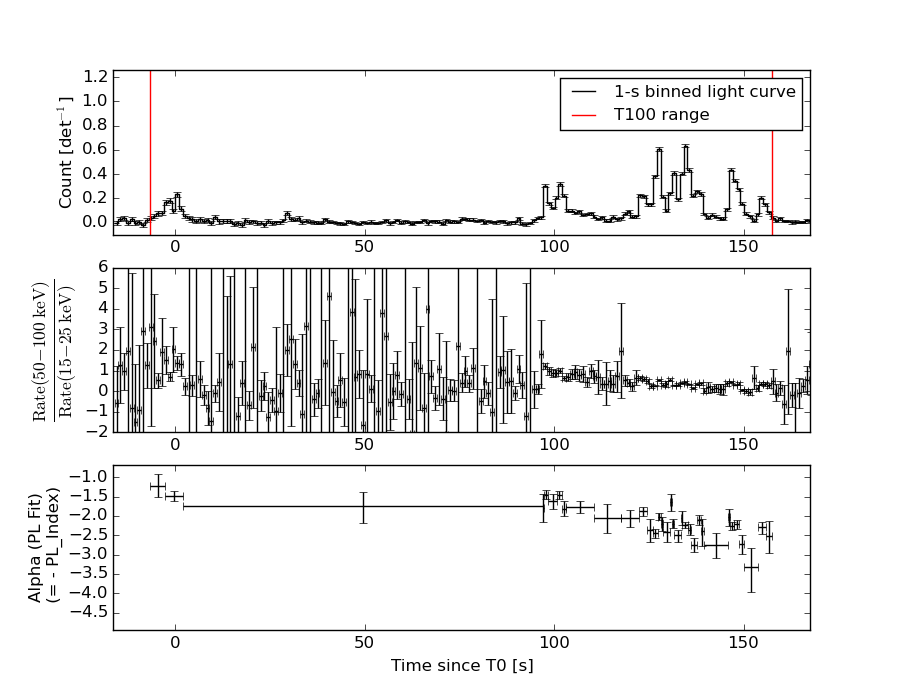
T100 163.900 -6.456 157.444
T90 152.312 -0.908 151.404
T50 34.732 101.564 136.296
Peak 1.000 134.084 135.084
====== Spectral Analysis Summary =====================================
Model : spectral model: simple power-law (PL) and cutoff power-law (CPL)
Ph_index : photon index: E^{Ph_index}
Ph_90err : 90% error of the photon index
Epeak : Epeak in keV
Epeak_90err: 90% error of Epeak
Norm : normalization at 50 keV in both the PL model and CPL model
Nomr_90err : 90% error of the normalization
chi2 : Chi-Squared
dof : degree of freedo
=== Time-averaged spectral analysis ===
(Best model with acceptable fit: CPL)
Model Ph_index Ph_90err_low Ph_90err_hi Epeak Epeak_90err_low Epeak_90err_hi Norm Nomr_90err_low Norm_90err_hi chi2 dof
PL -2.109 -0.060 0.059 - - - 3.97e-03 -1.29e-04 1.29e-04 62.310 57
CPL -1.390 -0.269 0.286 38.852 -6.199 4.449 9.45e-03 -2.57e-03 3.85e-03 39.170 56
=== 1-s peak spectral analysis ===
(Best model with acceptable fit: N/A)
Model Ph_index Ph_90err_low Ph_90err_hi Epeak Epeak_90err_low Epeak_90err_hi Norm Nomr_90err_low Norm_90err_hi chi2 dof
PL -2.193 -0.084 0.082 - - - 3.33e-02 -1.86e-03 1.84e-03 73.800 57
CPL -0.767 -0.456 0.515 35.896 -3.922 3.230 2.18e-01 -9.84e-02 2.15e-01 37.660 56
=== Fluence/Peak Flux Summary ===
Model Band1 Band2 Band3 Band4 Band5 Total
15-25 25-50 50-100 100-350 15-150 15-350 keV
Fluence PL 1.48e-06 1.88e-06 1.74e-06 2.83e-06 6.05e-06 7.92e-06 erg/cm2
90%_error_low -7.34e-08 -5.48e-08 -7.93e-08 -2.65e-07 -1.82e-07 -3.34e-07 erg/cm2
90%_error_hi 7.47e-08 5.48e-08 7.96e-08 2.84e-07 1.83e-07 3.46e-07 erg/cm2
Peak flux PL 2.68e+00 1.80e+00 7.85e-01 4.74e-01 5.50e+00 5.73e+00 ph/cm2/s
90%_error_low -1.82e-01 -8.33e-02 -5.66e-02 -6.17e-02 -2.64e-01 -2.68e-01 ph/cm2/s
90%_error_hi 1.85e-01 8.33e-02 5.69e-02 6.71e-02 2.65e-01 2.68e-01 ph/cm2/s
Fluence CPL 1.31e-06 1.98e-06 1.72e-06 1.05e-06 5.64e-06 6.06e-06 erg/cm2
90%_error_low -9.23e-08 -6.58e-08 -8.84e-08 -2.88e-07 -2.27e-07 -3.80e-07 erg/cm2
90%_error_hi 9.38e-08 6.64e-08 8.77e-08 4.12e-07 2.29e-07 4.82e-07 erg/cm2
Peak flux CPL N/A N/A N/A N/A N/A N/A ph/cm2/s
90%_error_low -1.82e-01 -8.33e-02 -5.66e-02 -6.17e-02 -2.64e-01 -2.68e-01 ph/cm2/s
90%_error_hi 1.85e-01 8.33e-02 5.69e-02 6.71e-02 2.65e-01 2.68e-01 ph/cm2/s
======================================================================
Image
Pre-slew 15.0-350.0 keV image (Event data)
#   RAcent    DECcent   POSerr    Theta     Phi              Peak Cts       SNR   Name
  298.8187   -67.6727   0.0118    29.8262   -70.0056         1.3976071     16.432 TRIG_00722642

Foreground time interval of the image:
 -6.456  13.005 (delta_t =  19.461 [sec])
Background time interval of the image:
-460.795 -442.400 (delta_t =  18.395 [sec])
-239.896  -6.456 (delta_t = 233.440 [sec])
Light Curves
Note: The mask-weighted lightcurves have units of either count/det or counts/sec/det, where a det is 0.4 x 0.4 = 0.16 sq cm.
Full-time range; 1 s binning
Other quick-look light curves:
- 64 ms binning (zoomed)
- 16 ms binning (zoomed)
- 8 ms binning (zoomed)
- 2 ms binning (zoomed)
- SN=5 or 10 s binning (full-time range)
- Raw light curve
Spectra
- 64 ms binning (zoomed)
- 16 ms binning (zoomed)
- 8 ms binning (zoomed)
- 2 ms binning (zoomed)
- SN=5 or 10 s binning (full-time range)
- Raw light curve
Spectra
Notes:
- 1) The fitting includes the systematic errors.
- 2) When the burst includes telescope slew time periods, the fitting uses an average response file made from multiple 5-s response files through out the slew time plus single time preiod for the non-slew times, and weighted by the total counts in the corresponding time period using addrmf. An average response file is needed becuase a spectral fit using the pre-slew DRM will introduce some errors in both a spectral shape and a normalization if the PHA file contains a lot of the slew/post-slew time interval.
- 3) For fits to more complicated models (e.g. a power-law over a cutoff power-law), the BAT team has decided to require a chi-square improvement of more than 6 for each extra dof.
Time averaged spectrum fit using the average DRM
Power-law model
Time interval is from   -6.456 sec. to  157.444 sec.

Spectral model in power-law:
------------------------------------------------------------
Parameters  : value       lower 90%   higher 90%
Photon index: -2.10947     ( -0.0596138   0.0589789 )
Norm@50keV  : 3.96963E-03    ( -0.000129343   0.000128736 )
------------------------------------------------------------
#Fit statistic : Chi-Squared =          62.31 using 59 PHA bins.
# Reduced chi-squared =          1.093 for     57 degrees of freedom
# Null hypothesis probability =   2.930626e-01

Photon flux (15-150 keV)    in 163.9 sec: 0.627516 ( -0.020034  0.020123 ) ph/cm2/s
Energy fluence (15-150 keV)             : 6.05173e-06 ( -1.82122e-07  1.82732e-07 ) ergs/cm2
Cutoff power-law model
Time interval is from   -6.456 sec. to  157.444 sec.
Spectral model in the cutoff power-law:
------------------------------------------------------------
Parameters  : value       lower 90%   higher 90%
Photon index: -1.38966     ( -0.268537   0.286184 )
Epeak [keV] : 38.8517      ( -6.19895 4.44912 )
Norm@50keV  : 9.45456E-03    ( -0.00257337   0.00384693 )
------------------------------------------------------------
#Fit statistic : Chi-Squared =          39.17 using 59 PHA bins.
# Reduced chi-squared =         0.6994 for     56 degrees of freedom
# Null hypothesis probability =   9.573356e-01

Photon flux (15-150 keV)    in 163.9 sec: 0.591572 ( -0.023332  0.023476 ) ph/cm2/s
Energy fluence (15-150 keV)             : 5.6387e-06 ( -2.27061e-07  2.29419e-07 ) ergs/cm2
1-s peak spectrum fit
Power-law model
Time interval is from  134.084 sec. to  135.084 sec.

Spectral model in power-law:
------------------------------------------------------------
Parameters  : value       lower 90%   higher 90%
Photon index: -2.19317     ( -0.0841548   0.0823036 )
Norm@50keV  : 3.33090E-02    ( -0.001857   0.00184312 )
------------------------------------------------------------
#Fit statistic : Chi-Squared =          73.80 using 59 PHA bins.
# Reduced chi-squared =          1.295 for     57 degrees of freedom
# Null hypothesis probability =   6.653657e-02

Photon flux (15-150 keV)    in 1 sec: 5.49525 ( -0.26422  0.2646 ) ph/cm2/s
Energy fluence (15-150 keV)             : 3.12939e-07 ( -1.56492e-08  1.57158e-08 ) ergs/cm2
Cutoff power-law model
Time interval is from  134.084 sec. to  135.084 sec.
Spectral model in the cutoff power-law:
------------------------------------------------------------
Parameters  : value       lower 90%   higher 90%
Photon index: -0.766801     ( -0.455642   0.514564 )
Epeak [keV] : 35.8961      ( -3.92181 3.22934 )
Norm@50keV  : 0.218418    ( -0.0983894   0.215037 )
------------------------------------------------------------
#Fit statistic : Chi-Squared =          37.66 using 59 PHA bins.
# Reduced chi-squared =         0.6724 for     56 degrees of freedom
# Null hypothesis probability =   9.715954e-01

Photon flux (15-150 keV)    in 1 sec:  (    ) ph/cm2/s
Energy fluence (15-150 keV)             : 0 ( 0  0 ) ergs/cm2
Time-resolved spectra
Distribution
T90 vs. Hardness ratio plot
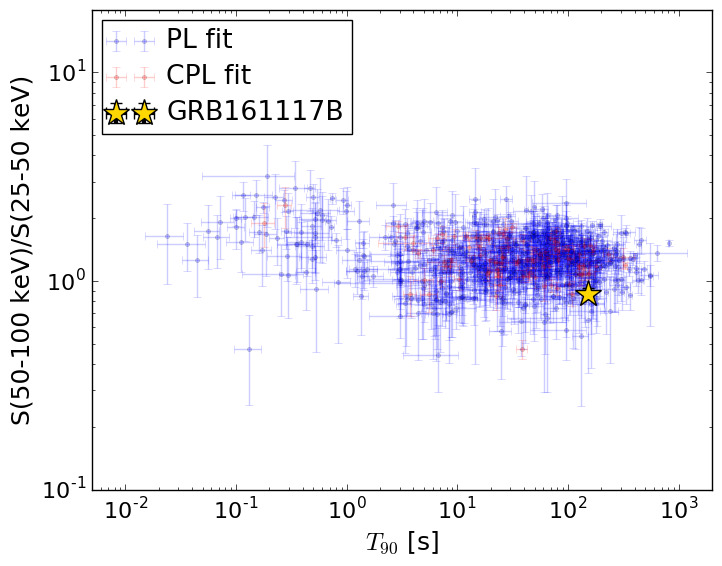
T90                                   = 152.312 sec.
Hardness ratio (energy fluence ratio) = 0.870923287302
S(15-50 keV) vs. S(50-150 keV) plot
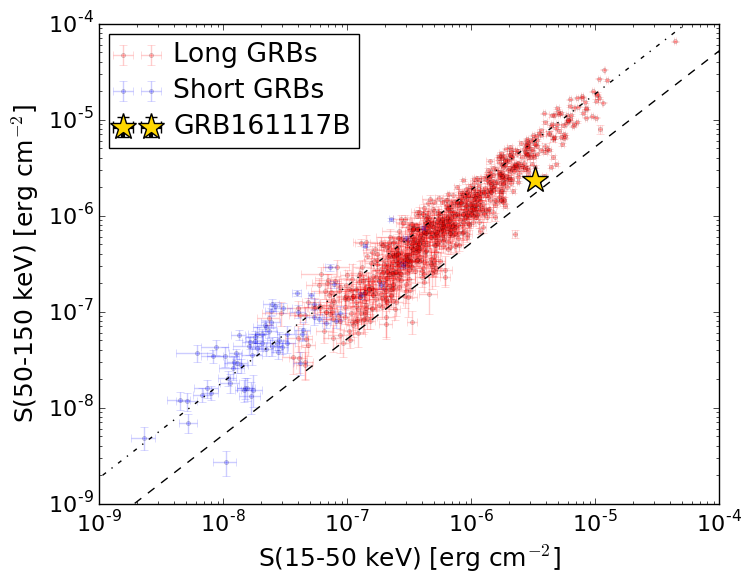
S(15-50 keV)  = 3.283861e-06
S(50-150 keV) = 2.3549018e-06
The dash-dotted line and the dashed line traces the fluences calculated from the Band function with Epeak = 15 and 150 keV, respectively. Both lines assume a canonical values of alpha = -1 and beta = -2.5.
Mask shadow pattern
IMX = 1.960316106348038E-01, IMY = 5.387574895141908E-01
Spacecraft aspect plot
Bright source in the pre-burst/pre-slew/post-slew images
Pre-burst image of 15-350 keV band
Time interval of the image:
-460.795400 -442.400200
-239.896000 -6.456000

# RAcent  DECcent POSerr Theta    Phi  PeakCts   SNR AngSep     Name
#  [deg]    [deg]    ['] [deg]  [deg]                   [']
 19.4876 -22.8531    3.1  41.4   65.4   3.1002   3.8 ------	UNKNOWN
342.1504 -27.7781    3.1  42.6   13.7   1.3283   3.7 ------	UNKNOWN
343.7355 -30.1288    2.8  39.9   14.3   1.3393   4.2 ------	UNKNOWN
111.7112 -50.7592    2.8  47.6 -176.9   1.7296   4.1 ------	UNKNOWN
301.3947 -30.1016    2.8  56.9  -29.8   5.8881   4.1 ------	UNKNOWN
Pre-slew background subtracted image of 15-350 keV band
Time interval of the image:
-6.456000 13.004600

# RAcent  DECcent POSerr Theta    Phi  PeakCts   SNR AngSep     Name
#  [deg]    [deg]    ['] [deg]  [deg]                   [']
135.6676 -53.6606    2.5  53.1 -158.8   0.8675   4.6 ------	UNKNOWN
298.8191 -67.6725    0.7  29.8  -70.0   1.3963  16.4 ------	UNKNOWN
Post-slew image of 15-350 keV band
Time interval of the image:
63.604620 962.134000

# RAcent  DECcent POSerr Theta    Phi  PeakCts   SNR AngSep     Name
#  [deg]    [deg]    ['] [deg]  [deg]                   [']
170.0214 -60.5466   18.2  46.5 -163.2  -0.8441  -0.6    9.8	Cen X-3
186.5953 -62.7527    2.9  40.8 -154.7   4.1077   4.0    2.0	GX 301-2
255.9907 -38.0253    0.0  37.9  -75.8   3.6928   2.1   10.9	4U 1700-377
256.6201 -36.4973   12.1  39.1  -74.1   1.7141   1.0   10.0	GX 349+2
264.6216 -44.3284   11.3  29.5  -70.1  -1.0420  -1.0    9.0	4U 1735-44
270.3866 -24.9879    6.6  46.1  -51.9   5.1715   1.7    7.8	GX 5-1
270.0826 -25.7435    7.5  45.5  -52.6  -4.2345  -1.5   11.9	GRS 1758-258
275.9579 -30.5285   21.1  39.6  -46.9   0.6026   0.6    9.8	H1820-303
284.8944 -25.0246    5.9  43.5  -33.6  -2.1238  -1.9    9.9	HT1900.1-2455
263.2192 -33.8289   17.7  39.6  -64.6  -1.3004  -0.6   11.5	GX 354-0
318.3007 -19.2614    3.5  50.0    9.1   4.8442   3.3 ------	UNKNOWN
298.8622 -67.6877    0.7   0.0  -65.9   9.9861  17.5 ------	UNKNOWN
153.8534 -72.4206    2.4  38.0 -178.7   3.9907   4.8 ------	UNKNOWN
201.5728 -60.3260    3.0  38.8 -143.4   3.7152   3.8 ------	UNKNOWN
286.3713 -11.5497    4.8  56.8  -29.8  11.7215   2.4 ------	UNKNOWN