Analysis Summary
Notes:
- 1) No attempt has been made to eliminate the non-significant decimal places.
- 2) This batgrbproduct analysis is done using the HEASARC data.
- 3) This batgrbproduct analysis is using the flight position for the mask-weighting calculation.
======================================================================
BAT GRB EVENT DATA PROCESSING REPORT
Process Script Ver: batgrbproduct v2.46
Process Start Time: Mon Dec 19 15:54:49 EST 2016
Host Name: bat1
Current Working Dir: /local/data/bat1/alien/Swift_3rdBATcatalog/event/batevent_reproc/trigger724438
======================================================================
Trigger: 00724438 Segment: 000
BAT Trigger Time: 502096317.088 [s; MET]
Trigger Stop: 502096317.472 [s; MET]
UTC: 2016-11-29T07:11:39.857180 [includes UTCF correction]
Where From?: (*SHORT BURST*) Expanded to TRIGTIME - 32 ms to TRIGTIME + 320 ms
BAT
RA: 316.192888589222 Dec: 32.125124540387 [deg; J2000]
Catalogged Source?: NO
Point Source?: YES
GRB Indicated?: YES [ by BAT flight software ]
Image S/N Ratio: 8.73
Image Trigger?: NO
Rate S/N Ratio: 32.4499614791759 [ if not an image trigger ]
Image S/N Ratio: 8.73
Analysis Position: [ source = BAT ]
RA: 316.192888589222 Dec: 32.125124540387 [deg; J2000]
Refined Position: [ source = BAT pre-slew burst ]
RA: 316.217133730944 Dec: 32.1360926393416 [deg; J2000]
{ 21h 04m 52.1s , +32d 08' 09.9" }
+/- 1.61910540410255 [arcmin] (estimated 90% radius based on SNR)
+/- 0.687520647422061 [arcmin] (formal 1-sigma fit error)
SNR: 15.2810754309283
Angular difference between the analysis and refined position is 1.396660 arcmin
Partial Coding Fraction: 0.6953125 [ including projection effects ]
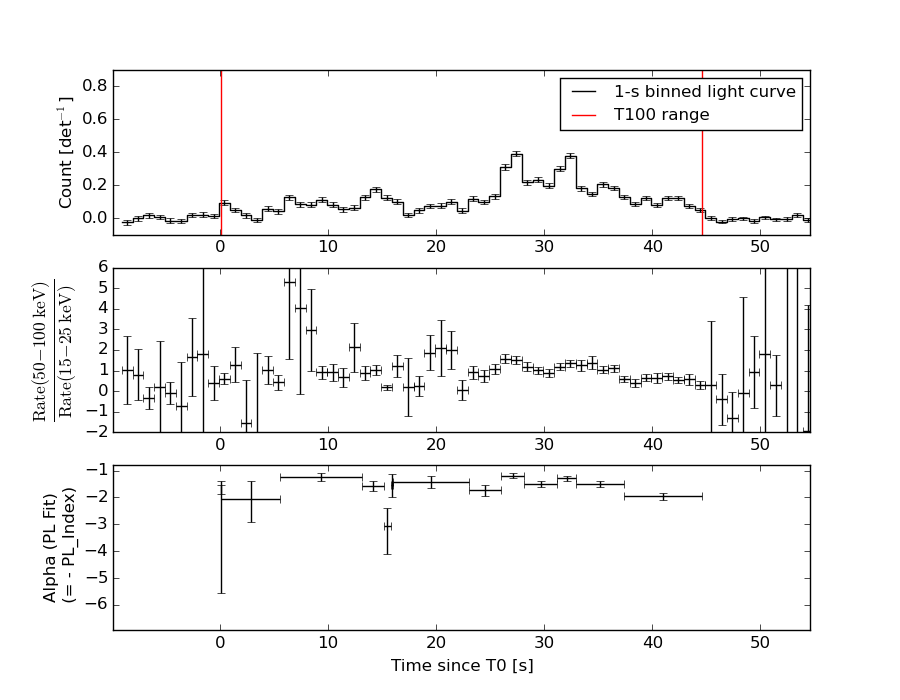
Duration
T90: 35.5439999699593 +/- 2.09513345944611
Measured from: 6.18000000715256
to: 41.7239999771118 [s; relative to TRIGTIME]
T50: 15.3319999575615 +/- 2.17121626453183
Measured from: 18.0759999752045
to: 33.407999932766 [s; relative to TRIGTIME]
Fluence
Peak Flux (peak 1 second)
Measured from: 26.6439999938011
to: 27.6439999938011 [s; relative to TRIGTIME]
Total Fluence
Measured from: 0.0559999942779541
to: 44.5839999914169 [s; relative to TRIGTIME]
Band 1 Band 2 Band 3 Band 4
15-25 25-50 50-100 100-350 keV
Total 1.526902 2.154708 1.605890 0.361065
0.049632 0.053190 0.046857 0.038761 [error]
Peak 0.084154 0.142551 0.142085 0.033188
0.008496 0.009651 0.008972 0.006951 [error]
[ fluence units of on-axis counts / fully illuminated detector ]
======================================================================
====== Table of the duration information =============================
Value tstart tstop
T100 44.528 0.056 44.584
T90 35.544 6.180 41.724
T50 15.332 18.076 33.408
Peak 1.000 26.644 27.644
====== Spectral Analysis Summary =====================================
Model : spectral model: simple power-law (PL) and cutoff power-law (CPL)
Ph_index : photon index: E^{Ph_index}
Ph_90err : 90% error of the photon index
Epeak : Epeak in keV
Epeak_90err: 90% error of Epeak
Norm : normalization at 50 keV in both the PL model and CPL model
Nomr_90err : 90% error of the normalization
chi2 : Chi-Squared
dof : degree of freedo
=== Time-averaged spectral analysis ===
(Best model with acceptable fit: PL)
Model Ph_index Ph_90err_low Ph_90err_hi Epeak Epeak_90err_low Epeak_90err_hi Norm Nomr_90err_low Norm_90err_hi chi2 dof
PL -1.534 -0.057 0.057 - - - 8.54e-03 -2.59e-04 2.59e-04 55.270 57
CPL -1.405 -0.161 0.224 243.360 -121.080 -243.360 9.84e-03 -1.48e-03 2.66e-03 54.210 56
=== 1-s peak spectral analysis ===
(Best model with acceptable fit: PL)
Model Ph_index Ph_90err_low Ph_90err_hi Epeak Epeak_90err_low Epeak_90err_hi Norm Nomr_90err_low Norm_90err_hi chi2 dof
PL -1.161 -0.115 0.117 - - - 2.83e-02 -1.91e-03 1.91e-03 44.590 57
CPL -0.849 -0.363 0.484 206.175 -92.694 -206.175 3.94e-02 -1.23e-02 2.51e-02 43.110 56
=== Fluence/Peak Flux Summary ===
Model Band1 Band2 Band3 Band4 Band5 Total
15-25 25-50 50-100 100-350 15-150 15-350 keV
Fluence PL 5.01e-07 9.02e-07 1.25e-06 3.58e-06 3.59e-06 6.23e-06 erg/cm2
90%_error_low -2.92e-08 -3.08e-08 -4.77e-08 -3.01e-07 -1.15e-07 -3.30e-07 erg/cm2
90%_error_hi 2.98e-08 3.07e-08 4.76e-08 3.19e-07 1.16e-07 3.45e-07 erg/cm2
Peak flux PL 8.43e-01 1.04e+00 9.28e-01 1.44e+00 3.31e+00 4.25e+00 ph/cm2/s
90%_error_low -1.10e-01 -8.49e-02 -7.05e-02 -2.19e-01 -2.31e-01 -3.00e-01 ph/cm2/s
90%_error_hi 1.15e-01 8.41e-02 7.00e-02 2.43e-01 2.32e-01 3.03e-01 ph/cm2/s
Fluence CPL 4.88e-07 9.11e-07 1.26e-06 2.96e-06 3.55e-06 5.62e-06 erg/cm2
90%_error_low -3.65e-08 -3.39e-08 -5.17e-08 -7.73e-07 -1.28e-07 -7.77e-07 erg/cm2
90%_error_hi 3.70e-08 3.42e-08 5.22e-08 5.68e-07 1.28e-07 7.37e-07 erg/cm2
Peak flux CPL 7.82e-01 1.06e+00 9.64e-01 1.05e+00 3.27e+00 3.85e+00 ph/cm2/s
90%_error_low -1.36e-01 -9.17e-02 -8.56e-02 -3.64e-01 -2.38e-01 -4.43e-01 ph/cm2/s
90%_error_hi 1.41e-01 9.31e-02 8.71e-02 4.73e-01 2.38e-01 5.57e-01 ph/cm2/s
======================================================================
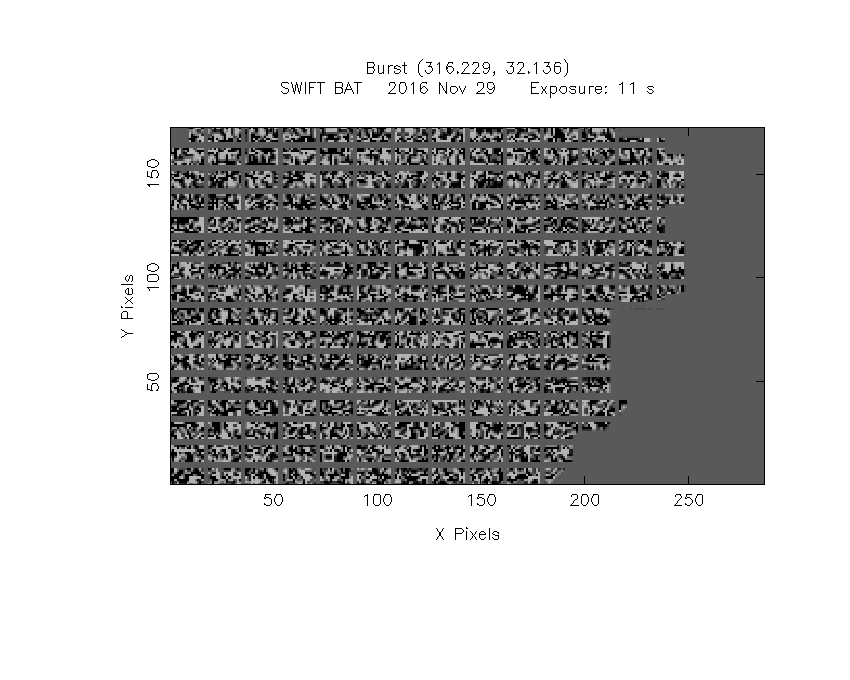
Image
Pre-slew 15.0-350.0 keV image (Event data)
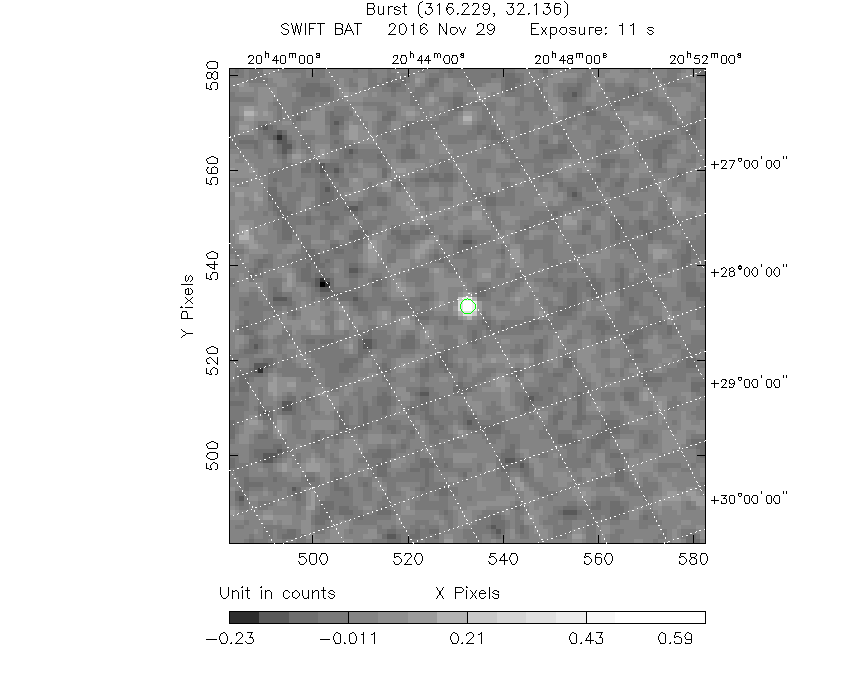
#   RAcent    DECcent   POSerr    Theta     Phi              Peak Cts       SNR   Name
  316.2171    32.1361   0.0126    36.4364    -8.9684         0.7673930     15.281 TRIG_00724438

Foreground time interval of the image:
  0.056  10.613 (delta_t =  10.557 [sec])
Background time interval of the image:
-239.088   0.056 (delta_t = 239.144 [sec])
Light Curves
Note: The mask-weighted lightcurves have units of either count/det or counts/sec/det, where a det is 0.4 x 0.4 = 0.16 sq cm.
Full-time range; 1 s binning
Other quick-look light curves:
- 64 ms binning (zoomed)
- 16 ms binning (zoomed)
- 8 ms binning (zoomed)
- 2 ms binning (zoomed)
- SN=5 or 10 s binning (full-time range)
- Raw light curve
Spectra
- 64 ms binning (zoomed)
- 16 ms binning (zoomed)
- 8 ms binning (zoomed)
- 2 ms binning (zoomed)
- SN=5 or 10 s binning (full-time range)
- Raw light curve
Spectra
Notes:
- 1) The fitting includes the systematic errors.
- 2) When the burst includes telescope slew time periods, the fitting uses an average response file made from multiple 5-s response files through out the slew time plus single time preiod for the non-slew times, and weighted by the total counts in the corresponding time period using addrmf. An average response file is needed becuase a spectral fit using the pre-slew DRM will introduce some errors in both a spectral shape and a normalization if the PHA file contains a lot of the slew/post-slew time interval.
- 3) For fits to more complicated models (e.g. a power-law over a cutoff power-law), the BAT team has decided to require a chi-square improvement of more than 6 for each extra dof.
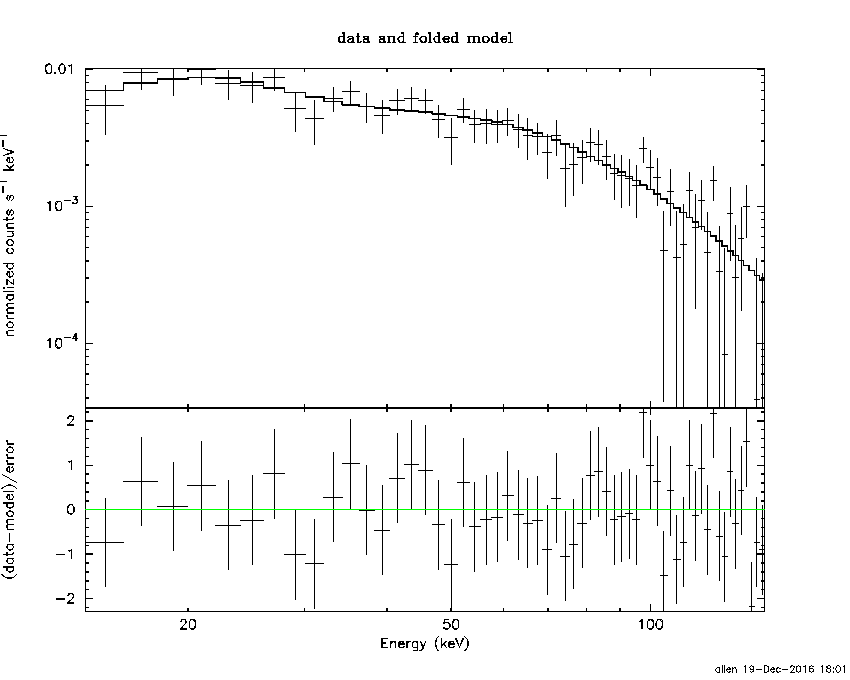
Time averaged spectrum fit using the average DRM
Power-law model
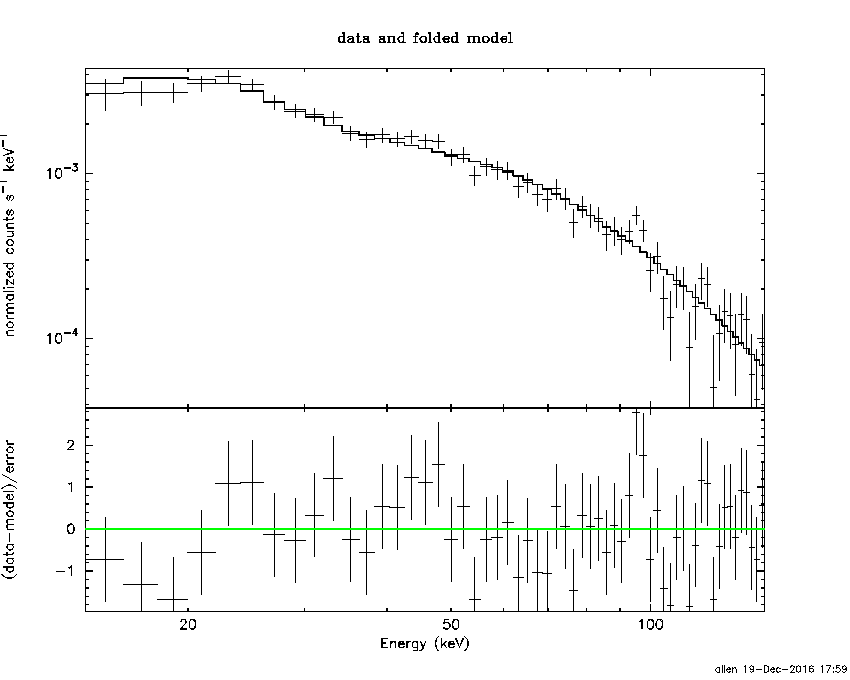
Time interval is from    0.056 sec. to   44.584 sec.

Spectral model in power-law:
------------------------------------------------------------
Parameters  : value       lower 90%   higher 90%
Photon index: -1.53443     ( -0.056878   0.05682 )
Norm@50keV  : 8.53900E-03    ( -0.000258865   0.000258748 )
------------------------------------------------------------
#Fit statistic : Chi-Squared =          55.27 using 59 PHA bins.
# Reduced chi-squared =         0.9696 for     57 degrees of freedom
# Null hypothesis probability =   5.403860e-01

Photon flux (15-150 keV)    in 44.53 sec: 1.07621 ( -0.03547  0.03557 ) ph/cm2/s
Energy fluence (15-150 keV)             : 3.58825e-06 ( -1.15426e-07  1.15595e-07 ) ergs/cm2
Cutoff power-law model
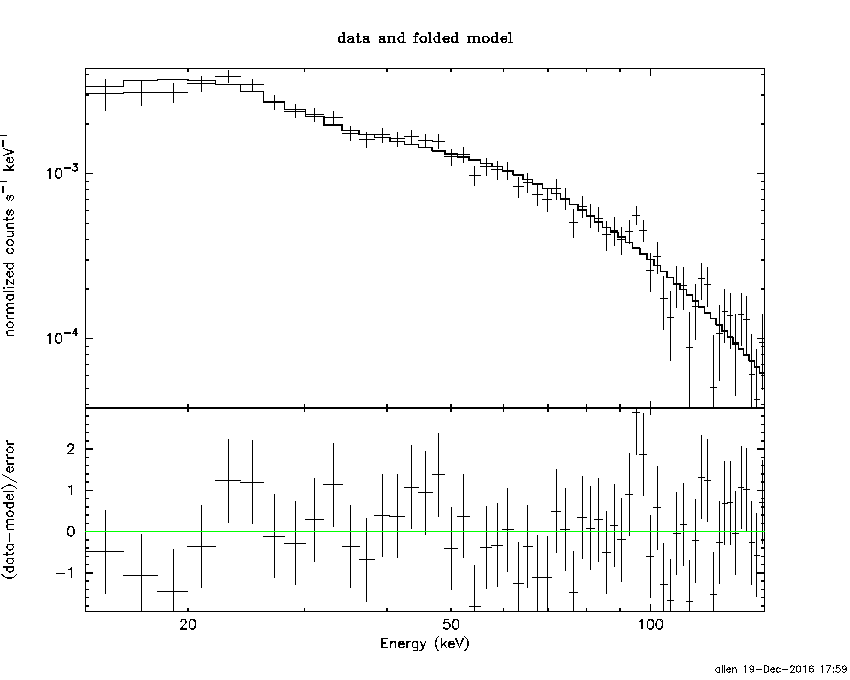
Time interval is from    0.056 sec. to   44.584 sec.
Spectral model in the cutoff power-law:
------------------------------------------------------------
Parameters  : value       lower 90%   higher 90%
Photon index: -1.40468     ( -0.160947   0.224453 )
Epeak [keV] : 243.360      ( -121.14 -243.42 )
Norm@50keV  : 9.84200E-03    ( -0.00148132   0.00265728 )
------------------------------------------------------------
#Fit statistic : Chi-Squared =          54.21 using 59 PHA bins.
# Reduced chi-squared =         0.9680 for     56 degrees of freedom
# Null hypothesis probability =   5.429228e-01

Photon flux (15-150 keV)    in 44.53 sec: 1.06678 ( -0.03853  0.03863 ) ph/cm2/s
Energy fluence (15-150 keV)             : 3.55437e-06 ( -1.28487e-07  1.27959e-07 ) ergs/cm2
1-s peak spectrum fit
Power-law model
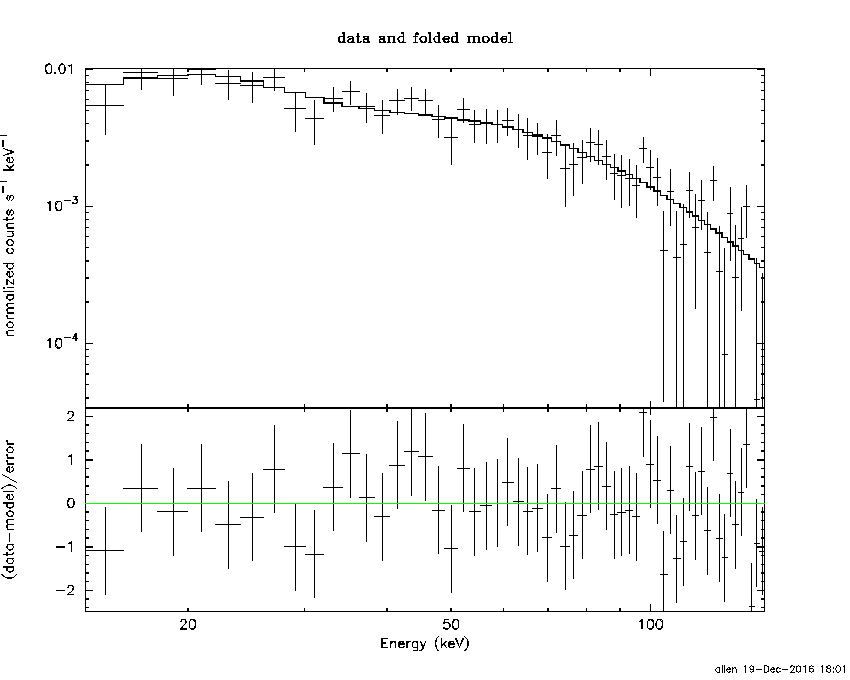
Time interval is from   26.644 sec. to   27.644 sec.

Spectral model in power-law:
------------------------------------------------------------
Parameters  : value       lower 90%   higher 90%
Photon index: -1.16123     ( -0.115501   0.116792 )
Norm@50keV  : 2.83130E-02    ( -0.00191169   0.00191051 )
------------------------------------------------------------
#Fit statistic : Chi-Squared =          44.59 using 59 PHA bins.
# Reduced chi-squared =         0.7822 for     57 degrees of freedom
# Null hypothesis probability =   8.841401e-01

Photon flux (15-150 keV)    in 1 sec: 3.30640 ( -0.23125  0.23159 ) ph/cm2/s
Energy fluence (15-150 keV)             : 2.90516e-07 ( -2.12943e-08  2.13945e-08 ) ergs/cm2
Cutoff power-law model
Time interval is from   26.644 sec. to   27.644 sec.
Spectral model in the cutoff power-law:
------------------------------------------------------------
Parameters  : value       lower 90%   higher 90%
Photon index: -0.848806     ( -0.363346   0.483693 )
Epeak [keV] : 206.175      ( -92.6935 -206.175 )
Norm@50keV  : 3.94338E-02    ( -0.0122728   0.0251298 )
------------------------------------------------------------
#Fit statistic : Chi-Squared =          43.11 using 59 PHA bins.
# Reduced chi-squared =         0.7698 for     56 degrees of freedom
# Null hypothesis probability =   8.965691e-01

Photon flux (15-150 keV)    in 1 sec: 3.26719 ( -0.23791  0.23791 ) ph/cm2/s
Energy fluence (15-150 keV)             : 2.86358e-07 ( -2.23847e-08  2.22875e-08 ) ergs/cm2
Time-resolved spectra
Distribution
T90 vs. Hardness ratio plot
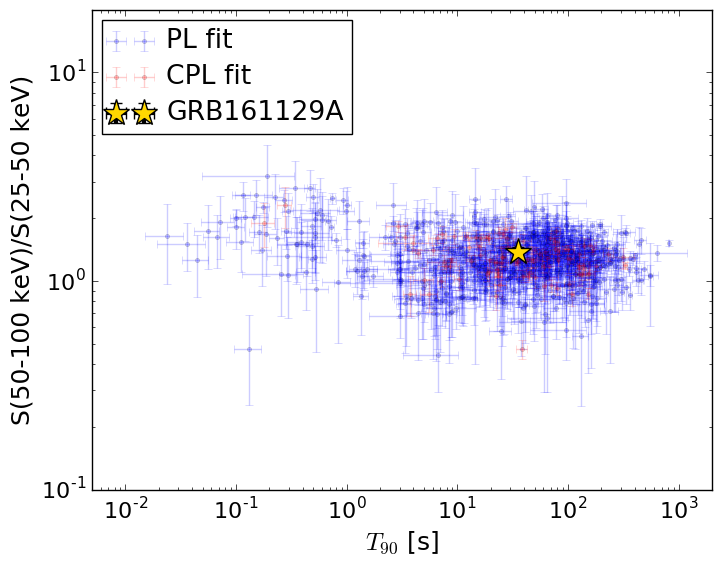
T90                                   = 35.544 sec.
Hardness ratio (energy fluence ratio) = 1.38086085862
S(15-50 keV) vs. S(50-150 keV) plot
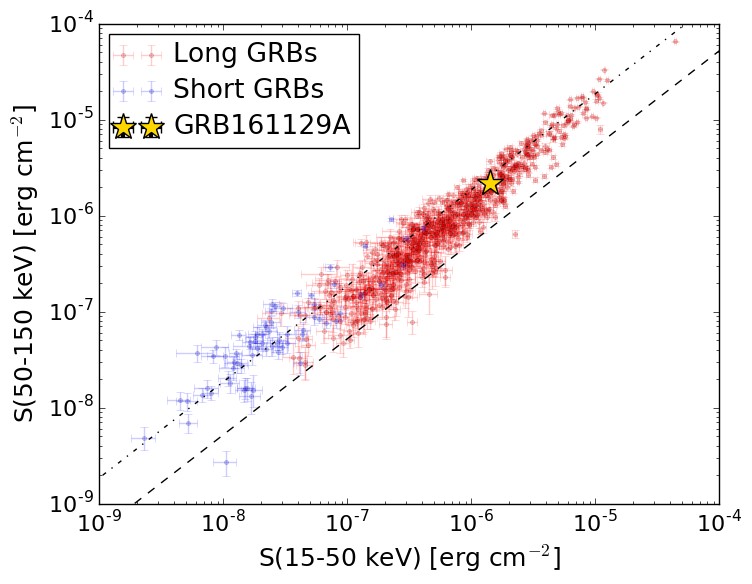
S(15-50 keV)  = 1.4037828e-06
S(50-150 keV) = 2.1844743e-06
The dash-dotted line and the dashed line traces the fluences calculated from the Band function with Epeak = 15 and 150 keV, respectively. Both lines assume a canonical values of alpha = -1 and beta = -2.5.
Mask shadow pattern
IMX = 7.292190432617182E-01, IMY = 1.150843779654006E-01
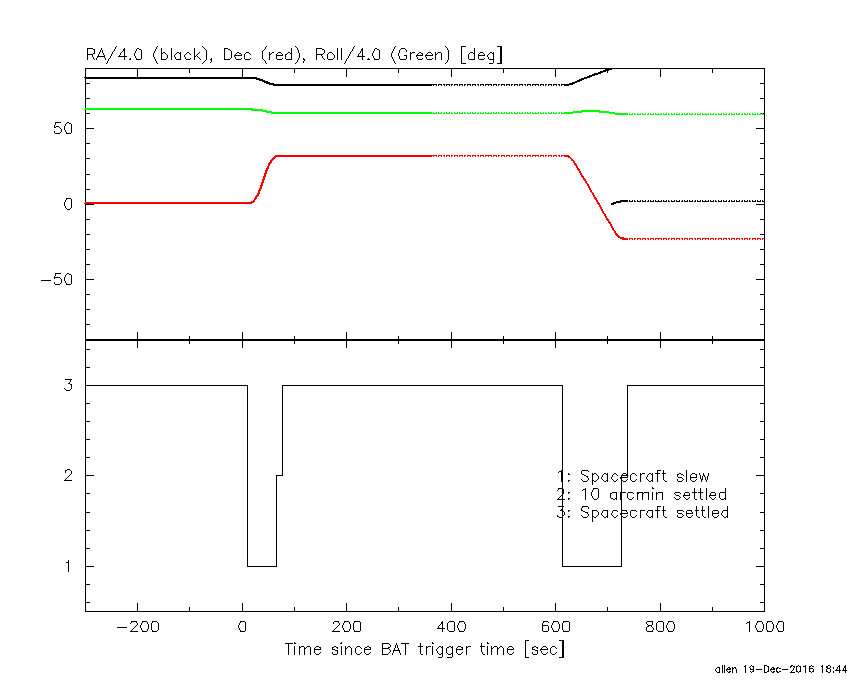
Spacecraft aspect plot
Bright source in the pre-burst/pre-slew/post-slew images
Pre-burst image of 15-350 keV band
Time interval of the image:
-239.088000 0.056000

# RAcent  DECcent POSerr Theta    Phi  PeakCts   SNR AngSep     Name
#  [deg]    [deg]    ['] [deg]  [deg]                   [']
299.5543  35.1804    0.6  48.1  -21.0  10.3153  20.7    2.2	Cyg X-1
308.2193  41.0195    3.6  47.4   -8.9   1.3698   3.2    6.4	Cyg X-3
326.0467  38.2532    6.1  38.7    7.2   0.6135   1.9    7.2	Cyg X-2
349.6546 -55.7102    3.3  57.4 -170.4   4.5888   3.5 ------	UNKNOWN
290.9834  38.7647    2.4  55.8  -22.3   3.9381   4.8 ------	UNKNOWN
325.0052 -56.0725    3.5  57.2 -154.1   5.2849   3.3 ------	UNKNOWN
303.5238 -33.1793    2.2  45.2 -122.3   4.5799   5.2 ------	UNKNOWN
Pre-slew background subtracted image of 15-350 keV band
Time interval of the image:
0.056000 10.612610

# RAcent  DECcent POSerr Theta    Phi  PeakCts   SNR AngSep     Name
#  [deg]    [deg]    ['] [deg]  [deg]                   [']
299.4969  35.1026    5.7  48.1  -21.1  -0.1725  -2.0    7.5	Cyg X-1
308.1312  40.9908   13.3  47.4   -9.0  -0.0643  -0.9    2.5	Cyg X-3
326.2177  38.4200    3.3  38.8    7.5   0.1955   3.5    6.3	Cyg X-2
  8.2549 -10.9252    2.2  34.6  129.4   0.3423   5.2 ------	UNKNOWN
335.3925  21.1559    2.3  20.6   18.9   0.1933   4.9 ------	UNKNOWN
316.2171  32.1361    0.8  36.4   -9.0   0.7674  15.3 ------	UNKNOWN
286.9449  22.2271    2.7  51.9  -42.7   0.8360   4.3 ------	UNKNOWN
Post-slew image of 15-350 keV band
Time interval of the image:
66.212590 613.912600

# RAcent  DECcent POSerr Theta    Phi  PeakCts   SNR AngSep     Name
#  [deg]    [deg]    ['] [deg]  [deg]                   [']
254.3531  35.5595    0.0  50.6  -39.5   4.5079   2.0   14.0	Her X-1
288.7553  10.9470    1.9  33.0  -95.1   5.3374   5.9    2.5	GRS 1915+105
299.5917  35.2015    0.2  14.1  -44.3  23.9460  52.6    0.1	Cyg X-1
308.1281  40.9690    1.6  11.0   -5.3   3.2062   7.1    1.3	Cyg X-3
326.2016  38.4915    4.0  10.3   77.9   1.3332   2.9   10.3	Cyg X-2
  5.0864  33.9858    4.0  40.6  102.3   5.5539   2.9 ------	UNKNOWN
358.9593  14.2561    2.6  42.8  133.1   6.7323   4.5 ------	UNKNOWN