Analysis Summary
Notes:
- 1) No attempt has been made to eliminate the non-significant decimal places.
- 2) This batgrbproduct analysis is done using the HEASARC data.
- 3) This batgrbproduct analysis is using the flight position for the mask-weighting calculation.
======================================================================
                  BAT GRB EVENT DATA PROCESSING REPORT
    Process Script Ver: batgrbproduct v2.46
    Process Start Time: Wed Jan  4 17:42:37 EST 2017
             Host Name: bat1
   Current Working Dir: /local/data/bat1/alien/Swift_3rdBATcatalog/event/batevent_reproc/trigger726885
======================================================================

  Trigger: 00726885      Segment: 000

  BAT Trigger Time: 503428827.968   [s; MET]
      Trigger Stop: 503428828.992   [s; MET]
               UTC: 2016-12-14T17:20:10.661200    [includes UTCF correction]
       Where From?: TDRSS position message

  BAT
    RA: 3.8505559310649   Dec: 7.34197640243199  [deg; J2000]

     Catalogged Source?: NO
     Point Source?:      YES
     GRB Indicated?:     YES    [ by BAT flight software ]
     Image S/N Ratio:    11.45
     Image Trigger?:     NO
     Rate S/N Ratio:     19.4164878389476  [ if not an image trigger ]
     Image S/N Ratio:    11.45

  Analysis Position:   [ source = BAT ]
    RA: 3.8505559310649   Dec: 7.34197640243199  [deg; J2000]

  Refined Position:   [ source = BAT pre-slew burst ]
    RA: 3.85805633694063   Dec: 7.34763785809375  [deg; J2000]
        { 00h 15m 25.9s , +07d 20' 51.5" }
         +/- 0.899596043202637 [arcmin] (estimated 90% radius based on SNR)
         +/- 0.301516216718472 [arcmin] (formal 1-sigma fit error)
    SNR: 35.3805643773046

  Angular difference between the analysis and refined position is 0.560892 arcmin

  Partial Coding Fraction: 0.6484375    [ including projection effects ]

  Duration
     T90: 24.8959999680519 +/- 3.18264541986977
        Measured from: 0.403999984264374
                   to: 25.2999999523163     [s; relative to TRIGTIME]
     T50: 8.79999995231628 +/- 1.15527482354514
        Measured from: 3.3759999871254
                   to: 12.1759999394417     [s; relative to TRIGTIME]


  Fluence
     Peak Flux  (peak 1 second)
        Measured from: 0.111999988555908
                   to: 1.11199998855591     [s; relative to TRIGTIME]
     Total Fluence
        Measured from: -0.423999965190887
                   to: 30.8280000090599     [s; relative to TRIGTIME]

             Band 1     Band 2     Band 3     Band 4
              15-25      25-50     50-100    100-350     keV
 Total     1.098404   1.343374   0.819190   0.128099
           0.045595   0.048525   0.043230   0.039578 [error]
 Peak      0.079878   0.097454   0.073263   0.030380
           0.009404   0.009919   0.009104   0.007818 [error]

     [ fluence units of on-axis counts / fully illuminated detector ]

======================================================================


====== Table of the duration information =============================

        Value   tstart    tstop
T100   31.252   -0.424   30.828
T90    24.896    0.404   25.300
T50     8.800    3.376   12.176
Peak    1.000    0.112    1.112


====== Spectral Analysis Summary =====================================

Model      : spectral model: simple power-law (PL) and cutoff power-law (CPL)
Ph_index   : photon index: E^{Ph_index}
Ph_90err   : 90% error of the photon index
Epeak      : Epeak in keV
Epeak_90err: 90% error of Epeak
Norm       : normalization at 50 keV in both the PL model and CPL model
Nomr_90err : 90% error of the normalization
chi2       : Chi-Squared
dof        : degree of freedo

=== Time-averaged spectral analysis ===
(Best model with acceptable fit: PL)

Model Ph_index Ph_90err_low Ph_90err_hi  Epeak  Epeak_90err_low  Epeak_90err_hi  Norm       Nomr_90err_low    Norm_90err_hi    chi2    dof
PL      -1.754    -0.087      0.086       -           -               -         7.12e-03     -3.43e-04          3.41e-04      40.690   57
CPL     -1.627    -0.202      0.338      139.007     -69.781      -139.007      8.30e-03     -1.57e-03          4.04e-03      40.230   56


=== 1-s peak spectral analysis ===
(Best model with acceptable fit: PL)

Model Ph_index Ph_90err_low Ph_90err_hi  Epeak  Epeak_90err_low  Epeak_90err_hi  Norm       Nomr_90err_low    Norm_90err_hi    chi2    dof
PL      -1.558     -0.208     0.204       -           -               -         1.77e-02     -2.08e-03          2.04e-03      53.160   57
CPL     -1.554     -0.790     0.339     9999.300      N/A           N/A         1.78e-02        N/A               N/A         53.170   56


=== Fluence/Peak Flux Summary ===

              Model    Band1     Band2     Band3     Band4     Band5     Total
                       15-25     25-50    50-100    100-350    15-150    15-350    keV
Fluence         PL   3.61e-07  5.68e-07  6.74e-07  1.55e-06  2.05e-06  3.15e-06   erg/cm2
      90%_error_low -2.73e-08 -2.58e-08 -4.47e-08 -2.10e-07 -1.03e-07 -2.48e-07   erg/cm2
      90%_error_hi   2.80e-08  2.58e-08  4.47e-08  2.32e-07  1.03e-07  2.65e-07   erg/cm2
Peak flux       PL   7.72e-01  7.51e-01  5.10e-01  5.43e-01  2.25e+00  2.58e+00   ph/cm2/s
      90%_error_low -1.42e-01 -8.55e-02 -7.84e-02 -1.55e-01 -2.47e-01 -2.86e-01   ph/cm2/s
      90%_error_hi   1.49e-01  8.47e-02  7.75e-02  1.90e-01  2.47e-01  2.89e-01   ph/cm2/s

Fluence        CPL   3.62e-07  4.93e-07  5.19e-07  1.22e-06  1.71e-06  2.58e-06   erg/cm2
      90%_error_low -3.24e-08 -3.34e-08 -4.66e-08 -4.76e-07 -1.55e-07 -2.08e-07   erg/cm2
      90%_error_hi   2.79e-08  2.78e-08  6.11e-07  3.87e-07  6.52e-08  1.81e-07   erg/cm2
Peak flux      CPL   7.72e-01  7.51e-01  5.08e-01  5.89e-01  2.25e+00  2.59e+00   ph/cm2/s
      90%_error_low     N/A       N/A   -7.73e-02     N/A   -2.47e-01 -3.66e-01   ph/cm2/s
      90%_error_hi      N/A       N/A    7.98e-02     N/A    2.47e-01  2.78e-01   ph/cm2/s

======================================================================
Image
Pre-slew 15.0-350.0 keV image (Event data)
#   RAcent    DECcent   POSerr    Theta     Phi              Peak Cts       SNR   Name
    3.8581     7.3476   0.0054    26.8872  -129.8025         2.6413841     35.381 TRIG_00726885

Foreground time interval of the image:
 -0.424  12.933 (delta_t =  13.357 [sec])
Background time interval of the image:
-182.067  -0.424 (delta_t = 181.643 [sec])
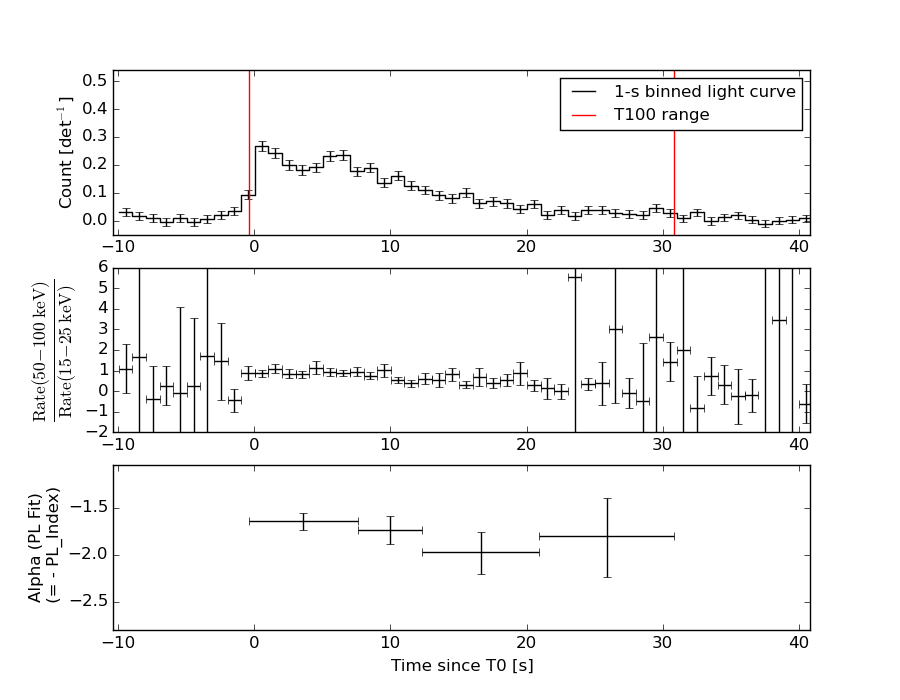
Light Curves
Note: The mask-weighted lightcurves have units of either count/det or counts/sec/det, where a det is 0.4 x 0.4 = 0.16 sq cm.
Full-time range; 1 s binning
Other quick-look light curves:
- 64 ms binning (zoomed)
- 16 ms binning (zoomed)
- 8 ms binning (zoomed)
- 2 ms binning (zoomed)
- SN=5 or 10 s binning (full-time range)
- Raw light curve
Spectra
- 64 ms binning (zoomed)
- 16 ms binning (zoomed)
- 8 ms binning (zoomed)
- 2 ms binning (zoomed)
- SN=5 or 10 s binning (full-time range)
- Raw light curve
Spectra
Notes:
- 1) The fitting includes the systematic errors.
- 2) When the burst includes telescope slew time periods, the fitting uses an average response file made from multiple 5-s response files through out the slew time plus single time preiod for the non-slew times, and weighted by the total counts in the corresponding time period using addrmf. An average response file is needed becuase a spectral fit using the pre-slew DRM will introduce some errors in both a spectral shape and a normalization if the PHA file contains a lot of the slew/post-slew time interval.
- 3) For fits to more complicated models (e.g. a power-law over a cutoff power-law), the BAT team has decided to require a chi-square improvement of more than 6 for each extra dof.
Time averaged spectrum fit using the average DRM
Power-law model
Time interval is from   -0.424 sec. to   30.828 sec.

Spectral model in power-law:
------------------------------------------------------------
Parameters  : value       lower 90%   higher 90%
Photon index: -1.7542     ( -0.0867845   0.0858496 )
Norm@50keV  : 7.12195E-03    ( -0.00034332   0.000341194 )
------------------------------------------------------------
#Fit statistic : Chi-Squared =          40.69 using 59 PHA bins.
# Reduced chi-squared =         0.7139 for     57 degrees of freedom
# Null hypothesis probability =   9.494515e-01

Photon flux (15-150 keV)    in 31.25 sec: 0.964550 ( -0.044445  0.04453 ) ph/cm2/s
Energy fluence (15-150 keV)             : 2.05348e-06 ( -1.02511e-07  1.03223e-07 ) ergs/cm2
Cutoff power-law model
Time interval is from   -0.424 sec. to   30.828 sec.
Spectral model in the cutoff power-law:
------------------------------------------------------------
Parameters  : value       lower 90%   higher 90%
Photon index: -1.62694     ( -0.202226   0.337746 )
Epeak [keV] : 139.007      ( -69.7813 -139.007 )
Norm@50keV  : 8.29815E-03    ( -0.00157229   0.00404023 )
------------------------------------------------------------
#Fit statistic : Chi-Squared =          40.23 using 59 PHA bins.
# Reduced chi-squared =         0.7183 for     56 degrees of freedom
# Null hypothesis probability =   9.445994e-01

Photon flux (15-150 keV)    in 31.25 sec: 0.956697 ( -0.048383  0.048243 ) ph/cm2/s
Energy fluence (15-150 keV)             : 1.70817e-06 ( -1.55063e-07  6.51662e-08 ) ergs/cm2
1-s peak spectrum fit
Power-law model
Time interval is from    0.112 sec. to    1.112 sec.

Spectral model in power-law:
------------------------------------------------------------
Parameters  : value       lower 90%   higher 90%
Photon index: -1.55762     ( -0.208171   0.203619 )
Norm@50keV  : 1.77416E-02    ( -0.00207611   0.00204354 )
------------------------------------------------------------
#Fit statistic : Chi-Squared =          53.16 using 59 PHA bins.
# Reduced chi-squared =         0.9327 for     57 degrees of freedom
# Null hypothesis probability =   6.197973e-01

Photon flux (15-150 keV)    in 1 sec: 2.25103 ( -0.24658  0.24696 ) ph/cm2/s
Energy fluence (15-150 keV)             : 1.66863e-07 ( -2.13573e-08  2.16668e-08 ) ergs/cm2
Cutoff power-law model
Time interval is from    0.112 sec. to    1.112 sec.
Spectral model in the cutoff power-law:
------------------------------------------------------------
Parameters  : value       lower 90%   higher 90%
Photon index: -2.25245     ( -0.0911074   1.03724 )
Epeak [keV] : 92.3761      (   )
Norm@50keV  : 7.64450E-03    (     )
------------------------------------------------------------
#Fit statistic : Chi-Squared =          52.17 using 59 PHA bins.
# Reduced chi-squared =         0.9316 for     56 degrees of freedom
# Null hypothesis probability =   6.206574e-01

Photon flux (15-150 keV)    in 1 sec: 2.25090 ( -0.24679  0.24679 ) ph/cm2/s
Energy fluence (15-150 keV)             : 1.68043e-07 ( -2.80295e-08  1.06675e-08 ) ergs/cm2
Time-resolved spectra
Distribution
T90 vs. Hardness ratio plot
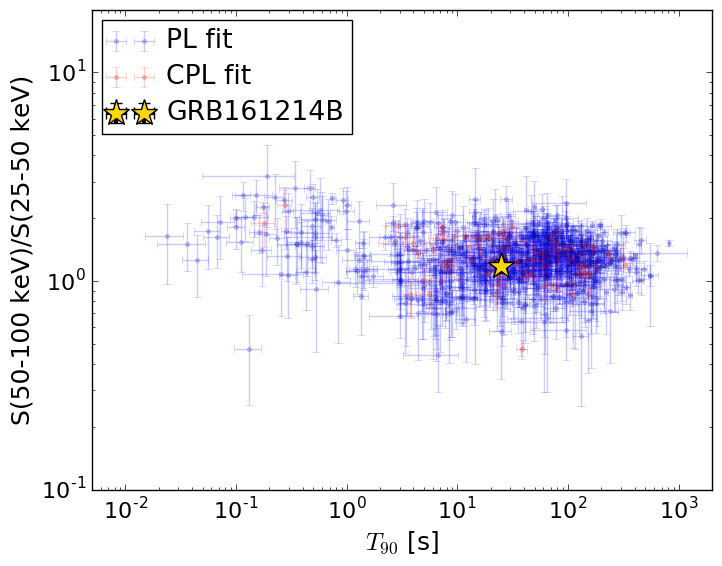
T90                                   = 24.896 sec.
Hardness ratio (energy fluence ratio) = 1.1857962893
S(15-50 keV) vs. S(50-150 keV) plot
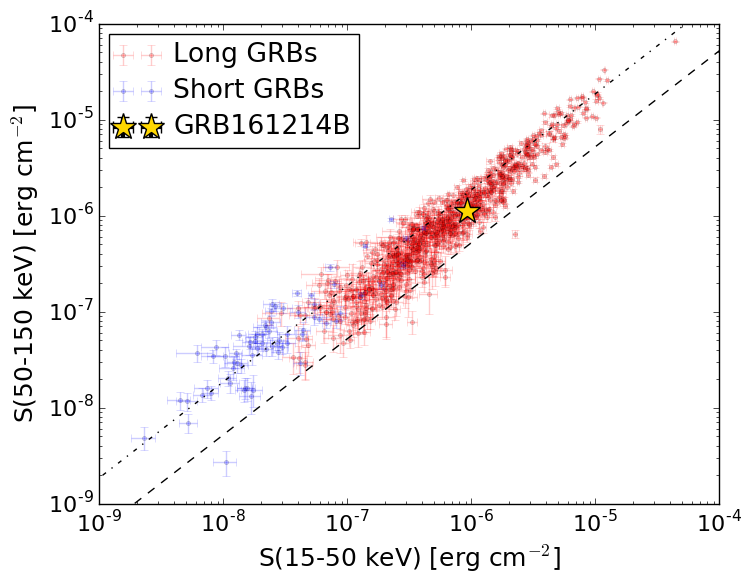
S(15-50 keV)  = 9.2909e-07
S(50-150 keV) = 1.1243872e-06
The dash-dotted line and the dashed line traces the fluences calculated from the Band function with Epeak = 15 and 150 keV, respectively. Both lines assume a canonical values of alpha = -1 and beta = -2.5.
Mask shadow pattern
IMX = -3.245836867057915E-01, IMY = 3.895425678363345E-01
Spacecraft aspect plot
Bright source in the pre-burst/pre-slew/post-slew images
Pre-burst image of 15-350 keV band
Time interval of the image:
-182.067400 -0.424000

# RAcent  DECcent POSerr Theta    Phi  PeakCts   SNR AngSep     Name
#  [deg]    [deg]    ['] [deg]  [deg]                   [']
 48.6719 -13.8462    2.1  47.3  148.4   3.6177   5.4 ------	UNKNOWN
  1.6581 -26.5637    2.6  57.2 -154.1   5.7424   4.4 ------	UNKNOWN
333.7240  41.7137    3.1  43.2  -53.9   2.2483   3.7 ------	UNKNOWN
331.5570  37.3421    4.5  44.8  -60.3   2.5979   2.5 ------	UNKNOWN
Pre-slew background subtracted image of 15-350 keV band
Time interval of the image:
-0.424000 12.932600

# RAcent  DECcent POSerr Theta    Phi  PeakCts   SNR AngSep     Name
#  [deg]    [deg]    ['] [deg]  [deg]                   [']
 53.9613  -7.7836    2.5  45.3  137.6   0.8786   4.6 ------	UNKNOWN
  3.8581   7.3476    0.3  26.9 -129.8   2.6411  35.4  497.6	UNKNOWN
322.7611  50.3082    2.9  51.4  -43.0   1.0496   4.1 ------	UNKNOWN
Post-slew image of 15-350 keV band
Time interval of the image:
63.932600 955.532600

# RAcent  DECcent POSerr Theta    Phi  PeakCts   SNR AngSep     Name
#  [deg]    [deg]    ['] [deg]  [deg]                   [']
326.1852  38.5199   12.7  46.0  -19.2  -1.1941  -0.9   11.9	Cyg X-2
 31.8559  30.6752    4.2  35.1   67.1   3.7730   2.8 ------	UNKNOWN
  7.9870  16.2403    2.4   9.8   46.5   2.7619   4.9 ------	UNKNOWN
339.5976  17.2480    2.4  25.6  -42.6   3.2544   4.9 ------	UNKNOWN
359.4492 -49.7306    4.2  57.2 -154.2  12.9046   2.8 ------	UNKNOWN
327.9594  -9.4437    4.0  39.5  -92.2   9.2569   2.9 ------	UNKNOWN
331.4498 -19.2391    4.1  41.6 -107.9   8.7400   2.9 ------	UNKNOWN