Analysis Summary
Notes:
- 1) No attempt has been made to eliminate the non-significant decimal places.
- 2) This batgrbproduct analysis is done using the HEASARC data.
- 3) This batgrbproduct analysis is using the flight position for the mask-weighting calculation.
======================================================================
BAT GRB EVENT DATA PROCESSING REPORT
Process Script Ver: batgrbproduct v2.46
Process Start Time: Wed Jan 4 17:30:57 EST 2017
Host Name: bat1
Current Working Dir: /local/data/bat1/alien/Swift_3rdBATcatalog/event/batevent_reproc/trigger727541
======================================================================
Trigger: 00727541 Segment: 000
BAT Trigger Time: 503866136.64 [s; MET]
Trigger Stop: 503866137.152 [s; MET]
UTC: 2016-12-19T18:48:39.308260 [includes UTCF correction]
Where From?: TDRSS position message
BAT
RA: 91.7173166987563 Dec: -26.7900102183723 [deg; J2000]
Catalogged Source?: NO
Point Source?: YES
GRB Indicated?: YES [ by BAT flight software ]
Image S/N Ratio: 7.78
Image Trigger?: NO
Rate S/N Ratio: 14.5258390463339 [ if not an image trigger ]
Image S/N Ratio: 7.78
Analysis Position: [ source = BAT ]
RA: 91.7173166987563 Dec: -26.7900102183723 [deg; J2000]
Refined Position: [ source = BAT pre-slew burst ]
RA: 91.7159522110343 Dec: -26.8012583033771 [deg; J2000]
{ 06h 06m 51.8s , -26d 48' 04.5" }
+/- 0.877838125941531 [arcmin] (estimated 90% radius based on SNR)
+/- 0.269374713552316 [arcmin] (formal 1-sigma fit error)
SNR: 36.6399519661241
Angular difference between the analysis and refined position is 0.678830 arcmin
Partial Coding Fraction: 0.4921875 [ including projection effects ]
Duration
T90: 6.93199992179871 +/- 0.793180905778267
Measured from: 0.0480000376701355
to: 6.97999995946884 [s; relative to TRIGTIME]
T50: 2.45199990272522 +/- 0.373909090932152
Measured from: 1.42800003290176
to: 3.87999993562698 [s; relative to TRIGTIME]
Fluence
Peak Flux (peak 1 second)
Measured from: 1.55599999427795
to: 2.55599999427795 [s; relative to TRIGTIME]
Total Fluence
Measured from: -0.53600001335144
to: 8.3759999871254 [s; relative to TRIGTIME]
Band 1 Band 2 Band 3 Band 4
15-25 25-50 50-100 100-350 keV
Total 0.777978 1.046229 0.617760 0.131593
0.034686 0.037015 0.031340 0.023604 [error]
Peak 0.160901 0.248936 0.163521 0.046570
0.013290 0.014511 0.012566 0.008831 [error]
[ fluence units of on-axis counts / fully illuminated detector ]
======================================================================
====== Table of the duration information =============================
Value tstart tstop
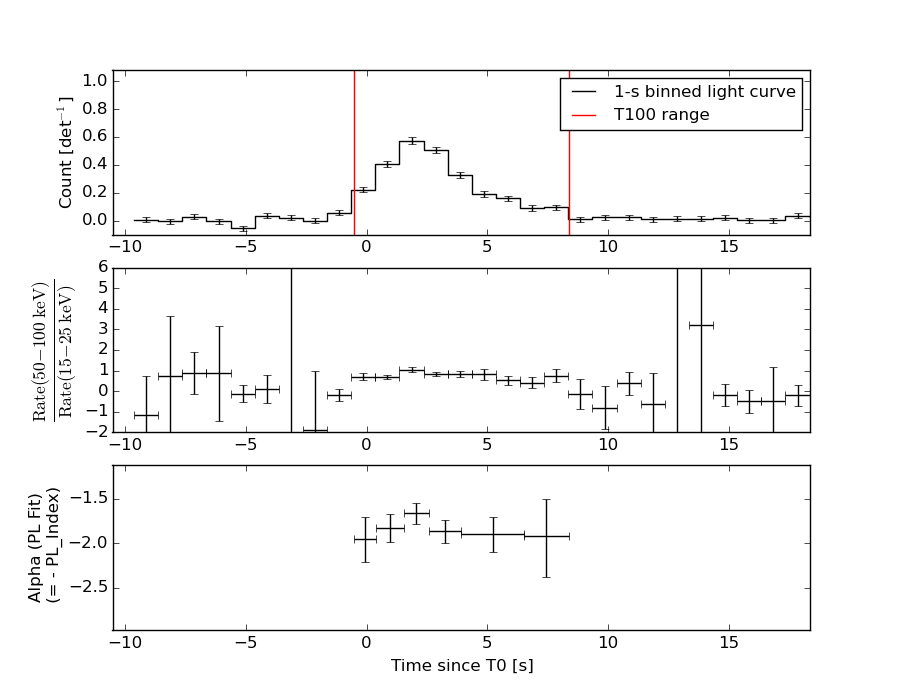
T100 8.912 -0.536 8.376
T90 6.932 0.048 6.980
T50 2.452 1.428 3.880
Peak 1.000 1.556 2.556
====== Spectral Analysis Summary =====================================
Model : spectral model: simple power-law (PL) and cutoff power-law (CPL)
Ph_index : photon index: E^{Ph_index}
Ph_90err : 90% error of the photon index
Epeak : Epeak in keV
Epeak_90err: 90% error of Epeak
Norm : normalization at 50 keV in both the PL model and CPL model
Nomr_90err : 90% error of the normalization
chi2 : Chi-Squared
dof : degree of freedo
=== Time-averaged spectral analysis ===
(Best model with acceptable fit: PL)
Model Ph_index Ph_90err_low Ph_90err_hi Epeak Epeak_90err_low Epeak_90err_hi Norm Nomr_90err_low Norm_90err_hi chi2 dof
PL -1.844 -0.080 0.079 - - - 1.88e-02 -8.79e-04 8.75e-04 53.080 57
CPL -1.294 -0.337 0.367 61.877 -9.264 24.539 3.61e-02 -1.17e-02 1.94e-02 44.960 56
=== 1-s peak spectral analysis ===
(Best model with acceptable fit: N/A)
Model Ph_index Ph_90err_low Ph_90err_hi Epeak Epeak_90err_low Epeak_90err_hi Norm Nomr_90err_low Norm_90err_hi chi2 dof
PL -1.669 -0.115 0.113 - - - 4.03e-02 -2.89e-03 2.88e-03 91.720 57
CPL -0.852 -0.525 0.604 66.990 -11.792 36.994 1.09e-01 -5.05e-02 1.16e-01 84.240 56
=== Fluence/Peak Flux Summary ===
Model Band1 Band2 Band3 Band4 Band5 Total
15-25 25-50 50-100 100-350 15-150 15-350 keV
Fluence PL 2.96e-07 4.41e-07 4.91e-07 1.03e-06 1.54e-06 2.26e-06 erg/cm2
90%_error_low -2.14e-08 -1.99e-08 -3.06e-08 -1.29e-07 -7.24e-08 -1.57e-07 erg/cm2
90%_error_hi 2.19e-08 1.98e-08 3.05e-08 1.40e-07 7.26e-08 1.65e-07 erg/cm2
Peak flux PL 1.95e+00 1.78e+00 1.12e+00 1.07e+00 5.30e+00 5.92e+00 ph/cm2/s
90%_error_low -2.14e-01 -1.27e-01 -1.00e-01 -1.79e-01 -3.72e-01 -4.05e-01 ph/cm2/s
90%_error_hi 2.20e-01 1.27e-01 9.96e-02 1.98e-01 3.73e-01 4.06e-01 ph/cm2/s
Fluence CPL N/A N/A N/A N/A N/A N/A erg/cm2
90%_error_low -2.14e-08 -1.99e-08 -3.06e-08 -1.29e-07 -7.24e-08 -1.57e-07 erg/cm2
90%_error_hi 2.19e-08 1.98e-08 3.05e-08 1.40e-07 7.26e-08 1.65e-07 erg/cm2
Peak flux CPL 1.89e+00 1.45e+00 7.76e-01 7.04e-01 4.41e+00 4.82e+00 ph/cm2/s
90%_error_low -2.66e-01 -1.59e-01 -1.15e-01 -9.21e-02 -4.42e-01 -3.33e-01 ph/cm2/s
90%_error_hi 2.66e-01 1.63e-01 5.96e-02 7.89e-02 4.74e-01 4.33e-01 ph/cm2/s
======================================================================
Image
Pre-slew 15.0-350.0 keV image (Event data)
#   RAcent    DECcent   POSerr    Theta     Phi              Peak Cts       SNR   Name
   91.7160   -26.8013   0.0052    39.3860   174.0539         2.6871238     36.640 TRIG_00727541

Foreground time interval of the image:
 -0.536   8.376 (delta_t =   8.912 [sec])
Background time interval of the image:
-239.640  -0.536 (delta_t = 239.104 [sec])
Light Curves
Note: The mask-weighted lightcurves have units of either count/det or counts/sec/det, where a det is 0.4 x 0.4 = 0.16 sq cm.
Full-time range; 1 s binning
Other quick-look light curves:
- 64 ms binning (zoomed)
- 16 ms binning (zoomed)
- 8 ms binning (zoomed)
- 2 ms binning (zoomed)
- SN=5 or 10 s binning (full-time range)
- Raw light curve
Spectra
- 64 ms binning (zoomed)
- 16 ms binning (zoomed)
- 8 ms binning (zoomed)
- 2 ms binning (zoomed)
- SN=5 or 10 s binning (full-time range)
- Raw light curve
Spectra
Notes:
- 1) The fitting includes the systematic errors.
- 2) When the burst includes telescope slew time periods, the fitting uses an average response file made from multiple 5-s response files through out the slew time plus single time preiod for the non-slew times, and weighted by the total counts in the corresponding time period using addrmf. An average response file is needed becuase a spectral fit using the pre-slew DRM will introduce some errors in both a spectral shape and a normalization if the PHA file contains a lot of the slew/post-slew time interval.
- 3) For fits to more complicated models (e.g. a power-law over a cutoff power-law), the BAT team has decided to require a chi-square improvement of more than 6 for each extra dof.
Time averaged spectrum fit using the average DRM
Power-law model
Time interval is from   -0.536 sec. to    8.376 sec.

Spectral model in power-law:
------------------------------------------------------------
Parameters  : value       lower 90%   higher 90%
Photon index: -1.84416     ( -0.0800909   0.0790899 )
Norm@50keV  : 1.87926E-02    ( -0.000878568   0.00087453 )
------------------------------------------------------------
#Fit statistic : Chi-Squared =          53.08 using 59 PHA bins.
# Reduced chi-squared =         0.9312 for     57 degrees of freedom
# Null hypothesis probability =   6.230034e-01

Photon flux (15-150 keV)    in 8.912 sec: 2.63540 ( -0.12238  0.12267 ) ph/cm2/s
Energy fluence (15-150 keV)             : 1.54033e-06 ( -7.24028e-08  7.26336e-08 ) ergs/cm2
Cutoff power-law model
Time interval is from   -0.536 sec. to    8.376 sec.
Spectral model in the cutoff power-law:
------------------------------------------------------------
Parameters  : value       lower 90%   higher 90%
Photon index: -1.29361     ( -0.337473   0.366627 )
Epeak [keV] : 61.8766      ( -9.26421 24.5389 )
Norm@50keV  : 3.61368E-02    ( -0.0117173   0.0194173 )
------------------------------------------------------------
#Fit statistic : Chi-Squared =          44.96 using 59 PHA bins.
# Reduced chi-squared =         0.8029 for     56 degrees of freedom
# Null hypothesis probability =   8.545634e-01

Photon flux (15-150 keV)    in 8.912 sec: 2.55482 ( -0.13102  0.13141 ) ph/cm2/s
Energy fluence (15-150 keV)             : 0 ( 0  0 ) ergs/cm2
1-s peak spectrum fit
Power-law model
Time interval is from    1.556 sec. to    2.556 sec.

Spectral model in power-law:
------------------------------------------------------------
Parameters  : value       lower 90%   higher 90%
Photon index: -1.6694     ( -0.114646   0.112971 )
Norm@50keV  : 4.02942E-02    ( -0.00289238   0.0028778 )
------------------------------------------------------------
#Fit statistic : Chi-Squared =          91.72 using 59 PHA bins.
# Reduced chi-squared =          1.609 for     57 degrees of freedom
# Null hypothesis probability =   2.417836e-03

Photon flux (15-150 keV)    in 1 sec: 5.29579 ( -0.37249  0.37294 ) ph/cm2/s
Energy fluence (15-150 keV)             : 3.74111e-07 ( -2.80999e-08  2.82446e-08 ) ergs/cm2
Cutoff power-law model
Time interval is from    1.556 sec. to    2.556 sec.
Spectral model in the cutoff power-law:
------------------------------------------------------------
Parameters  : value       lower 90%   higher 90%
Photon index: -0.851897     ( -0.525392   0.604212 )
Epeak [keV] : 66.9895      ( -11.7911 36.9951 )
Norm@50keV  : 0.108628    ( -0.0505174   0.116262 )
------------------------------------------------------------
#Fit statistic : Chi-Squared =          84.24 using 59 PHA bins.
# Reduced chi-squared =          1.504 for     56 degrees of freedom
# Null hypothesis probability =   8.674589e-03

Photon flux (15-150 keV)    in 1 sec: 4.40546 ( -0.44189  0.47416 ) ph/cm2/s
Energy fluence (15-150 keV)             : 3.54111e-07 ( -3.13434e-08  3.13319e-08 ) ergs/cm2
Time-resolved spectra
Distribution
T90 vs. Hardness ratio plot
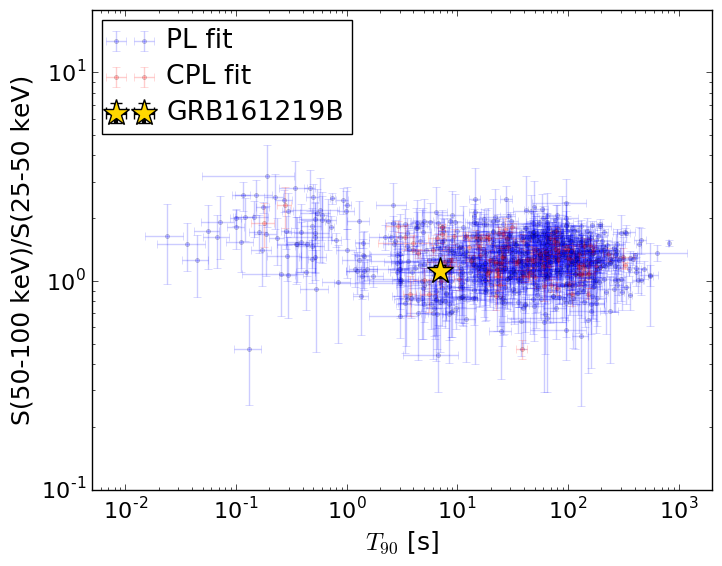
T90                                   = 6.932 sec.
Hardness ratio (energy fluence ratio) = 1.11411506864
S(15-50 keV) vs. S(50-150 keV) plot
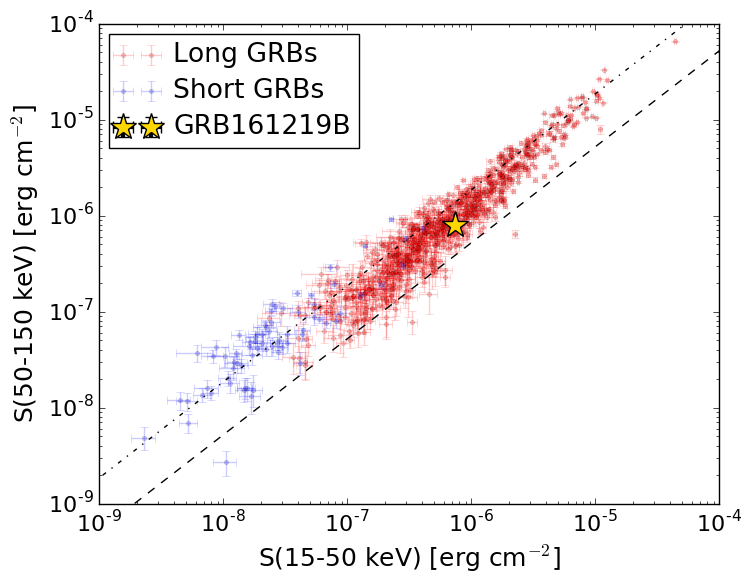
S(15-50 keV)  = 7.364588e-07
S(50-150 keV) = 8.038739e-07
The dash-dotted line and the dashed line traces the fluences calculated from the Band function with Epeak = 15 and 150 keV, respectively. Both lines assume a canonical values of alpha = -1 and beta = -2.5.
Mask shadow pattern
IMX = -8.165842059037335E-01, IMY = -8.505038678301831E-02
Spacecraft aspect plot
Bright source in the pre-burst/pre-slew/post-slew images
Pre-burst image of 15-350 keV band
Time interval of the image:
-239.640000 -0.536000

# RAcent  DECcent POSerr Theta    Phi  PeakCts   SNR AngSep     Name
#  [deg]    [deg]    ['] [deg]  [deg]                   [']
 83.6356  22.0162    0.3  22.3   68.5   9.8289  37.3    0.2	Crab
108.8711 -16.3582    2.2  45.7  147.3   3.6948   5.3 ------	UNKNOWN
 82.6723  28.8121    2.6  27.1   56.7   1.3838   4.5 ------	UNKNOWN
 41.6312   0.9536    2.3  26.9  -70.4   1.5464   5.1 ------	UNKNOWN
 26.0660  25.4912    3.1  45.1  -30.8   1.6815   3.8 ------	UNKNOWN
 75.6335 -50.6291    2.8  56.4 -157.5   6.5551   4.1 ------	UNKNOWN
 71.4186 -51.7313    4.4  57.2 -154.2   5.0114   2.6 ------	UNKNOWN
Pre-slew background subtracted image of 15-350 keV band
Time interval of the image:
-0.536000 8.376000

# RAcent  DECcent POSerr Theta    Phi  PeakCts   SNR AngSep     Name
#  [deg]    [deg]    ['] [deg]  [deg]                   [']
 83.6269  22.0372   37.0  22.3   68.4  -0.0168  -0.3    1.4	Crab
 78.1352  26.7781    2.2  23.4   50.8   0.2654   5.3 ------	UNKNOWN
 91.7161 -26.8004    0.3  39.4  174.1   2.7015  36.8 ------	UNKNOWN
 63.2393  -4.9715    2.6  11.5 -126.0   0.1707   4.4 ------	UNKNOWN
 23.8612  36.0101    2.4  50.9  -18.7   0.4964   4.8 ------	UNKNOWN
 54.4571 -21.9187    2.4  30.5 -126.0   0.2829   4.8 ------	UNKNOWN
 72.0510 -49.1232    2.7  54.6 -154.9   0.8275   4.3 ------	UNKNOWN
Post-slew image of 15-350 keV band
Time interval of the image:
90.660590 962.455900

# RAcent  DECcent POSerr Theta    Phi  PeakCts   SNR AngSep     Name
#  [deg]    [deg]    ['] [deg]  [deg]                   [']
135.5744 -40.6264    3.4  38.6 -143.1   3.0522   3.4    4.8	Vela X-1
 97.0162  13.5643    2.9  40.7  102.4   7.8665   4.0 ------	UNKNOWN
 40.4958  -3.3441    3.6  54.2   20.9  12.3530   3.3 ------	UNKNOWN
 84.0848 -20.1093    2.8   9.7   46.6   1.9721   4.1 ------	UNKNOWN
 26.9853 -20.9249    3.8  58.9   -4.9  12.1937   3.0 ------	UNKNOWN
 26.7253 -21.7396    2.5  58.8   -5.9  18.1891   4.6 ------	UNKNOWN
157.6447 -33.7981    3.8  56.4 -151.2   9.6577   3.0 ------	UNKNOWN
124.4898 -62.3410    3.7  41.6 -107.8   8.8334   3.2 ------	UNKNOWN
 32.5382 -53.8173    4.0  50.6  -44.6   9.4335   2.9 ------	UNKNOWN